
 ?Mathematical formulae have been encoded as MathML and are displayed in this HTML version using MathJax in order to improve their display. Uncheck the box to turn MathJax off. This feature requires Javascript. Click on a formula to zoom.
Abstract
Black communities in the United States have been disproportionately affected by the COVID-19 pandemic; however, few empirical studies have been conducted to examine the conditions of Black-owned businesses in the United States during this challenging time. In this article, we assess the circumstances of Black-owned restaurants during the entire year of 2020 through a longitudinal quantitative analysis of restaurant patronage. Using multiple sources of geospatial big data, the analysis reveals that most Black-owned restaurants in this study are disproportionately affected by the COVID-19 pandemic among different cities in the United States over time. The finding reveals the need for a more in-depth understanding of Black-owned restaurants’ situations during the pandemic and further indicates the significance of carrying out place-based relief strategies. Our findings also urge big tech companies to improve existing Black-owned business campaigns to enable sustainable support. As the first to systematically examine the racialization of locational information, this article implies that geographic information systems (GIS) development should not be detached from human experience, especially that of minorities. A humanistic rewiring of GIS is envisioned to achieve a more racially equitable world.
美国黑人社区受新冠肺炎流行病的影响尤其严重。然而, 在这个充满挑战的时期, 很少有美国黑人商业状况的实证研究。我们通过对餐馆客流量的纵向定量分析, 评估了2020年黑人餐馆的状况。多源地理空间大数据的分析显示, 本研究中的大多数黑人餐馆在美国不同城市中不成比例地受到新冠肺炎流行病的影响。这说明了更深入了解疫情期间黑人餐馆状况的必要性, 也进一步证明了实施本地化救助策略的重要性。研究结果还敦促大型科技公司改善现有的黑人商业活动, 提供可持续的支持。本文首次系统性地研究了地理信息的种族化, 这意味着地理信息系统(GIS)的发展不应脱离人类尤其是少数民族的经验。本文设想了GIS的人文化, 以实现一个种族更加平等的世界。
Las comunidades negras de los Estados Unidos han sido afectadas de manera desproporcionada por la pandemia del COVID-19; sin embargo, muy pocos estudios empíricos se han emprendido para examinar las condiciones de los negocios que son propiedad de los negros en este país durante esta época de retos y dificultades mayores. En este artículo, evaluamos las circunstancias de los restaurantes pertenecientes a esta población durante todo el año 2020, por medio de un análisis cuantitativo longitudinal del patronato de restaurantes. Al usar múltiples fuentes de big data geoespaciales, el análisis revela en este estudio que la mayoría de los restaurantes de propietarios negros están afectados de manera desproporcionada por la pandemia del COVID-19 en diferentes ciudades de los Estados Unidos, a lo largo del tiempo. Este descubrimiento pone de manifiesto la necesidad de un conocimiento más profundo de las situaciones de los restaurantes de propiedad negra durante la pandemia e indica además la significancia de llevar a efecto estrategias de ayuda, según el lugar. Nuestros hallazgos urgen también a las grandes compañías tecnológicas a mejorar sus campañas de negocios de propiedad negra, que propendan por un apoyo sostenible. El artículo, primero en examinar sistemáticamente la racialización de la información locacional, implica que el desarrollo de los sistemas de información geográfica (SIG) no debe desvincularse de la experiencia humana, en especial la de las minorías. Se arguye por una reconfiguración humanística de los SIG para lograr un mundo más equitativo en lo que a lo racial concierne.
The COVID-19 pandemic has affected almost every aspect of our lives since the end of 2019. In addition to the millions of deaths and sicknesses, the pandemic’s spillover effects on the economy, especially the catering industry, have also been devastating. Because preventive measures for the disease require avoidance of close physical contact (Centers for Disease Control and Prevention Citation2021; World Health Organization Citation2021), restaurants, along with many other service businesses, have been hard hit, with many of them closing and many becoming financially fragile (Bartik et al. Citation2020). Notably, the pandemic has had a differential impact on Black communities in the United States (Gray et al. Citation2020), with many reports that Black-owned businesses have been profoundly and disproportionately challenged by it (Alcorn Citation2020; Leatherby Citation2020; Brooks Citation2021). Some quantitative estimations of Black-owned businesses were based on prepandemic records as well as the racial composition of the recipients of the federal economic assistance programs (Dua et al. Citation2020; Mills and Battisto Citation2020), and other efforts adopted surveys of business owners to assess the operational conditions (Fairlie Citation2020; U.S. Federal Reserve Banks Citation2021). Most of the existing literature on the pandemic’s economic impacts on Black-owned businesses in the United States, however, as cited earlier, are still based on the survey data collected during the early stages of or even before the pandemic. To the best of our knowledge, as of today, few empirical studies have examined how Black-owned businesses in the United States have been influenced at the city and national scales throughout the pandemic.
Therefore, we conducted this study to evaluate the impacts of the pandemic on Black-owned restaurants using multiple sources of geospatial big data. Specifically, by paring the point-of-interest (POI) based human mobility data with POI type and ownership information, we built a data set of visitations to Black-owned restaurants and other restaurants. We then performed statistical analysis on the data and derived not only the aggregated annual restaurant visitation losses from 2019 to 2020, but also a more detailed view of weekly visitation pattern changes in 2020 for each selected city in this study.
Our study will contribute to the existing literature on how the Black community in the United States has been affected by the pandemic on two primary fronts. First, our research findings will serve as empirical evidence for this critical situation confronted by Black-owned restaurants. In addition to supporting the general claim that the pandemic has had differential impacts on Black communities, our work offers a more spatially and temporally detailed investigation of Black-owned restaurants in particular. On a practical level, the spatiotemporal details of this study will provide opportunities for in-depth assessments of the governmental and societal responses to support minority groups in crisis. Thus, our work calls for more targeted, place-based strategies to help Black-owned restaurant owners to overcome the additional difficulties brought on by the pandemic. Moreover, our critical reflection on the tech companies’ racialization of locational information suggests a humanistic rewiring of geographic information systems (GIS) to inform more systematic and sustainable support for the minorities.
As scholars who are not personally part of the Black community in the United States, we have concerns that our voices might not be fully representative. We are confident, though, that our work is worthwhile, as it provides support to Black and potentially other minority communities who have long been in disadvantaged positions. As an early example, Ley and Cybriwsky (Citation1974) ensured that the voice of Black communities would be heard by a broader audience through their groundbreaking work on racial tension and urban graffiti in Philadelphia. They featured a Black woman’s description of the daily discrimination she endured when entering White neighborhoods. More recently, Shannon (Citation2021) examined how food accessibility, especially in neighborhoods of color, has been constantly affected by the long histories of racial exclusion. Among the rising concerns about systemic racism, an increasing number of Black scholars have made significant contributions to Black-related studies, including research on Black businesses and Black food culture. Wingfield and Taylor (Citation2016) revealed that many Black business owners chose entrepreneurial ventures to avoid the racism inherent in the labor market. Reese (Citation2019) explored how and why social and economic inequities forced Black communities to become self-reliant in her book Black Food Geographies. Nevertheless, there is still much work to be done. As McKittrick (Citation2006) stated, “Black matters are spatial matters” (xii). We intend to appropriately use GIS skills and technology—primarily the capacity of easier access to GIS computational resources—to join the collective cause of understanding the minority groups’ lived experiences and informing needed efforts in addressing social inequity.
The remaining sections of this article proceed as follows: The next section reviews related literature on the circumstances of the Black communities during the COVID-19 pandemic and studies of human mobility inference using geospatial big data. Then, we explain how data were acquired and combined in the study. We then outline the methods used for the geostatistical analysis and present the results. Based on the results, we discuss the operating conditions of Black-owned restaurants, corresponding relief policies, and the “Black-owned” label that burst onto the scene in 2020. The article concludes with a summary, limitations of our work, and future research directions.
Related Work
Black Communities in the Time of COVID-19
Black communities in the United States have been disproportionately affected by the COVID-19 pandemic both medically and economically. Not surprisingly, a great deal of initial research focused on the infection and death rates in various communities. Millett et al.’s (Citation2020) early investigation on the association between COVID-19 diagnoses and racial and ethnic groups revealed that during the initial phase of the virus spread in the United States, counties with disproportionately larger Black populations had higher prevalence and morbidities. Wiley et al. (Citation2021) also reported higher COVID-19 hospitalization rates of Black patients. In addition to the obvious medical issues, the pandemic has also presented an unprecedented challenge to the economy, by which micro and small businesses were more disturbed as their normal operation usually requires physical proximity (Belitski et al. Citation2021). Dube, Nhamo, and Chikodzi (Citation2021) observed a sharp global decline of sit-in restaurant customers from mid-February to late-March 2020 using the data from OpenTable, an online restaurant reservation booking platform. Another early investigation based on the Current Population Survey in the United States (Fairlie Citation2020) showed a decline of 22 percent in the number of active businesses in the United States in early 2020. The study revealed that 41 percent of Black businesses were closed from February to April 2020, whereas the number for White-owned businesses was 17 percent. Through using several pre- and early-pandemic data sources, such as the 2019 Small Business Credit Survey (SBCS) by the U.S. Federal Reserve Banks, and the small business financial survey by McKinsey in May 2020, Dua et al. (Citation2020) also suggested that Black-owned businesses were more vulnerable during the pandemic. Mills and Battisto (Citation2020) arrived at a similar conclusion using a combination of U.S. census data, data on the geographic reach of the Paycheck Protection Program (PPP), and the SBCS data. The most recent 2020 SBCS (U.S. Federal Reserve Banks Citation2021) helped prove that Black-owned businesses faced the most significant financial stress in 2020 among all racial and ethnic groups in that 92 percent of Black-owned firms reported experiencing financial challenges. Thus, the pandemic is exerting differential impacts on Black communities due to the entrenched systematic inequity in U.S. society (Dyer Citation2020; Gray et al. Citation2020; Moore et al. Citation2020). Yet it is worth noting that survey data, which are the main type of data used in almost all the existing studies, could be negatively influenced by response biases, especially from surveys on politically sensitive topics and conducted in such a challenging time. Meanwhile, all authors mentioned that future efforts are needed to examine the long-term impacts of the pandemic. The limitations with the previous studies signify the need for a more up-to-date assessment of the pandemic’s impacts on Black-owned businesses with alternative data sources.
The year of 2020 was also an unprecedented year for the Black Lives Matter (BLM) movement, as the scale of the protests for racial justice and civil rights made it possibly the largest in U.S. history (Buchanan, Bui, and Patel Citation2020). This movement was formed in 2013 with the hashtag #BlackLivesMatter, which became omnipresent on social media in response to the acquittal of George Zimmermann, who shot seventeen-year-old African American Trayvon Martin (Francis and Wright-Rigueur Citation2021). In 2020, the murder of George Floyd, also an African American, by Minneapolis police officer Derek Chauvin, sparked the national, if not worldwide, increased demand for racial justice (Westerman, Benk, and Greene Citation2020). Among all types of activism undertakings, supporting Black-owned businesses is an important way to support historically disadvantaged Black communities. In response to this call, many well-known multibillion-dollar companies, such as Yelp, Uber, Doordash, and Google (Uber Citation2020; Xu Citation2020; Yelp Citation2020; Rayome Citation2021), have added the “Black-owned” label to indicate support of this cause. This new label as a crucial approach to racialize online locational information will allow us to study the influence of the COVID-19 pandemic on Black-owned restaurants in the United States.
Human Mobility Inference Using Geospatial Big Data
The emerging trends of geospatial big data (Lee and Kang Citation2015) and human dynamics (Shaw, Tsou, and Ye Citation2016), fueled by the rapid development of location-based services, have led to an exponential growth of available human mobility data that document spatially explicit interactions among individuals and places, as well as advanced mobility analytical approaches that capture fine-grained visitation patterns. These fine-grained human mobility data have enabled researchers to investigate the short- and long-term societal and economic effects of the COVID-19 pandemic and understand how social interactions and place connectivity have transformed during, under, and after the pandemic (Zhang, Xu, and Zhao Citation2022). Numerous efforts have been made to harness the power of geospatial big data from a variety of sources to understand the impact of the pandemic on human interactions and place visitations. Among these data sources, social media has received much attention. Leveraging millions of geotagged tweets (i.e., Twitter posts with geospatial information), Huang, Xu, et al. (Citation2020) found that mobility patterns obtained from Twitter data are amenable to quantitatively reflect mobility dynamics, as they found strong human mobility reduction in the United States, especially in March, April, and May 2020, resulting from the implemented mobility-reducing measures. Collaborating with Facebook Data for Good, Chang et al. (Citation2021) used Facebook colocation data and Facebook movement data in Taiwan to unravel movement patterns and assessed the potential effects of local travel restrictions. Despite the previously mentioned efforts, sparse spatiotemporal granularity, user profile biases, and inconsistency in geopositioning accuracy of social media have prevented scholars from investigations that require detailed users’ trajectories or demand fine-granularity place visitation patterns. Similar to social media that requires users’ posting actions for their position retrieval (only if the user setting permits location sharing), numerous cell phone applications (e.g., navigation applications such as Google Maps and Apple Maps) retrieve users’ positions only when requested. For example, Google (Citation2020) released mobility reports that chart movement trends over time, across six different categories, including retail and recreation, groceries and pharmacies, parks, transit stations, workplaces, and residential. Such records, however, fail to provide insights into the large-scale visitation patterns of spatially explicit places (Huang, Lu, et al. Citation2022) and could be useful only when combined with data from other sources (Zhang, Xu, and Zhao Citation2022).
In past five years, companies such as SafeGraph (https://www.safegraph.com), Cuebiq (https://www.cuebiq.com), and Foursquare (https://foursquare.com) started to offer place visitation patterns as part of the commercialized location intelligence. To protect privacy, such data are provided in aggregated forms and personally identifiable information has been removed. Such data have seeded a variety of investigations into the changing patterns of place visitation, especially during the pandemic. For example, Li et al. (Citation2021) examined the effect of social distancing on changes in visits to urban POIs in sixteen cities in the United States and found disparate patterns across cities in terms of reduction in POI visitors. Kupfer et al. (Citation2021) used mobility records released by SafeGraph to map and analyze the spatiotemporal patterns of visits to six national parks in the western United States. Wang et al. (Citation2021) explored the temporal patterns of visits to health care POIs and examined how these patterns are associated with sociodemographic and spatial characteristics. Chalfin, Danagoulian, and Deza (Citation2021) investigated the visits to bars and liquor stores in Detroit and further correlated the visits to alcohol outlets with domestic violence. These studies benefited from the high representativeness and dense spatiotemporal granularity of cellphone-derived place visitation dynamics. Despite these efforts, to our best knowledge, few studies have been conducted on the impact of ownership on the catering industry in the United States and how such impact differs throughout the country. This study aims to fill this gap.
Data Sets
Sampling Frame
In this study, twenty U.S. cities were selected to better observe the differences across various geographic locations and to maximize spatial representativeness. We considered total population count, Black population count, Black population percentage, and geographic locations to maximize the sample representativeness. The demographic characteristics used in this study were from the 2019 American Community Survey (ACS) five-year population estimates. The primary factor is the total population of a city, as it influences the total number of restaurants and the need for restaurants in the city. Then, to maximize the likelihood of including a sufficient number of Black-owned restaurants, we referred to the total Black populations and the Black population percentages of the cities. Finally, we examined the geographical distribution of the cities to ensure a geographically balanced sample. Due to historical reasons, there are higher concentrations of Black people in the southern and eastern parts of the United States. Although our balanced city selection still reflects this spatial pattern, it prevents sample cities from being excessively clustered in southern and eastern states. Through our holistic approach that uses the multiple factors that were mentioned earlier, we selected a sample of twenty cities: Atlanta, Baltimore, Charlotte, Chicago, Dallas, Denver, Detroit, Houston, Las Vegas, Los Angeles, Memphis, Miami, Minneapolis, New Orleans, New York City, Philadelphia, Phoenix, San Francisco, Seattle, and Washington, DC.
Black-Owned Restaurants on Yelp
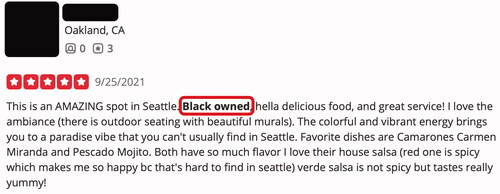
In June 2020, Yelp, a well-known crowd-sourced business review website in the United States, introduced a searchable feature that allows owners to describe their business as “Black-owned” with just a few mouse clicks. For example, shows the first two items returned by a search for Black-owned restaurants in Seattle, Washington, on Yelp. It is clear that the first result has the “Black-owned” label. Meanwhile, even when a restaurant does not have the self-identified “Black-owned” label, it will appear in the result when “Black-owned” is mentioned in its customer review. displays such a review that contributes to the identification of a searched Black-owned restaurant on Yelp. Therefore, we used the method of Web scraping (Zhao Citation2017) to collect ownership information of the restaurants from Yelp. To do so, we created Python code that allowed us to search on Yelp with the keyword “Black-owned restaurants” in the specified city and then save the search results. These results included the name and address of the restaurant, whether it has the “Black-owned” label, and the number of customer reviews in which this label is mentioned.
Figure 1 Two Black-owned restaurant listings on Yelp.
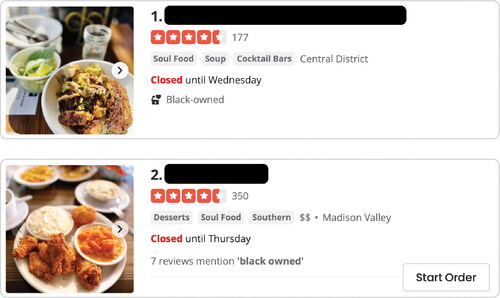
Figure 2 Yelp review that mentions the Black ownership of the restaurant.
Restaurant Visitation from SafeGraph
We acquired restaurant visitation records from SafeGraph, a company that collects visitation patterns of POIs using a Global Positioning System (GPS) panel that contains a total of 45 million mobile devices, which accounts for approximately 10 percent of all mobile devices in the United States (SafeGraph Citation2019). We used the “Weekly Patterns” data set (see https://docs.safegraph.com/docs/weekly-patterns) that provides visitation totals of and visitors’ origins from 4.5 million POIs in the United States on a weekly basis, starting from the year 2018. POIs in SafeGraph are classified according to the North American Industry Classification System (NAICS) code, a standard used by federal statistical agencies to categorize business establishments for the purpose of collecting, analyzing, and publishing statistical data related to business and the economy. Note that SafeGraph only documents the physical visits to a POI that last more than four minutes (SafeGraph Citation2021). We retrieved a total of 830,432 POIs with the code 722, which is the category of Food Services and Drinking Places. These retrieved SafeGraph POIs served as a POI pool, against which Yelp restaurants were later used to match.
Methods
SafeGraph and Yelp Restaurant Matching
We first attempted to assign SafeGraph’s unique identifier (i.e., placekey), to Yelp’s Black-owned restaurants by performing a cross-data-set matching. The matching mechanism is designed from two perspectives: (1) the similarity in restaurants’ names, and (2) the spatial proximity. We presume that a restaurant from the SafeGraph data set is identical (at least with a high chance) to a restaurant from the Yelp data set if these two are close to each other and with similar names. In this study, we used the Great Circle Distance () to quantify spatial proximity and the Levenshtein similarity ratio (
) to quantify name similarity. The
between restaurants
and
is defined by the haversine formula:
(1)
(1)
where
and
denote the coordinates of restaurants a and b, respectively, with
as latitude and
as longitude.
denotes the radius of the Earth in kilometers (set as 6,371 km).
The between restaurants
and
ranges from 0 to 1 and is based on the Levenshtein Distance (
) between restaurants
and
(2)
(2)
where
and
denote the name strings of restaurants
and
respectively.
and
denote the string lengths of
and
respectively. The calculation of
(Levenshtein Citation1966) follows:
(3)
(3)
where
is a string of all but the first character of
is the
th character of string
starting with 0.
In this study, a match between a Yelp restaurant and a SafeGraph restaurant must meet two criteria: (1) and (2)
Both thresholds are empirical settings that have been optimized after several rounds of experiments. In the following sections, “Black-owned restaurants” refers to the matched restaurants according to the process just described; “ownership-unreported restaurants” refers to all the unmatched restaurants.
Creating Shuffles via Resampling
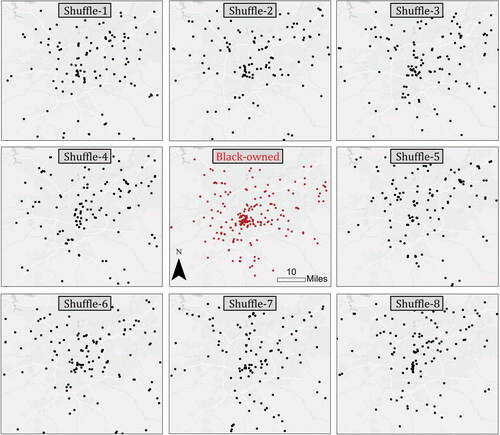
To compare the pandemic’s impact on the visitation of Black-owned restaurants and those whose ownership was unreported, we conducted permutative experiments by resampling for ownership-unreported restaurants 100 times. For each city and each resampling procedure, we randomly selected the same number of ownership-unreported and Black-owned restaurants. As we repeated such a sampling procedure 100 times, a total of 100 resampled data sets that consists of randomly selected ownership-unreported restaurants from all cities were derived. The derived resampled ownership-unreported restaurant data set for each resampling round is called a shuffle. The resampling mechanism mitigates the sample size imbalance between Black-owned and ownership-unreported restaurants, allowing us to compare their visitation patterns under the same sample size nationwide as well as within each city. Meanwhile, a large number of resampling rounds (100 times in this study) reduces the uncertainty caused by the randomness in the selection of ownership-unreported restaurants. presents the distribution of Black-owned restaurants and eight shuffles (Shuffles 1–8) of ownership-unreported restaurants in Atlanta, Georgia. Note that the distribution of selected ownership-unreported restaurants in each shuffle varies due to the random selection process. We further compared national-level and city-level visitation patterns of these types of restaurants to reveal any potential disparity in the impact of the pandemic.
Figure 3 Black-owned restaurants and eight shuffles (Shuffles 1–8) of ownership-unreported restaurants in Atlanta.
Annual Visitation Percentage Loss and Kolmogorov–Smirnov Distance
We used percentage changes to quantify the impact of the pandemic on restaurant visitations. Such a measure allows us to cross-compare visitation patterns for restaurants with different orders of magnitude in raw visitation counts. We first summarized the total visits of each restaurant in years 2019 and 2020 and then calculated its annual visitation percentage loss in 2020 compared to 2019 (P):
(4)
(4)
where
and
denote the annual visitation total of the restaurant
in the year 2020 and 2019, respectively.
denotes the annual visitation percentage loss comparing visitation totals in the years 2019 and 2020. To ensure the stability of
we removed restaurants that failed to reach an annual total visitation count of 365 (i.e., at least one daily visitation on average) in 2019.
The calculated restaurants’ annual visitation percentage loss forms two sets: (1) Black-owned set, that is, = {
with
elements; and (2) ownership-unreported set, that is,
= {
with
elements. We further implemented Kolmogorov–Smirnov (KS) distance to investigate whether set
and set
are drawn from the same distribution (two-sample test). The KS distance between sets
and
is calculated as:
(5)
(5)
where
and
denote empirical cumulative density function of set
and set
respectively. In this study, we conducted KS test on sets
and
at both national and city levels. Note that, different from set
set
contains 100 shuffles.
Normalization of Weekly Visitation
In addition to calculating the visitation percentage loss in 2020 compared with 2019, we also explored the dynamics of weekly visitations, aiming to understand when restaurants’ visitation started to drop or recover and by how much. We investigated whether the weekly visitation patterns differed between Black-owned and ownership-unreported restaurants at the national and city levels. For each restaurant, we normalized the weekly visitation in 2020 by its corresponding weekly average visitation counts in 2019. The derived ratio (with the value of 1 as the baseline) allowed us to cross-compare different restaurants and explore how their visitation patterns changed. Like the preceding approach, to ensure a stable time series of normalized weekly visitation, restaurants that failed to reach an annual total visitation count of 365 in 2019 were removed.
Results
Total Visitation Loss in 2020 Compared to 2019
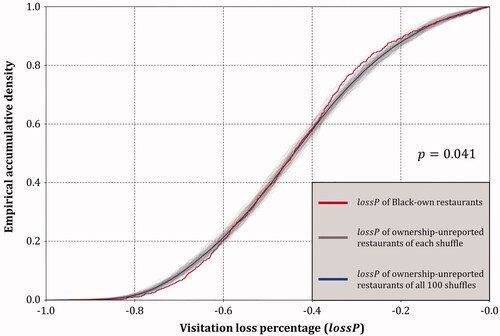
First, we explored the difference in restaurants’ total visits in the year 2020 compared to 2019 for all twenty selected cities. presents the scatterplot of the restaurants’ total visits in 2020 versus those in 2019. It becomes apparent that 92.4 percent of Black-owned restaurants () and 90.4 percent of ownership-unreported restaurants (all 100 shuffles) () experienced a reduction in total visits in 2020 compared to 2019 (i.e., restaurants below the 1:1 reference line), which exemplifies the sweeping impact that the pandemic has had on the catering industry. The empirical cumulative density of visitation loss percentage () of Black-owned and ownership-unreported restaurants of all 100 shuffles yielded a similar trend, as evidenced by their “S” shape that suggests a normal distribution of
The KS test revealed a p value of 0.041 (< 0.05), indicating that there was only a 4.1 percent probability that the null hypothesis (i.e., the distribution of
of Black-owned restaurants and
of ownership-unreported restaurants of all 100 shuffles are identical) was true. Thus, it is reasonable to reject the null hypothesis at the significance level of 0.05. Despite the similarity in
distribution, shown in , the
of Black-owned restaurants (the red line) and
of ownership-unreported restaurants of all 100 shuffles (the blue line) were not statistically identical because they were drawn from different distributions at the significance level of 0.05. This result suggests that out of all the restaurants in all twenty selected cities, the pandemic has led to statistically significant differential impacts on Black-owned restaurants and ownership-unreported restaurants. In addition, the empirical cumulative density of
reveals a lower proportion of Black-owned restaurants with
ranging from −0.8 to −0.6 and a higher proportion of Black-owned restaurants with
ranging from −0.4 to −0.2, compared to ownership-unreported restaurants.
Figure 4 The scatterplot of restaurants’ total visits in 2019 versus those in 2020. (A) Black-owned restaurants; (B) ownership-unreported restaurants (including all 100 shuffles).
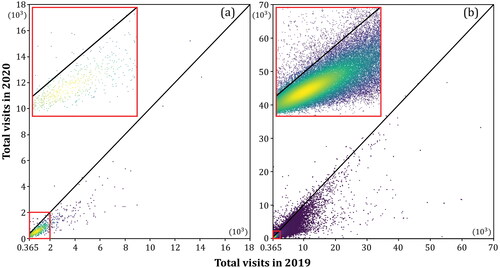
Figure 5 The empirical cumulative density of visitation loss percentage of Black-owned restaurants and ownership-unreported restaurants. The p value denotes the confidence of rejecting the null hypothesis from the two-sample Kolmogorov–Smirnov test. Null hypothesis: The distribution of of Black-owned restaurants and
of ownership-unreported restaurants of all 100 shuffles are identical.
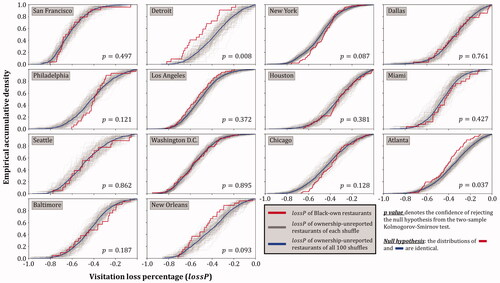
We further explored the city-wide empirical cumulative density of for Black-owned and ownership-unreported restaurants. The six cities with fewer than twenty Black-owned restaurants collected from Yelp (i.e., Charlotte, Denver, Las Vegas, Memphis, Minneapolis, and Phoenix) were removed from this analysis, as a sample size smaller than twenty fails to satisfy statistical robustness. presents the city-wide empirical cumulative density of visitation loss by both Black-owned and ownership-unreported restaurants in the remaining fourteen cities. In general, the empirical cumulative density of
for both types of the restaurants differed at the city level. There were only two cities with p values below 0.05, Detroit and Atlanta, suggesting a great disparity in the impact of the pandemic on Black-owned and ownership-unreported restaurants in these areas. In both cities, Black-owned restaurants were hit harder by the pandemic, as evidenced by their higher visitation loss compared to ownership-unreported restaurants (). New Orleans (p = 0.093) and New York (p = 0.087) also revealed an impact disparity for the two types of restaurants at the significance level of 0.1, however, with contrasting patterns. The Black-owned restaurants in New Orleans had a greater visitation loss compared with ownership-unreported restaurants, whereas the opposite was true in New York. In New York, the empirical cumulative density of Black-owned restaurants’
(red line) was lower than the one of ownership-unreported restaurants’ (blue line) when
was low, suggesting that a higher proportion of ownership-unreported restaurants experienced a more severe decrease in visits. Other cities did not yield statistically significant differences at the significance level of 0.1 ().
Figure 6 The empirical cumulative density of visitation loss percentage of Black-owned restaurants and ownership-unreported restaurants in selected cities.
Time-Series of Normalized Visitation Patterns in 2020
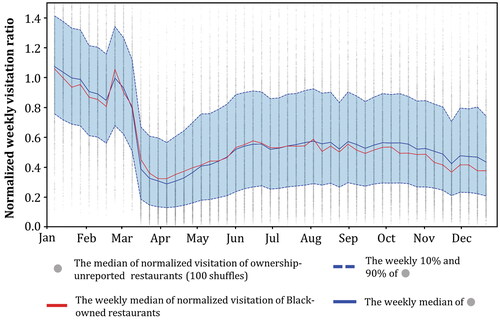
Besides exploring the total visitation changes in 2020 compared to 2019, we also investigated the temporal dynamics of these normalized visitation patterns. shows the weekly normalized visitation patterns for Black-owned restaurants and ownership-unreported restaurants in all selected cities. In general, the impact of the COVID-19 pandemic on restaurant patronage was notable, as weekly visits to both restaurant types experienced a sharp decline in early March and reached the lowest point in mid- and late March when the World Health Organization classified COVID-19 as a pandemic (11 March 2020), the White House declared it a national emergency (13 March 2020), and numerous follow-up state-level mitigation measures brought the restaurant business to a halt. Restaurant visits remained consistently low throughout April, then gained an upward momentum in May, presumably due to the gradual loosening of the safety measures. Even after the reopening, however, restaurant visits remained below the baseline (the value of 1; ). This pattern is largely consistent with the human mobility pattern revealed in numerous mobility data sets (e.g., Kang et al. Citation2020; Huang, Lu, et al. Citation2022). The curve that depicts the weekly median of the normalized visitation patterns of Black-owned restaurants (solid red line) lies above the one that represents the weekly median of normalized visitation of unreported-ownership restaurants (solid blue line) from mid-March to late April (), suggesting that Black-owned restaurants experienced less severe visitation loss during this period of strict mobility-restricting measures. This trend was reversed from September, however, and continued to the end of 2020, when visits to Black-owned restaurants increased, whereas they remained low at ownership-unreported restaurants. Black-owned restaurants began to struggle again in the winter of 2020, however, when COVID-19 cases increased along with mandatory control measures, when compared to ownership-unreported restaurants.
Figure 7 Weekly normalized visitation patterns for Black-owned restaurants and ownership-unreported restaurants based on 100 shuffles for all selected cities.
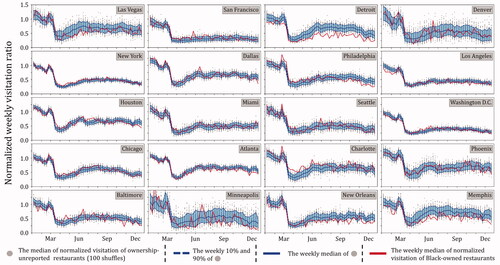
To further explore city-level discrepancies, we derived weekly normalized visitation patterns for Black-owned and ownership-unreported restaurants for each city (). The results suggest that, although the general pattern still held, as shown by the rapid reduction in visits that occurred in March 2020, the impact disparity on Black-owned and ownership-unreported restaurants differed greatly at the city level. In Detroit and New Orleans, Black-owned restaurants suffered a significant decrease in patronage, as their weekly normalized visit patterns (solid red line) considerably deviated from and remained below those of the ownership-unreported restaurants (solid blue line). These observations are consistent with the findings presented earlier, where Black-owned restaurants in Detroit and New Orleans had considerably higher yearly visitation losses (comparing 2020 to 2019) than ownership-unreported restaurants (see ). In Detroit, Black-owned restaurants were greatly affected by the implementation of strict mobility-restricting measures (in March and April) and struggled to recover after the reopening. Memphis is another city with impact disparity that hurt the Black-owned restaurants. In comparison, Charlotte presented a different pattern, as its Black-owned restaurants experienced a notable decrease in the percentage of visits compared to ownership-unreported restaurants in March and April. As for other cities, there were no observable differences between the impact on Black-owned and ownership-unreported restaurants, given that the former’s weekly normalized visit patterns fluctuated within the weekly 10 to 90 percent range of ownership-unreported restaurants’ normalized visit patterns ().
Figure 8 City-level weekly normalized visitation patterns for Black-owned restaurants and ownership-unreported restaurants based on 100 shuffles.
Discussion
In this study, we uncovered the previously hidden, nonunanimous trends in U.S. restaurant patronage throughout 2020 and discovered several key findings related to Black-owned restaurants. The statistical results allowed for a closer examination of the impact of the pandemic on these businesses. The uneven visit patterns also reveal a need for place-based policies from different levels of government to achieve a more equitable and comprehensive economic recovery. Furthermore, by reviewing the trends and the concurrent “Black-owned” labeling campaign, we advocate for a new humanistic approach to establishing deep connections with Black communities.
Black-Owned Restaurant Visitation in the Initial Outbreak of the Pandemic
Although overall the Black-owned restaurants had fewer visits during the study period, we noticed that during the initial months of the pandemic (i.e., mid-March to early July 2020), the visitation to Black-owned restaurants was in fact higher (). Yet such a pattern did not persist. In August, the visitation to Black-owned restaurants started to decrease again, dropping back to a disadvantaged place compared to the ownership-unreported restaurants. The unexpected higher number of visits to Black-owned restaurants during the early pandemic revealed by our study requires appropriate explanations to better understand Black communities’ experiences during the pandemic. One hypothesis could be that customers might become more reliant on dining in the opening Black-owned restaurants because the other consumption approach (e.g., delivery or take-out) were more costly at the initial stage of the pandemic. Another plausible explanation could be that the Black-owned restaurants might not have the financial capability to suspend business or switch to take-out only, as the restaurant owners and employees relied on the business to cover their basic living costs during the turbulent time. At the same time, the existing systematic inequities and the lack of necessary protective measures and vaccines made those who were still working more vulnerable to the virus, which corresponded with the epidemiological findings of the pandemic (Millett et al. Citation2020; Wiley et al. Citation2021). Then, during the reopening stage, the costs of staying open and continuing to offer dine-in services during the first few months, such as the loss of employees due to virus infection and the depletion of financial reserves, made the Black-owned restaurants less competitive than those that had better flexibility in reacting to the pandemic. It is important to note that these are only two possible instead of conclusive explanations of the unexpected phenomenon observed through our quantitative investigation. Further efforts, such as interviews and other field work, should be made to appropriately understand the pattern.
We argue that our quantitative work could serve as a springboard for more detailed research on this timely subject, especially when, as noted by Neise, Verfürth, and Franz (Citation2021), such research remains scarce today. Although previous studies have illustrated the importance of taking proactive measures, such as enacting plans creating a “rainy day fund” for times of crisis, to increase economic resilience (Rose Citation2004; Madeira, Palrão, and Mendes Citation2020; Ntounis et al. Citation2022), systematic racism against Black populations might prevent them from adopting the same preventive measures as their White counterparts. Therefore, although it is evident that many Black restaurants have struggled to survive, governments should also take necessary measures to protect these businesses, as the Black communities, who have been repressed by long-standing discrimination, are now being disproportionally harmed by the COVID-19 pandemic.
Place-Based Relief Strategies
The myriad impacts of the pandemic on restaurant patronage indicate the necessity for place-based relief strategies to foster economic recovery. At the national level, the federal government has acted to alleviate the financial burden caused by the pandemic through the Coronavirus Aid, Relief, and Economic Security (CARES) Act by the Trump administration and the American Rescue Plan (ARP) by the Biden administration. Federal assistance primarily provides urgently needed financial loans and waivers to business owners so they can maintain operation. Business owners must apply directly, however, and might not be aware of such financial aid opportunities, which could prevent them from receiving essential funding. Our analysis presents the varying extent of customer decline on much finer spatial and temporal scales, which could assist all levels of government in providing more targeted and effective help for restaurant owners. Our cross-comparison among the twenty cities highlights the differences in geographic locations, as shown in and . For instance, as we mentioned in our results, there was a contrast between New Orleans and New York in the visitation losses for the two types of restaurants (see ). The various dynamics in the selected cities revealed by our study could inform the local governments of the necessity to evaluate the situations for their cities individually. Moreover, as SafeGraph conducted the visitation enumeration at the individual restaurant level, distinctions among restaurants have been revealed. Such a method could be used by city governments to make more specific and direct actions to allocate the limited but urgently needed resources. For instance, as shown in the research results, in Detroit, there has been a substantial gap between the visits to Black-owned and ownership-unreported restaurants (see ), especially when compared to the national-level pattern. Thus, policymakers in this city should consider additional help for Black-owned restaurants to resolve the gap and help achieve a more equitable economic recovery. In New Orleans, there is a significant difference between the top 10 percent of the most visited restaurants and the bottom 10 percent of least visited restaurants, shown by the dotted blue lines in . It indicates that certain restaurants are favored much more than others. Yet such a gap is much less apparent in Washington, DC. Therefore, city administrators must consider such contrasts in the number of visits among individual restaurants when planning for economic recovery strategies. More work on investigating the explanations of such spatial variations at different cities would also be necessary for future planning, as our work mainly contributed to revealing the heterogeneities. Although more nuanced analysis could be done from our results, in general, our study highlighting the variations in different cities and even in different individual restaurants shows the need for individualized plans and policies for local economic recovery.
Help or Hype? A Critical Reflection on Being Ally to Black Community
Another issue that emerged from our results was the effectiveness of the current support provided to Black communities. As previously mentioned, amid the social context of protests and the BLM movement after the murder of George Floyd in 2020, tech giants added the “Black-owned” label to their online platforms, with the claim that such a feature will inform potential clientele and help them support Black-owned businesses. Based on our research results, in many of the cities, the visitations to Black-owned restaurants peaked locally around June and July (see ), when Yelp added the new feature. They began to decrease after the summer, however, ending with an even larger gap than was seen in January 2020. The increasing use of the new feature of “Black-owned” labeling was synchronized and associated with the increasing visitations to Black-owned restaurants during the months selected for study. Although we would not push further to argue that the “Black-owned” labeling feature was the cause or the primary driver of the increased visits in those months, we tend to agree that this new feature was very likely effective in promoting Black-owned businesses at least for this short period of time. Nevertheless, it is reasonable and necessary to further evaluate its role in continuously supporting Black-owned businesses.
Undeniably, adding another label to the tech giants’ online platforms might inspire these billion-dollar companies to adhere to their social responsibilities, but it has not been sufficiently beneficial to the Black-owned restaurants or the entire Black community during the pandemic or beyond. On the contrary, it is possible, though less obvious, that racist users could exploit such a label in the public online platform for malicious purposes, further hurting the minority community. For example, after Google introduced the “Black-owned” keyword in their search engine, a Black-owned shop in New York City received more than thirty fake, negative reviews within twenty-four hours (Metaxa Citation2021). Although adding the Black-owned label can be done with only a few mouse clicks, no warning is provided about the potential negative consequences to Black business owners. In fact, some Black business owners have expressed their concerns over the possible negative effects of such a label on their sales (Russell Citation2021).
Because appending the race or ethnicity label to the locational information of a restaurant is a typical GIS operation, GIScientists either in the big tech companies or from academia should undertake GIS development very cautiously to avoid any unintended, uncomfortable, or even malicious consequences of the “Black-owned” labels. To achieve this goal, we argue that a humanistic GIS approach could shed light on a feasible direction (Zhao Citation2022). Echoing the central message of humanistic GIS, we encourage GIS developers to consider the diversity of human experience, especially in Black communities and other minority groups. Such consideration of human experiences could be embodied throughout the implementation process of any GIS technology, which, in our case, is the racialization of locational information on Yelp. For instance, prior to the deployment of the “Black-owned” feature, interviews with the direct stakeholder—Black restaurant owners—should be the preparatory work for learning about their opinions on such a proposed feature. Then, when the feature is deployed, the Black restaurant owners should be reminded of the potential controversial consequences of adding the “Black-owned” label. An intuitive operationalization of this would be presenting such information to users, which, in this case, are the business owners, during the process of adding the label. Meanwhile, maintaining constant online or offline communications with the Black restaurant owners over the long term is also necessary, as this will contribute to a more comprehensive understanding of their lived experiences mediated by the online “Black-owned” feature. It will also help identify the unexpected issues with the GIS practice and thereby make corresponding adjustments to ensure that our assistance will not become futile or even a disservice to the minority community. Such a humanistic GIS strategy for mediating and improving the experiences of the users could promote a more authentic and sincere allyship between corporates, such as Yelp, and minority populations. As a result, the refined way of designing and utilizing the “Black-owned” labeling feature could offer more inclusive and long-lasting support to Black communities.
Concluding Remarks and Future Directions
In this article, we innovatively combined the restaurant ownership information from the business review platform and POI visitation obtained from mobile phones to create the data set for our longitudinal analysis of restaurant patronage in the United States. By performing the KS test on the distributions of the annual visitation losses of Black-owned and ownership-unreported restaurants, we confirmed that in our twenty selected U.S. cities, Black-owned restaurants were generally more severely affected by the pandemic in 2020 in terms of visitation losses. Our statistical analysis also revealed the changing trends of restaurant visitation changes over space and time. The cross-comparison among the cities shows that the decline in visits to Black-owned restaurants was not geographically homogenous.
As an empirical study, our work enriches the data on how the COVID-19 pandemic has disproportionately influenced socially disadvantaged populations. We acknowledge that the potential drivers discussed in this study were derived from the patterns revealed by our POI-based data-driven analytical framework, without the support of statistical evidence or inferences. More efforts are needed to involve business owners through surveys or focus groups designed to reveal the hidden drivers that can help explain the disparity of the visitation impacts observed in this study. Our findings have produced implications in different aspects. First, the comparison of visitation changes between Black-owned and ownership-unreported restaurants over time indicates the need for more rigorous research on why the former have been more affected during the pandemic. Second, the visitation differences in the cities examined in this study suggest there is a need for place-based support strategies for Black-owned restaurants. Finally, by reflecting on the practice of the “Black-owned” label, we observe a lack of critical consideration on the allyship with the Black communities. The unsustainable effect in boosting visitation and the possible negative consequences of the “Black-owned” label have made such a type of “support” potentially problematic. As a result, we advocate for a humanistic GIS approach, which emphasizes people’s lived experiences, to form authentic allyship with and provide convincing support for the disadvantaged populations.
We acknowledge several limitations in our data-intensive methodology. First, the SafeGraph POI visitation data set only documents the physical visitations in that such a record is valid only if a digital device is geographically close to a restaurant for more than four minutes. Thus, this data collection mechanism does not record take-out and delivery services. Take-out service usually takes less than four minutes, and restaurant delivery services have become even more popular during the pandemic. Second, we also need to point out that a visitation record cannot always be attributed to the revenue of restaurants, as users might stay nearby a restaurant POI without being a restaurant customer. Additionally, as SafeGraph documents visitation patterns using mobile devices, diners who cannot afford this technology are left out of this data set. Meanwhile, because the Black-owned label on Yelp is either self-identified or implied by the online reviewers, its authenticity is not guaranteed. As of yet, to the best of our knowledge, no public data set is available to verify the authenticity of this label, as on Yelp. Hence, we call for future scholars to build on our research.
Based on the data limitations that we just mentioned, the improvement of data quality and comprehensiveness will provide a stronger basis for data analysis. Also, we focused on the impact of the pandemic on restaurants’ visitation counts, but we hope others will extend our work in various ways. For instance, because SafeGraph documents the origin (at the Census block group level) of each visit, it is feasible to conduct spatial investigations on restaurants’ loss and gain of customers. Expanding the spatial and temporal scale of our study to a national level using information that covers a longer time span would also be meaningful. In addition, interviews with Black restaurant owners and sentiment analysis based on social media content related to Black-owned restaurants would be valuable qualitative efforts to explain the observed quantitative trends in our study and to expand our understanding of the Black communities’ circumstances during the pandemic from different angles. No less important, we advocate that any instantiation of GIS should not be detached from human experiences, and a more humanistic framework could actively engage GIS with the entrenched inequity issues in our society.
Acknowledgments
The authors genuinely appreciate Sarah Elwood, Michael Brown, the editor, and three anonymous reviewers for their thoughtful and constructive feedback. The unprecedented nationwide campaigns for racial justice and civil right in 2020 urged the authors to support the BLM movement with this article. The idea of this article was also intellectually inspired but not directly funded by the Human-Environment and Geographical Sciences (HEGS) program at the National Science Foundation under Grant HEGS-1951072. This funded project was named “Examining Shifting Geographies of Historically Underrepresented Groups.”
The work for the article were financially sponsored by the research fund from the department of Geography at University of Washington, the vice chancellor for research and innovation fund from the University of Arkansas, and from the ASPIRE program in the University of South Carolina under the grant No.1354 00-20-53382.
Additional information
Notes on contributors
Xiao Huang
XIAO HUANG is an Assistant Professor in the Department of Geosciences, University of Arkansas, Fayetteville, AR 72701. E-mail: [email protected]. His research areas include geospatial artificial intelligence, human–environment interactions, spatial modeling, deep learning, and disaster mitigation.
Xiaoqi Bao
XIAOQI BAO is an MA Student in the Department of Geography, University of Washington, Seattle, WA 98195. E-mail: [email protected]. His research interests are in geospatial big data, geovisualization, rhythm analysis, and science and technology studies.
Zhenlong Li
ZHENLONG LI is an Associate Professor in the Department of Geography, University of South Carolina, Columbia, SC 29208, where he established and leads the Geoinformation and Big Data Research Lab. E-mail: [email protected]. His primary research field is GIScience with a focus on geospatial big data analytics, high-performance computing, and GeoAI/CyberGIS with applications to disaster management, human dynamics, and public health.
Shaozeng Zhang
SHAOZENG ZHANG is an Assistant Professor in the Program of Anthropology, Oregon State University, Corvallis, OR 97331. E-mail: [email protected]. His research interests include science and technology sudies (STS), digital anthropology, applied anthropology, and environmental anthropology with a focus on minority populations in Brazil and the United States.
Bo Zhao
BO ZHAO is an Associate Professor in the Department of Geography, University of Washington, Seattle, WA 98195. E-mail: [email protected]. His research interests include GIScience, geographical misinformation, and social implications of emerging GIS technologies, especially in the context of the United States and China.
References
- Alcorn, C. 2020. Black-owned companies are shutting down twice as fast as other businesses. CNN.com. Accessed December 1, 2021. https://www.cnn.com/2020/08/04/economy/black-business-coronavirus-study/index.html.
- Bartik, A. W., M. Bertrand, Z. Cullen, E. L. Glaeser, M. Luca, and C. Stanton. 2020. The impact of COVID-19 on small business outcomes and expectations. Proceedings of the National Academy of Sciences of the United States of America 117 (30):17656–66. doi: 10.1073/pnas.2006991117.
- Belitski, M., C. Guenther, A. S. Kritikos, and R. Thurik. 2021. Economic effects of the COVID-19 pandemic on entrepreneurship and small businesses. Small Business Economics 58 (2):1–17. doi: 10.1007/s11187-021-00544-y.
- Brooks, K. J. 2021. Black-owned small businesses hit harder by pandemic than White-owned firms. CBS News. Accessed December 1, 2021. https://www.cbsnews.com/news/black-owned-businesses-revenue-drop-covid-pandemic/.
- Buchanan, L., Q. Bui, and J. K. Patel. 2020. Black Lives Matter may be the largest movement in U.S. history. The New York Times, July 3. https://www.nytimes.com/interactive/2020/07/03/us/george-floyd-protests-crowd-size.html.
- Centers for Disease Control and Prevention. 2021. COVID-19 and your health. Accessed November 22, 2021. https://www.cdc.gov/coronavirus/2019-ncov/your-health/about-covid-19.html.
- Chalfin, A., S. Danagoulian, and M. Deza. 2021. COVID-19 has strengthened the relationship between alcohol consumption and domestic violence. NBER Working Paper No. 28523, National Bureau of Economic Research, Cambridge, MA. doi: 10.3386/w28523.
- Chang, M. C., R. Kahn, Y. A. Li, C. S. Lee, C. O. Buckee, and H. H. Chang. 2021. Variation in human mobility and its impact on the risk of future COVID-19 outbreaks in Taiwan. BMC Public Health 21 (1):226. doi: 10.1186/s12889-021-10260-7.
- Dua, A., D. Mahajan, I. Millan, and S. Stewart. 2020. COVID-19’s effect on minority-owned small businesses in the United States. Accessed November 21, 2021. https://www.mckinsey.com/industries/public-and-social-sector/our-insights/covid-19s-effect-on-minority-owned-small-businesses-in-the-united-states.
- Dube, K., G. Nhamo, and D. Chikodzi. 2021. COVID-19 cripples global restaurant and hospitality industry. Current Issues in Tourism 24 (11):1487–90. doi: 10.1080/13683500.2020.1773416.
- Dyer, O. 2020. Covid-19: Black people and other minorities are hardest hit in US. BMJ (Clinical Research ed.) 369:m1483. doi: 10.1136/bmj.m1483.
- Fairlie, R. 2020. The impact of COVID-19 on small business owners: Evidence from the first 3 months after widespread social-distancing restrictions. Journal of Economics & Management Strategy 29 (4):727–40. doi: 10.1111/jems.12400.
- Francis, M. M., and L. Wright-Rigueur. 2021. Black Lives Matter in historical perspective. Annual Review of Law and Social Science 17 (1):441–58. doi: 10.1146/annurev-lawsocsci-122120-100052.
- Google. 2020. COVID-19 community mobility report. Accessed July 8, 2020. https://www.google.com/covid19/mobility/.
- Gray, D. M., A. Anyane-Yeboa, S. Balzora, R. B. Issaka, and F. P. May. 2020. COVID-19 and the other pandemic: Populations made vulnerable by systemic inequity. Nature Reviews. Gastroenterology & Hepatology 17 (9):1–3. doi: 10.1038/s41575-020-0330-8.
- Huang, X., Z. Li, Y. Jiang, X. Li, and D. Porter. 2020. Twitter reveals human mobility dynamics during the COVID-19 pandemic. PLoS ONE 15 (11):e0241957. doi: 10.1371/journal.pone.0241957.
- Huang, X., J. Lu, S. Gao, S. Wang, Z. Liu, and H. Wei. 2022. Staying at home is a privilege: Evidence from fine-grained mobile phone location data in the United States during the COVID-19 pandemic. Annals of the American Association of Geographers 112 (1):286–305. doi: 10.1080/24694452.2021.1904819.
- Kang, Y., S. Gao, Y. Liang, M. Li, J. Rao, and J. Kruse. 2020. Multiscale dynamic human mobility flow dataset in the U.S. during the COVID-19 epidemic. Scientific Data 7 (1):390. doi: 10.1038/s41597-020-00734-5.
- Kupfer, J. A., Z. Li, H. Ning, and X. Huang. 2021. Using mobile device data to track the effects of the COVID-19 pandemic on spatiotemporal patterns of national park visitation. Sustainability 13 (16):9366. doi: 10.3390/su13169366.
- Leatherby, L. 2020. Coronavirus is hitting Black business owners hardest. The New York Times, June 18. https://www.nytimes.com/interactive/2020/06/18/us/coronavirus-black-owned-small-business.html.
- Lee, J. G., and M. Kang. 2015. Geospatial big data: Challenges and opportunities. Big Data Research 2 (2):74–81. doi: 10.1016/j.bdr.2015.01.003.
- Levenshtein, V. I. 1966. Binary codes capable of correcting deletions, insertions and reversals. Soviet Physics Doklady 10:707.
- Ley, D., and R. Cybriwsky. 1974. Urban graffiti as territorial markers. Annals of the Association of American Geographers 64 (4):491–505. doi: 10.1111/j.1467-8306.1974.tb00998.x.
- Li, Q., L. Bessell, X. Xiao, C. Fan, X. Gao, and A. Mostafavi. 2021. Disparate patterns of movements and visits to points of interest located in urban hotspots across US metropolitan cities during COVID-19. Royal Society Open Science 8 (1):201209. doi: 10.1098/rsos.201209.
- Madeira, A., T. Palrão, and A. S. Mendes. 2020. The impact of pandemic crisis on the restaurant business. Sustainability 13 (1):40. doi: 10.3390/su13010040.
- McKittrick, K. 2006. Demonic grounds: Black women and the cartographies of struggle. Minneapolis: University of Minnesota Press.
- Metaxa, D. 2021. BLK MKT Vintage, for instance, got over 30 new, clearly fake reviews in 24 hours (e.g., calling them ‘a store that promotes segregation’, saying their items were ‘broken’ and ‘covered in dead cockroaches’). And if you look at the users writing those reviews…. Accessed December 2, 2021. https://twitter.com/d_metaxa/status/1362856745190612992?s=20.
- Millett, G. A., A. T. Jones, D. Benkeser, S. Baral, L. Mercer, C. Beyrer, B. Honermann, E. Lankiewicz, L. Mena, J. S. Crowley, et al. 2020. Assessing differential impacts of COVID-19 on black communities. Annals of Epidemiology 47:37–44. doi: 10.1016/j.annepidem.2020.05.003.
- Mills, C. K., and J. Battisto. 2020. Double jeopardy: Covid-19’s concentrated health and wealth effects in Black communities. New York: Federal Reserve Bank of New York.
- Moore, J. T., J. N. Ricaldi, C. E. Rose, J. Fuld, M. Parise, G. J. Kang, A. K. Driscoll, T. Norris, and N. Wilson. 2020. Disparities in incidence of COVID-19 among underrepresented racial/ethnic groups in counties identified as hotspots during June 5–18, 2020 — 22 states, February–June 2020. Morbidity and Mortality Weekly Report 69 (33):1122–26. doi: 10.15585/mmwr.mm6933e1.
- Neise, T., P. Verfürth, and M. Franz. 2021. Rapid responding to the COVID-19 crisis: Assessing the resilience in the German restaurant and bar industry. International Journal of Hospitality Management 96:102960. doi: 10.1016/j.ijhm.2021.102960.
- Ntounis, N., C. Parker, H. Skinner, C. Steadman, and G. Warnaby. 2022. Tourism and hospitality industry resilience during the Covid-19 pandemic: Evidence from England. Current Issues in Tourism 25 (1):46–59. doi: 10.1080/13683500.2021.1883556.
- Rayome, A. D. 2021. Google can help you find Black-owned businesses. Here’s how. Accessed December 1, 2021. https://www.cnet.com/tech/services-and-software/google-can-help-you-find-black-owned-businesses-heres-how/.
- Reese, A. M. 2019. Black food geographies: Race, self-reliance, and food access in Washington, D.C. Chapel Hill: University of North Carolina Press.
- Rose, A. 2004. Defining and measuring economic resilience to disasters. Disaster Prevention and Management: An international Journal 13 (4):307–14. doi: 10.1108/09653560410556528.
- Russell, J. 2021. El Paso business owners react to Instagram’s new “Black-owned” label. Accessed December 2, 2021. https://www.ktsm.com/local/el-paso-business-owners-react-to-instagrams-new-black-owned-label/.
- SafeGraph. 2019. What about bias in your dataset? Accessed October 17, 2021. https://colab.research.google.com/drive/1u15afRytJMsizySFqA2EPlXSh3KTmNTQ.
- SafeGraph. 2021. Weekly Patterns | SafeGraph Docs. Accessed October 17, 2021. https://docs.safegraph.com/docs/weekly-patterns.
- Shannon, J. 2021. Dollar stores, retailer redlining, and the metropolitan geographies of precarious consumption. Annals of the American Association of Geographers 111 (4):1200–18. doi: 10.1080/24694452.2020.1775544.
- Shaw, S. L., M. H. Tsou, and X. Ye. 2016. Human dynamics in the mobile and big data era. International Journal of Geographical Information Science 30 (9):1687–93. doi: 10.1080/13658816.2016.1164317.
- Uber. 2020. Ordering from Black-owned restaurants. Accessed December 9, 2021. https://help.uber.com/merchants-and-restaurants/article/ordering-from-black-owned-restaurants?nodeId=08c78cbe-068b-4582-b5b2-1913ef53b6b3.
- U.S. Federal Reserve Banks. 2021. Small business credit survey - 2021 Report on firms owned by people of color. Accessed July 19, 2022. https://www.fedsmallbusiness.org/medialibrary/FedSmallBusiness/files/2021/sbcs-report-on-firms-owned-by-people-of-color.
- Wang, J., N. McDonald, A. L. Cochran, L. Oluyede, M. Wolfe, and L. Prunkl. 2021. Health care visits during the COVID-19 pandemic: A spatial and temporal analysis of mobile device data. Health & Place 72:102679. doi: 10.1016/j.healthplace.2021.102679.
- Westerman, A., R. Benk, and D. Greene. 2020. In 2020, protests spread across the globe with a similar message: Black Lives Matter. NPR. https://www.npr.org/2020/12/30/950053607/in-2020-protests-spread-across-the-globe-with-a-similar-message-black-lives-matt.
- Wiley, Z., J. N. Kubes, J. Cobb, J. T. Jacob, N. Franks, L. Plantinga, and J. Lea. 2021. Age, comorbid conditions, and racial disparities in COVID-19 outcomes. Journal of Racial and Ethnic Health Disparities 9 (1):117–23. doi: 10.1007/s40615-020-00934-0.
- Wingfield, A. H., and T. Taylor. 2016. Race, gender, and class in entrepreneurship: Intersectional counterframes and black business owners. Ethnic and Racial Studies 39 (9):1676–96. doi: 10.1080/01419870.2016.1178789.
- World Health Organization. 2021. Advice for the public on COVID-19. World Health Organization. Accessed November 22, 2021. https://www.who.int/emergencies/diseases/novel-coronavirus-2019/advice-for-public.
- Xu, T. 2020. Standing together for justice. Accessed December 9, 2021. https://doordash.news/2020/06/03/standing-together-for-justice/.
- Yelp. 2020. Laying the groundwork for change. Accessed November 14, 2021. https://blog.yelp.com/news/laying-the-groundwork-for-change/.
- Zhang, S., D. Xu, and B. Zhao. 2022. “Small” analysis of big data: An evaluation of the effects of social distancing in the United States. Methodological Innovations:205979912210908. doi: 10.1177/20597991221090856.
- Zhao, B. 2017. Web scraping. In Encyclopedia of Big Data, ed. L. A. Schintler and C. L. McNeely, 1–3. Cham, Switzerland: Springer.
- Zhao, B. 2022. Humanistic GIS: Toward a research agenda. Annals of the American Association of Geographers 112 (6):1576–92. doi: 10.1080/24694452.2021.2004875.