
 ?Mathematical formulae have been encoded as MathML and are displayed in this HTML version using MathJax in order to improve their display. Uncheck the box to turn MathJax off. This feature requires Javascript. Click on a formula to zoom.
Abstract
Retail is an important function at the core of urban areas, occupying a key role in determining their economic prosperity, desirability, and vibrancy. Efforts to understand the geographies of retail centers, the cores of retailing in urban areas, have a long academic tradition, often studied through either rich local case studies, or when geographically more expansive, are constrained by limited detail. New data in United States detailing the location and uses of retail creates a significant opportunity to develop a more complete and comprehensive overview of the national retail system, at a high spatial resolution. This research is rooted in a pragmatic effort to provide the first and most comprehensive model of U.S. retail center geographies, through development of an integrated, conceptual, and empirically grounded framework, using data from SafeGraph, to examine where they are located, what characteristics they have, and who uses them. The resulting geographies are of great interest, creating significant potential in the monitoring of the national retail system as it continues to evolve in response to wider structural challenges. Furthermore, by integrating these three geographies (where, what, and who), we establish a conceptual framework that yields substantive insights about the relationships between each of them, and argues that understandings of U.S. retail center geographies are more comprehensive and useful when considering the who, what, and where together.
零售业是城市核心区域的重要功能, 在决定城市经济繁荣、可用性和活力方面起着关键作用。研究处于城市零售业核心的零售中心地理环境, 有着悠久的学术传统。这些研究通常基于大量的本地案例, 但是在大空间范围下受到缺乏细节的限制。在美国, 零售业位置和用途的详尽数据, 为更完整而全面地了解高空间分辨率的全国零售系统创造了重要机会。基于实用性的思路, 本研究开发了一个综合性的、概念性的和经验性的框架, 利用SafeGraph数据, 首次也是最全面地对美国零售中心的地理环境进行了建模, 探讨了零售中心的位置、属性及其使用者。在全国零售系统为了应对更广泛的结构性挑战而不断演变的背景下, 其地理环境具有重大意义, 为监测全国零售系统创造了巨大的潜力。此外, 通过综合三个地理环境(位置、属性和使用者), 本文的概念性框架可以为这三个地理环境之间关系提供实质性的思考。我们认为, 研究使用者、属性和位置, 能更全面而有效地理解美国零售中心的地理环境。
El comercio minorista es una importante función en la esencia de las áreas urbanas, en cuanto tiene un rol crucial para determinar su prosperidad económica, su atractivo y su vitalidad. Los esfuerzos para entender las geografías de los centros de comercio minorista, los núcleos del menudeo en las áreas urbanas gozan de una larga tradición académica, a menudo estudiada, bien a través de ricos estudios de caso locales, o cuando exhiben mayor amplitud geográfica, aparecen constreñidos por el detalle limitado. Nuevos datos de los Estados Unidos que detallan la localización y los usos del comercio minorista crean una oportunidad notable para desarrollar una visión más completa y comprensiva del sistema de comercio minorista nacional, a alta resolución espacial. Esta investigación está afincada en un esfuerzo pragmático para proveer el primer y más completo modelo de las geografías de los centros comerciales minoristas de los Estados Unidos, mediante el desarrollo de un marco integrado, conceptual y de base empírica, usando datos de SafeGraph, para examinar dónde están ubicados, qué características tienen, y quién los usa. Las geografías resultantes son de gran interés, ya que generan un potencial significativo para monitorear el sistema nacional de comercio minorista a medida que evoluciona en respuesta a retos estructurales de mayor amplitud. Además, integrando estas tres geografías (dónde, qué y quién), establecemos un marco conceptual que genera un conocimiento sustantivo sobre las relaciones entre cada una de ellas y arguye que los entendimientos de las geografías de los centros americanos de comercio al detal son más comprensivos y útiles cuando se consideran conjuntamente el quién, el qué y el dónde.
Key Words:
Palabras clave:
The significance of retail to a nation’s economic development has long been realized. As a vital economic contributor and supplier of employment (Helm, Kim, and Van Riper Citation2020), the retail system often acts as a barometer for wider economic trends (Berman and Evans Citation2013). Furthermore, in the process of urban growth, the expansion of cities is in part related to their function as a consumer hub (Han et al. Citation2019), with the desirability of cities increasing with a greater diversity of consumption amenities and global service (Glaeser, Kolko, and Saiz Citation2001). Retail centers, the “main cores of retail activity in urban areas” (Dolega and Celińska-Janowicz Citation2015, 9), are inextricably linked to the desirability of cities, as the primary sites of consumption within them. As a result, it is no surprise that policymakers increasingly view retail centers as integral to economic prosperity (McCann and Folta Citation2008), despite mounting evidence that their economic value in cities and towns has declined in the past decade (Wrigley et al. Citation2015).
Despite this, research on the nationally extensive and comprehensive geographies of retail centers, in terms of their location, structure, and function, remains scarce (Sevtsuk Citation2014). Such research has a wealth of benefits beyond simply understanding how they occupy space. Understanding the location patterns of retail (the where) provides policymakers and stakeholders with critical supporting information to maximize the economic output of the industry, through better urban economic policy (Larsson and Öner Citation2014). Furthermore, discerning the provision and characteristics of retail centers (the what) has significance in understanding the composition, structure, and “vibrancy” of the retail system (DeLisle Citation2005; Dolega et al. Citation2019), and in the creation of highly livable, mixed-use, and sustainable built environments, with a strong “sense of place” (Baker and Wood Citation2010; Sevtsuk Citation2014). When integrated with an understanding of who is using retail centers and where they come from, these geographical understandings can facilitate better evidence-led decisions about retail location, and the subsequent development of policy. Thus far, such insights into the geographies of U.S. retail centers have been relatively inconsistent (Baker and Wood Citation2010), despite a common recognition that these localities and the social constructs they engender are vital.
In developing such understandings, coverage, and replicability are key. Up-to-date and expansive knowledge of the structure of retail provides tools to monitor the evolution of retailing (Joseph and Kuby Citation2016), and therefore insights about different retail spaces and time periods (Guy Citation1998). For example, reconstructing definitions and typologies can contribute substantive insights into the response of retail centers to challenges, such as the so-called retail apocalypse (Helm, Kim, and Van Riper Citation2020). Combined with the unfolding long-term impacts of the COVID-19 pandemic, policy action is critical to protect the “brick-and-mortar” component of the U.S. retail system (Torres-Baron Citation2018). For such policy to be feasible, however, there needs to be a comprehensive understanding of retail center geographies at the national level, which make it possible to both identify where policy is required and assess the effectiveness of such actions (Lloyd and Cheshire Citation2017).
Literature on the geographies of retail centers is well established within the retail geography and urban studies communities, although often only considering a singular aspect of their geographies; for example, where they are located, what characteristics they have, and who uses them. Regarding where, recent examples have typically focused on development of analytical frameworks for delineation of the scale and extent (boundaries) of retail (center) centers (e.g., Pavlis, Dolega, and Singleton Citation2018; Nong et al. Citation2019; Ballantyne et al. Citation2022). In examining what characteristics they have, articles have placed an emphasis on trying to the understand the position of centers in the wider retail system, through development of typologies and classifications (e.g., Brown Citation1992). There is a substantial legacy of academic enquiry seeking to understand patronage to stores, using empirical models to identify who uses them (e.g., Huff Citation1964; Wilson Citation1969; Fotheringham Citation1983). Although understandings for retail centers are limited, the delineation of retail center catchments has recently become more feasible (Dolega, Pavlis, and Singleton Citation2016).
Despite a wealth of literature considering these three retail center geographies in isolation, there has thus far generally been no consensus on how best to bring them together to provide a comprehensive overview of a national retail system (DeLisle Citation2005). A key constraint is often the availability of data for the national extent; however, within the United States, new data are enabling such a vision to be realized, as demonstrated in the analytical framework proposed by Ballantyne et al. (Citation2022). In their article, the authors constructed a framework for extracting information about U.S. retail centers; the scale, extent, and characteristics of those in the Chicago Metropolitan Area. In this research, we extend their framework, with the aim of providing the first expansive, comprehensive, and fully integrated study and conceptual framework of the geographies of U.S. retail centers. In doing so, we make key technical contributions such as demonstrating the utility of nonhierarchical retail classifications, and the continued relevance of the Huff model, as well as significant substantive contributions when integrating the three geographies of U.S. retail centers, by demonstrating the connections between them.
Thus, our article has three key objectives: understanding the who, what, and where of U.S. retail centers. Following a review of existing literature on retail center geographies, we introduce the data sets used in this investigation. We then outline the approaches used and resulting geographies of the retail centers (the where), their characteristics (the what), and catchments (the who). In the final section, we discuss the implications of this study, emphasizing the value of integration; understandings of the who, what, and where are strengthened when examined together.
Background
The Definitions and Origins of the Retail Center
The clustering or agglomeration of retail outlets in geographical space has been defined in various ways. A common definition used in the (U.S.) retail geography literature is shopping center or hub (Clapp, Ross, and Zhou Citation2019; Rao Citation2020). Such definitions, however, often only incorporate purpose-built retail developments, excluding unplanned clusters in decentralized locations, as well as other complementary functions (Guy Citation1998). The term retail center arguably has greater saliency, in its consideration of all retail, its complementary functions (e.g., leisure), and an array of forms and functions. The significance of this definition was first recognized by the U.S. Census Bureau in 1966 (see Casparis Citation1969), but definitions have since evolved, owing to advances in greater computational capacity and data availability (e.g., Pavlis, Dolega, and Singleton Citation2018).
A clear and conceptual definition was proposed by Dolega and Celińska-Janowicz (Citation2015), “the main retail cores in urban areas,” and although definitions between studies differ, there is one term that connects them all: agglomeration. Referring to a mass or collection of things, agglomeration remains one of, if not the key concept in understanding the locational behavior of retail activities (Brown Citation1992; Sadahiro Citation2001). Retail agglomerations occur because there are inherent benefits for retailers when locating in close geographical space (Zhou and Clapp Citation2015), such as increased access to an existing stream of consumers (Teller and Reutterer Citation2008), and significant cost advantages (Vom Hofe and Bhatta Citation2007). Thus, it is unsurprising that retail agglomerations are described as one of the most ubiquitous features of the commercial environment (Brown Citation1992).
Retail center studies are also inextricably linked to central place theory (CPT), which posits that distinctive hierarchical structures are in place between agglomerations, determined by the demand for which goods are purchased (Brown Citation1992; Parr Citation2017). Many nonhierarchical and irregular retail structures are emerging, however, (Dolega et al. Citation2019), and some previous assumptions about consumer behavior, made by CPT, are now considered less relevant (Brown Citation1992). These theoretical considerations are important though, when demonstrating the need for posthierarchical understandings and awareness of the inapplicability of the spatial component of CPT (Borchert Citation1998), crucial when undertaking analysis of where retail centers are located.
Where? A Short History of Retail Center Delineation
Responses seeking to determine where retail centers are, and the extent of geographical space that they occupy, can be traced back as far as 1928 (Woodbury Citation1928). Traditionally, delineations of retail center space were based on field observation or mapping of features (Woodbury Citation1928; B. J. Berry Citation1963; Clark Citation1967). Owing to advancements in the availability of expansive spatiotemporal data sets and analytical capabilities (Nong et al. Citation2019), however, contemporary examples have been able to take a more data-driven perspective, utilizing data aggregated to grid cells (F. Wang et al. Citation2014; Han et al. Citation2019) or the individual store locations themselves (Porta et al. Citation2009; Han et al. Citation2019) to explore the location distribution patterns of retail centers. Both Pavlis, Dolega, and Singleton (Citation2018) and Ballantyne et al. (Citation2022) used spatial clustering of store locations to delineate robust retail center boundaries for the United Kingdom and Chicago Metropolitan Area. There were some notable limitations in both approaches, however, relating to the underlying data and computational capacity of the HDBSCAN algorithm, respectively. In their analytical framework, though, the authors demonstrated the effectiveness of the H3 spatial indexing system in refining center boundaries (Uber Citation2018), which has also been used recently to define retail centers in the United Kingdom (Singleton et al. Citation2021). Although it is clear that there is no global consensus on how best to delineate the where of retail centers, it is evident that computational cost and data reliability remain key constraints. If full replicability and coverage are to be achieved, the approach needs to be scalable and repeatable, something that an approach based on H3 can arguably provide.
What? Positioning Retail Centers in the Wider Retail System
Knowing where retail centers are located forms a necessary precursor to understanding what characteristics they have, through the development of typologies or classifications and hierarchies (Guy Citation1998). These studies, which seek to understand different retail formats and the roles they occupy, are abundant historically and in a more contemporary sense, as retail systems are constantly evolving and transforming (Micu Citation2019; Rao Citation2020). Historically, classifications of these spaces were predominantly concerned with hierarchies and emphasizing the role of size in overall function (Sadahiro Citation2001). Such approaches have retained saliency to the present day, for example in the shopping center classification of the International Council of Shopping Centers (ICSC Citation2017).
In the past few decades, however, there have been some fundamental shifts in the way that people shop, reflecting the growing role of online channels and changing demands of consumers. As a result, new store formats have emerged (Joseph and Kuby Citation2016) to support the demand for increasingly experiential retail and leisure (Dolega and Lord Citation2020). Thus, for any measure of retail function to have contemporary relevance, it has to reflect such changes, still accounting for a greater multidimensionality of descriptive input measures to effectively differentiate between different functions (Guy Citation1998; Rao Citation2020). Such approaches are becoming increasingly feasible, owing to advancements in the way classification is conceptualized and measured in retail geography (e.g., Brown Citation1992), but also to advancements in analytical capacity and data (Dolega et al. Citation2019), providing significant scope for advanced retail classifications based on sophisticated empirical analysis (DeLisle Citation2005).
Who? Catchment Methodologies for Retail Centers
In understanding the geographies of retail centers, it is also vital to understand the demand: customers who are using them, and where are they are coming from, referred to as the catchment. Catchments can be defined as “the areal extent from which the main patrons of a store or retail centre will be found” (Dolega, Pavlis, and Singleton Citation2016, 1), resulting from the spatial shopping behaviors of consumers, and influenced by a multitude of different factors. There are numerous ways to delineate catchments, but broadly they can be split into two categories. Deterministic methodologies, such as circular/fixed-buffer (T. Berry et al. Citation2016) and drive time or distance polygons (Rudavsky, Pollack, and Mehrotra Citation2009) have some advantages, but rarely capture the complexity of real-world consumer behavior and competition (Dolega, Pavlis, and Singleton Citation2016). On the other hand, probabilistic methodologies include the entropy maximization, competing destination, spatial interaction, and Huff models (Wilson Citation1969; Fotheringham Citation1983; Newing, Clarke, and Clarke Citation2015; Dolega, Pavlis, and Singleton Citation2016). The latter, based originally on the law of retail gravitation (Reilly Citation1929), posited that consumer patronage could be modeled by considering the spatial distribution and attractiveness of locations, and accounting for relative competition between them (Huff Citation1964).
A criticism of probabilistic models, however, is that they denote how retail patronage should occur, and as such do not always reflect more complex reality. Supported by advancements in customer-level data (Dramowicz Citation2005), though, such models have become more sophisticated and flexible (Newing, Clarke, and Clarke Citation2015), calibrated with data on consumer behavior (e.g., loyalty cards) to ensure they generate more accurate representations. These calibration data sets are typically used to estimate where consumers come from (Waddington et al. Citation2018), enabling delineation of an approximate catchment (Davies, Dolega, and Arribas-Bel Citation2019). Despite these advancements, robust empirical catchment delineations for retail centers are sparse in the related literature (Pratt et al. Citation2014), likely relating to the additional considerations needed (Dolega, Pavlis, and Singleton Citation2016). This presents a unique opportunity in the United States given the availability of highly accurate spatiotemporal consumer data (SafeGraph, Inc. Citation2020b), and advancements in parameter estimation methodologies (Y. Wang et al. Citation2016; Liang et al. Citation2020).
Integrating the Who, What, and Where
Although there is a plethora of literature about these geographies in isolation, the relationships between all three in the wider retail system have received limited conceptualization, despite well-known connections between them. For instance, it is well understood that retail centers of differing scales exhibit significant differences in function, as historically modeled by CPT, and used as a prerequisite to most hierarchical classifications of consumption spaces (e.g., B. J. Berry Citation1963; ICSC Citation2017). Despite numerous studies using the outputs of the where—retail center boundaries—as inputs to generate the what—retail classifications—(Pavlis, Dolega, and Singleton Citation2018; Ballantyne et al. Citation2022), through development of analytical frameworks, no direct theoretical consideration has been given to the connections between them.
Such connections are also apparent between the what (retail classifications) and the who (retail catchments). The relative supply of goods and services is one of the key determinants of retail patronage; centers deemed to provide a multipurpose or comparison-shopping experience typically draw consumers from a wider area than perhaps smaller town and district centers serving local communities (Guy Citation1998; Dolega, Pavlis, and Singleton Citation2016). Finally, there are also notable connections between the who and the where; the spatial location or distribution of retail centers determines the extent to which they compete with each other, which is also in part related to the function and hierarchical position of the retail center(s)—the what. Thus, it has been common to account for both function and scale when constructing catchments for a national system of retail centers; for example, by applying arbitrary values based on size and type of shopping center (ICSC Citation2017), or by deploying Huff models for convenience and comparison centers separately (Dolega, Pavlis, and Singleton Citation2016).
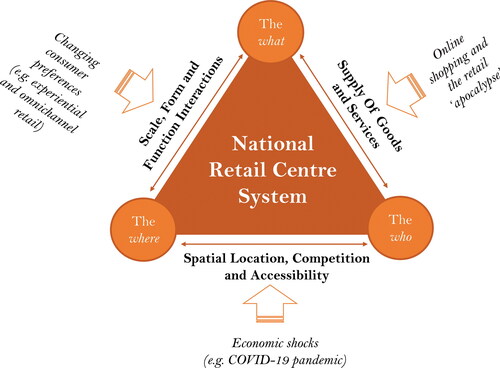
Thus, it is clear that these three retail center geographies (the who, what, and where) are intrinsically linked to each other, as presented within our conceptual framework (), and can be better understood through integration, to provide a comprehensive overview of a national retail center system. conceptualizes the interactions between each of the three retail center geographies, as discussed earlier; for example, the relationship between scale and function, and the importance of function to modeling patronage, all of which are explored in the remaining sections of the article. also highlights the pertinence of external pressures (e.g., online shopping), which occupy a significant role in the operation of a national retail system, and are thus closely linked to the three geographies. It is our view that better integrating the who, what, and where provides a more comprehensive overview of U.S. retail center geographies, and can thus improve our ability to better understand and effectively respond to external pressures on the retail system.
Figure 1 Conceptual framework of integrating the who, what, and where.
Data
The primary database used in this research—“places”—was obtained from SafeGraph, a U.S. company that provides point of interest (POI) and mobility data for the United States, Canada, and the United Kingdom. This database contained information on places where people spend money, time, or both, made up of three primary data sets. The first data set, core places (SafeGraph, Inc. Citation2020b), contained attribute information, such as the name, address, category, and coordinates. The geometry data set (SafeGraph, Inc., 2020a) contained detailed building footprints for each place, accounting for relationships between individual places and shared buildings. The final data set, patterns (SafeGraph, Inc., 2020c), contained traffic and demographic aggregations for the places, providing detailed information on how often people visit, how long they stay, and how far they travel. The SafeGraph places database was used as it is openly accessible, offers comprehensive coverage for the national extent of the United States, and as argued by Ballantyne et al. (Citation2022), is the best available source of data on retail location for the United States in terms of accuracy and comprehensibility. Thus, it is no surprise that a large body of pioneering research has utilized the SafeGraph places database to understand geographical phenomena (Liang et al. Citation2020; J. Wang et al. Citation2021; Yabe, Rao, and Ukkusuri Citation2021; Zhai et al. Citation2021; Huang et al. Citation2022).
For this study, the places that related to retail were extracted, as in the analytical framework first proposed by Ballantyne et al. (Citation2022), resulting in a data set of 3,476,542 retail places, a list from which we were able to extract, for the national extent of the United States, base information (core places), building footprints (geometry), and corresponding mobility data (patterns). With the latter, the more recent SafeGraph weekly patterns data set was used, which is available and updated weekly. A summary of how the three data sets (core places, geometry, and weekly patterns) were used in each component of this article can be seen in . Additional ancillary data sets included the use of retail land-use polygons from OpenStreetMap to capture the extent of larger retail developments (e.g., parking lots), and spatial data on waterbodies from the U.S. Geological Survey to account for the presence of major rivers in boundary delineation. In addition, data from the Environmental Protection Agency (EPA Citation2021) and the U.S. Census Bureau (Citation2021) were used to derive useful information about the surrounding urban morphology (e.g., road density) and neighborhood income of retail centers, respectively, when constructing our typology.
Table 1. Data set usage within each of the three components
The Where of U.S. Retail Center Geographies
Delineating the Scale and Extent of U.S. Retail Centers
The approach used to delineate retail centers used the H3 spatial indexing system, which as discussed earlier, holds significant potential for an accurate delineation that is both interoperable and computationally inexpensive. The approach, adapted from that used by Singleton et al. (Citation2021) and outlined in , takes as input the 3,476,543 retail places introduced earlier, their longitude/latitude coordinates from the core places data set, their building footprints from the geometry data set, and retail land-use polygons from OpenStreetMap (). These input data sets were then aggregated to a grid of H3 addresses that contained retail features (); the chosen H3 resolution that the features were aggregated to was eleven, pertaining to hexagons with a diameter of 50 m, the optimal resolution for exploring connectivity between different retail places (Ballantyne et al. Citation2022).
Figure 2 Approach to retail center delineation.
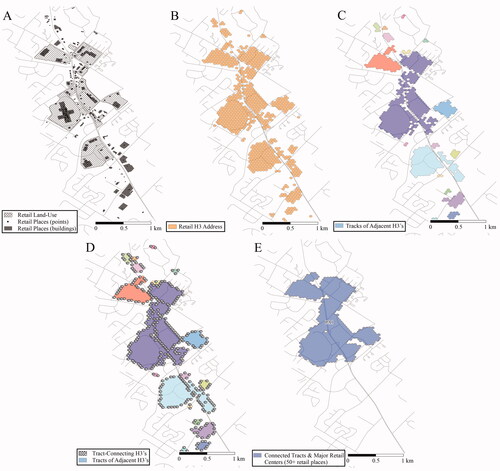
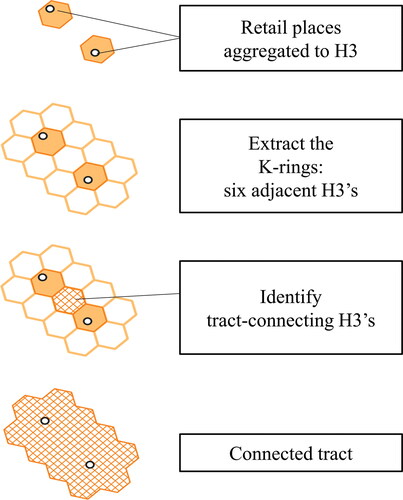
Once the various input data sets had been aggregated to H3, the retail center boundaries were delineated, beginning by assembling a series of contiguous tracts of hexagons based on direct adjacencies (), with only directly-neighboring hexagons in the same tract. Following this, a search was then performed to see if any of these initial tracts were near to others—within 50 meters—by extracting a series of tract-connecting hexagons (); H3 addresses in the respective neighboring “K-rings” of two hexagons, in and between different tracts. A detailed visualization of what a K-ring is and how this operation worked can be seen in . These tract-connecting H3’s () were then used to merge nearby tracts built on adjacencies, resulting in a set of connected tracts (). Additional components included the use of the National Hydrography Dataset to restrict merging of tracts across major rivers, a particularly pertinent issue in cities like Providence and Chicago. Roads and railway lines held similar potential, but were excluded due to a lack of detailed spatial data detailing the existence of overpasses and underground railway lines, which have a limited impact on boundaries. Computationally, the approach used h3jsr, an R package for performing spatial operations within H3, and the delineation of centers occurred at the state level to improve performance. Only major retail centers were extracted—those with more than fifty retail places—to remove the large numbers of small centers, which distort the retail center typology (Ballantyne et al. Citation2022), and reduce the computational efficiency of catchment extraction.
Figure 3 Use of K-rings to identify tract-connecting H3’s and build connected tracts.
Where Are U.S. Retail Centers?
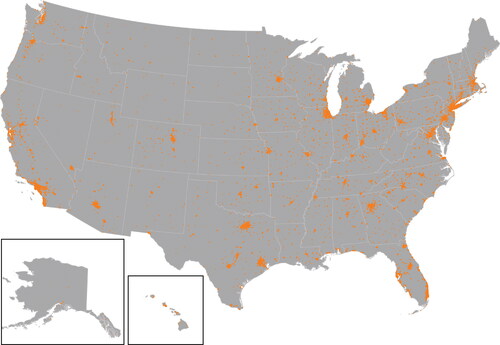
The distribution of U.S. retail centers can be seen in , comprising a total of 10,956 (major) retail centers. The majority were found almost exclusively in urbanized and heavily populated areas of country: 98 percent were within an official Metropolitan Statistical Area (MSA), with the most populated MSAs containing the greatest numbers of centers (e.g., Los Angeles). The centers varied greatly in size, with the smallest containing fifty retail places, and the largest (Manhattan, New York) containing 27,907 retail places, with the median number being 85. These differences contribute to interesting debates about the continued role of scale in retail center geographies, something we explore later. There were also interesting regional differences in the size and total number of centers; for example, despite containing the largest center (Manhattan, New York), the Northeast region comprised the smallest number of centers, with the greatest number of centers found in the South, which is realistic considering 40 percent of the population live there (U.S. Census Bureau Citation2021). It is important to note, however, that by excluding the smaller retail centers, this distribution is heavily skewed toward the most urbanized retail centers, as in Pavlis, Dolega, and Singleton (Citation2018). By excluding these centers, it is likely that we are not capturing their geographies in rural areas of the United States, a limitation we could not avoid.
Figure 4 Distribution of U.S. retail centers (map not to scale).
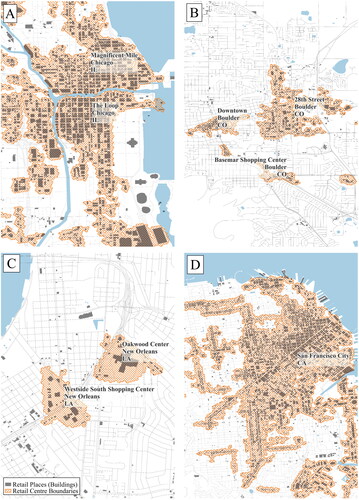
The distributions of retail centers for some contrasting urban and retail environments are shown in , where a broad range of forms are apparent including large, sprawling centers, such as those in Chicago and San Francisco (), and highly linear ones such as Downtown Boulder (). The existence of these different forms has long been recognized, with B. J. Berry (Citation1963) distinguishing them as “ribbons” and “centers” in Chicago, whereas in the United Kingdom, Pavlis, Dolega, and Singleton (Citation2018) likened them to “chain” and “compact” centers. The large sprawling retail centers () occurred in many other U.S. cities such as Seattle and Washington, similar to those seen in UK cities like Liverpool or Manchester (Pavlis, Dolega, and Singleton Citation2018), and similarly, the linear centers () are not all that different from UK high streets. At this point, it is worth noting that a number of methodological advancements enabled accurate delineation of the retail center boundaries. The use of building footprints over point data and water bodies has arguably better captured the spatial distribution of retail, without privileging its relationship to streets or major rivers. In addition, the use of land-use polygons enabled delineation of major retail developments and shopping centers typically enclosed by large parking lots, as in .
Figure 5 The where of U.S. retail centers in four contrasting urban and retail environments (maps not to scale).
The What of U.S. Retail Center Geographies
Developing a Multidimensional U.S. Retail Center Typology
To account for functional differences between the retail centers, a multidimensional retail center typology was constructed. A series of variables () were extracted for each of the four retail classification domains—composition, diversity, size and function, and economic health—as in the analytical framework first proposed by Dolega et al. (Citation2019). The variables were mostly derived from the core places data set, with others from either the SafeGraph weekly patterns data set, or other ancillary data sources (EPA Citation2021; U.S. Census Bureau Citation2021). We extended the framework, however, to ensure greater applicability to the United States, through capturing of a greater number and variety of measures, specific to the U.S. retail context, a problem identified by Ballantyne et al. (Citation2022). The final list of variables and their descriptive statistics can be seen in , and a detailed overview of how they were constructed can be found in the accompanying Supplemental Materials.
Table 2. Variables used in construction of the retail center typology
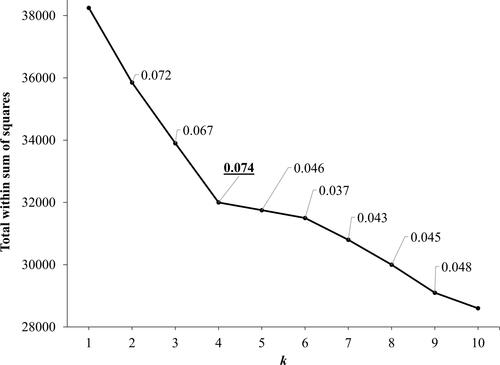
To ensure that the input variables were parsimonious, correlation and sensitivity analysis were used to remove highly colinear variables, and those with little effect on the classification shape. Seven variables exhibited high collinearity and were removed, a key step when assembling classifications with unsupervised machine-learning techniques (Singleton, Alexiou, and Savani Citation2020). Principal component analysis (PCA) was then used to identify those variables making limited contributions to the classification, which resulted in the removal of a further three variables. The final set of thirty-seven variables were range standardized (0–1), and the classification was performed using the partitioning around medoids (PAM) algorithm. PAM requires specification of the number of clusters (k); here we used elbow plots in conjunction with average silhouette scores to determine k in each iteration of PAM, which can be seen for the groups in . The classification was performed twice to extract a two-tier classification, comprising a set of four retail center groups and a series of nested types.
Figure 6 Determining the optimal k value for retail center groups. Value in bold represents optimal k value.
What Are the Characteristics of U.S. Retail Centers?
The characteristics of the retail centers, seen in and , were determined by considering variability in the median values of input variables between each retail center group and type. The spatial distribution of groups () was interesting; the abundance and uneven distribution of Groups 2 (Small city, town, and primary neighborhood) and 4 (“Everyday” convenience and service) was particularly noticeable, forming clusters in and around smaller cities and other urban areas. In contrast, there were distinct concentrations of Group 1 centers (Major urban centers and established shopping destinations) in the major cities such as Los Angeles and New York, with other isolated occurrences in smaller, state capital cities. The number of centers in each group varied substantially from 4,929 (Group 4) to 1,316 centers (Group 3, Leading comparison destinations). This difference does, however, seem plausible given the frequency at which everyday goods (e.g., groceries) are purchased, when compared to other types of retail goods (e.g., home furnishings). Furthermore, when considering the total number of major cities versus smaller cities and towns in the United States, the greater number of centers in Group 2 compared with Group 1 also seems plausible.
Figure 7 Pen portraits for the retail center groups.
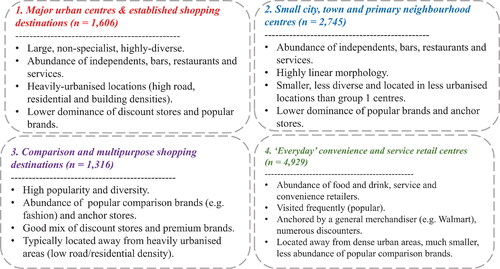
Figure 8 Distribution of U.S. retail center groups (map not to scale).
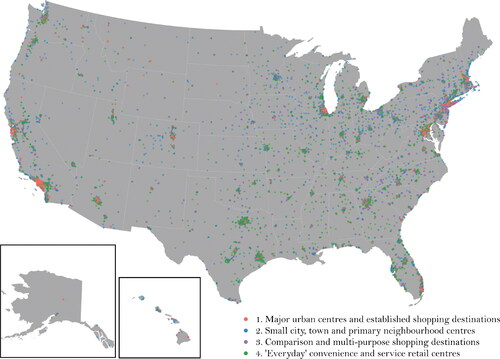
Table 3. Characteristics of the U.S. retail center types
In terms of composition and function (), interesting differences were apparent between the groups. For instance, both the first and second group of centers comprised a retail offering typical of urban centers (e.g., abundance of bars, restaurants). They were differentiated, however, by size, diversity and urban morphology, resulting in a clear distinction between major city centers (e.g., Chicago, Illinois) and smaller urban centers (e.g., Aurora, Illinois). Furthermore, the distinction between Groups 3 and 4 was of great interest; despite polarized retail offerings, discount and anchor (general merchandise) retailers occupied a key role in both. When examining the nested types (), many interesting functional and compositional differences were also identified. The existence of some of these types within the groups was logical, for instance the splitting of premium outlets and leading fashion destinations (3.2) from off-price, nonspecialist comparison destinations (3.4). Furthermore, the differentiation of primary and secondary metropolitan centers (1.1, 1.2) and the identification of food and drink destinations (1.3). As we concluded earlier, though, it is important to note that the typology presented here likely excludes some additional retail center functions, particularly those exclusive or common in rural areas.
Here we have constructed a multidimensional typology for the United States, which highlights the apparent structural and functional interdependencies between centers. Despite a nonhierarchical approach, we must not overlook the relationship between function and scale, as highlighted in our conceptual framework (). Dividing up the retail center groups into four size categories () yielded interesting insights about the mapping of functions across various scales, and the continued applicability of CPT. For instance, with the smaller and medium-sized retail centers, a greater diversity of functions was evident, particularly an abundance of localized ones, as suggested by Guy (Citation1998). When looking to the large and very largest retail centers, it is apparent that there are fewer centers in these categories with a much lower overall diversity. These centers were typically found in the largest U.S. cities where CPT is arguably of much less contemporary relevance, as polycentricity and existence of large spatial structures creates significant market fragmentation (Dolega, Pavlis, and Singleton Citation2016). Thus, the vast differences in retail center functions and scales across the United States counter efforts to conceptualize the retail system through CPT, as paralleled in the United Kingdom (Dolega, Pavlis, and Singleton Citation2016), but must not be overstated as we have deliberately excluded the smallest centers from our analysis.
Table 4. The observed relationship between U.S. retail center scale and function
The Who of U.S. Retail Center Geographies
Calibrating the Huff Model to Estimate Retail Center Catchments
Unpacking who uses retail (centers) and where they come from is a long-standing theme in retail geography. It is vital for better understanding the interplay of supply and demand, in particular, comprehending the main drivers of demand and access (Waddington et al. Citation2018). In this application, we modified the approach of Dolega, Pavlis, and Singleton (Citation2016), where a bespoke Huff model was developed to delineate catchments for retail centers in the United Kingdom. The Huff model, as outlined earlier and specified in EquationEquation 1(1)
(1) , posits that consumer patronage can be modeled by considering the attractiveness (Aj) and spatial location or distance of retail locations (Dij), with α and β calibration parameters used to ensure the model accurately represents reality.
In this research we apply the Huff model to the United States, calibrating it with SafeGraph’s weekly patterns data set (SafeGraph, Inc. Citation2020c), and accounting for functional differences between retail centers. The data set, as described previously, contains aggregated visit counts for each retail place at the census tract level enabling identification of who uses these places and (approximately) where they come from. Arguably, the weekly patterns data set could be used to directly demarcate catchments, but this is problematic, as catchments remain inherently dependent on the data itself, raising issues of representativeness and universal applicability. On the other hand, the use of the patterns data and recent advances in calibration (e.g., Liang et al. Citation2020) could yield substantive insights about the drivers of patronage in the contemporary retail system (e.g., distance, attractiveness), through direct calibration of the model α and β parameters, demonstrating the (in)applicability of the Huff model.
In this approach, the Huff model was used to provide a probabilistic breakdown of the likelihood consumers from census tract i would visit retail center j, as specified in EquationEquation 1(1)
(1) . To measure the attractiveness of retail centers (Aj), an aggregate score was derived from a series of variables (EquationEquation 1
(1)
(1) ) deemed important for retail center attractiveness (Dolega, Pavlis, and Singleton Citation2016; Gong et al. Citation2021). Euclidean distances (Dij) were calculated between the census tracts and centers, as shortest network distances to all tracts were not computationally feasible.
(1)
(1)
where Pij is the probability that consumers located in census tract i would visit retail center j; Aj is the measure of attractiveness for retail center j, based on size, total visits, diversity of retail offer and presence of popular comparison brands; Dij is the shortest Euclidean distance from census tract i to retail center j; α is the attractiveness parameter, determined through comparison with observed patronage; and β is the distance decay parameter, determined through comparison with observed patronage.
The final step in fitting the basic Huff model was to calibrate the model parameters (α, β). In Dolega, Pavlis, and Singleton (Citation2016), the authors determined α and β using related literature and survey observations. In this study, however, we utilized recent advancements in (data-driven) parameter calibration (Y. Wang et al. Citation2016; Liang et al. Citation2020), comparing a series of Huff models to observed patronage behaviors, to empirically derive α and β values. We used the SafeGraph patterns data set to compute observed patronage probabilities, and then compare these to a series of Huff models with different α and β values containing predicted Huff probabilities for each census tract, as shown in . Correlation testing was performed between the observed and predicted probabilities, as in Y. Wang et al. (Citation2016), to identify the calibrated parameters, as shown in . Once determined, these calibrated parameters (α, β) were used to delineate catchments for the retail centers, by extracting predicted probabilities above 50 percent and 25 percent as the primary and secondary catchments, respectively.
Figure 9 Comparing the (A) observed and (B) predicted patronage probabilities for Downtown Boulder (maps not to scale).
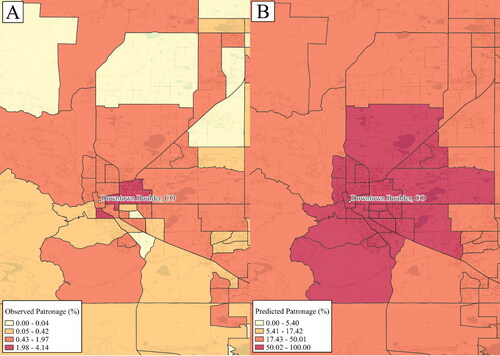
Table 5. Correlation testing of observed probabilities against predicted probabilities from Huff models with different α and β values
As suggested by Dolega, Pavlis, and Singleton (Citation2016), a number of modifications and considerations were made to ensure suitability of this method to retail centers and maximize computational efficiency. The calibration of model parameters was performed for the West region of the United States, to minimize computational cost, with this region selected due to its diverse urban structure, comprising 30 percent of all centers. Second, this method was applied separately for each distinct type of retail center, ensuring only those with directly competing offerings were treated as equal on the catchment surface, as it is problematic to design a hierarchical catchment system (as in Dolega, Pavlis, and Singleton Citation2016), based on a nonhierarchical typology. This also links to the conceptual framework (), where we illustrated that the who and what are intrinsically connected when considering that the supply of goods and services (the what) has a significant role in determining patronage (the who). Thus, a separate constrained Huff model was calibrated and used to extract catchments for centers in each type.
Who Uses U.S. Retail Centers?
The calibrated model parameters varied substantially between the retail center types (), offering useful insights as to the role of attractiveness and distance in determining patronage to U.S. centers with different functions. For example, much larger β values seen for Group 4 centers were interesting, with these centers providing an “everyday” retail offering, a retail function highly sensitive to distance (Dennis, Marsland, and Cockett Citation2002). In addition, α and β were equal for the large, popular and multipurpose destinations (3.1). Given this type comprised many of the established U.S. shopping locations, they could be more likely to fit the conceptual basis on which the Huff model is grounded. In general, the attractiveness parameter (α) was of less significance in ensuring that the Huff models accurately represented reality, as in the United Kingdom (Dolega, Pavlis, and Singleton Citation2016), with β often exceeding α. What remains clear, however, is that a one-size-fits-all approach does not work for a national set of retail agglomerations, as in the United Kingdom (Dolega, Pavlis, and Singleton Citation2016). To demonstrate this further, compares the catchment of a retail center that has () and has not () accounted for retail center type. With the former, a catchment that more accurately reflects the observed patronage behaviors was delineated, suggesting the role of function remains much more significant in determining patronage, over scale.
Figure 10 Primary catchment for Downtown Boulder, where the Huff model (A) has and (B) has not accounted for retail center type.
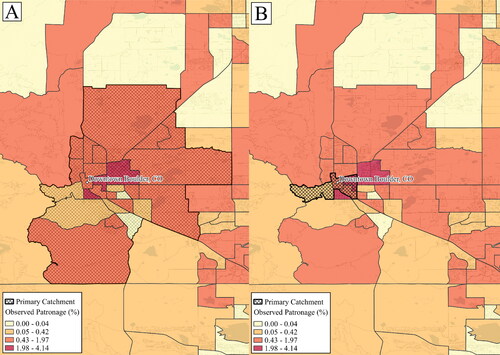
Table 6. Calibrate Huff model parameters for each retail center type.
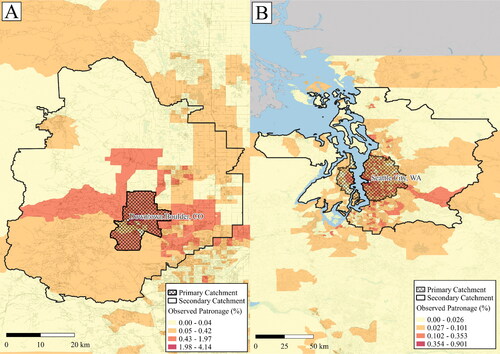
Primary and secondary catchments for Downtown Boulder and the Seattle City retail centers can be seen in . For Seattle, its catchment was very typical of others in Type 1.1, typically very large, owing to a lack of directly competing centers nearby. In some of the more polycentric cities like Los Angeles and Chicago, however, the overall catchment sizes of these centers were much smaller, due to increased competition with other urban centers. Similarly, the Downtown Boulder catchments were large, with the nearest main competitor located in Denver, approximately thirty miles away. It is, however, likely that the Downtown Boulder retail center competes in some way with the nearby large 28th Street retail center (), thus, an approach to catchment modeling at the group level might have handled competition more effectively. On experimentation, though, this failed to demarcate the naturally “higher order” Type 1.1 and 1.2 centers from others in the group, prompting further investigation into how we can better measure the attractiveness of retail centers, and reduce the need for catchment overestimation.
Figure 11 Primary and second catchments for the (A) Downtown Boulder and (B) Seattle City retail centers.
Thus, although we have not been able to fully capture the role of competition in our model, we have instead been able to demonstrate and calibrate a nonhierarchical Huff model that accounts for the function of centers entirely. Given that these catchments are calibrated against a large mobility data set, they arguably provide an accurate way of estimating patronage to retail centers for the national extent, despite overestimation. The underlying observed patronage behaviors highlight this (), where it is evident that the majority of tracts containing relatively high levels of patronage were contained within the catchments of centers. One exception to this was the catchments for Type 3.2 centers, premium outlets and leading fashion destinations, which were the least accurate. Premium outlets, however, typically exhibit patronage behaviors that are distinctly different from all other comparison destinations (Guy Citation1998); thus, it is likely that the Huff model in its current form is not sufficient to account for this difference in function.
An unexpected, yet interesting aspect of the catchments was in their average sizes. Unsurprisingly, some of the traditionally higher order centers like Type 1.1, 1.2, and 3.1 were the largest in area, with the smallest catchments seen for centers providing an “everyday” or convenience-oriented offering (2.2, 4.1, 4.2). These findings have major implications for research like ours, which uses data-driven approaches to understand geographical phenomena. With retail centers there are always implicit hierarchies, but without local, expert knowledge, it becomes difficult to account for and build replicable approaches that integrate such knowledge. In this study, we have made early steps to demonstrate the potential for unpacking the hierarchical from the nonhierarchical, using a Huff model calibrated on a large mobility data set to identify higher and lower order patronage behaviors, demonstrating further the connection between the who and the what.
Discussion and Conclusions
The physical, brick-and-mortar component of the U.S. retail sector is under threat. Retail centers, the primary sites of (physical) consumption (Dolega and Celińska-Janowicz Citation2015), are under increased pressure during the so-called retail apocalypse, and as longer term, structural impacts continue to disrupt the retail landscape—not least given the recent shifts due to the COVID-19 pandemic. This research is rooted in a pragmatic effort to better understand the geographies of U.S. retail centers as a response to these issues, through extension of the analytical frameworks first proposed in Dolega et al. (Citation2019) and Ballantyne et al. (Citation2022), to provide a new conceptual framework that yields substantive insights about the U.S. national retail center system. Using data from SafeGraph and cutting-edge techniques in retail center delineation, classification, and probabilistic modeling, we explore three geographical aspects of U.S. retail centers: where they are located, what characteristics they have, and who uses them. In developing such understandings, though, we argue that these three geographical aspects are intrinsically linked, and as such can be better understood when examined together, through provision of a conceptual framework to ground such understandings.
For instance, we demonstrated the efficacy of including ancillary data sets to derive better retail center boundary delineations, resulting in a higher resolution and more representative retail center typology than was obtained in Ballantyne et al. (Citation2022). Furthermore, we showed that the Huff model can be enhanced to better account for implicit differences in patronage between centers, by integrating information about retail function, supplied by typologies. Finally, throughout this article we highlight apparent connections between scale and function, illustrating that retail center functions can span multiple scales, and that function remains a greater determinant of patronage over scale. Thus, it is our view that empirical inquiries into the geographies of U.S. retail centers need to be better integrated, considering the where, what, and who together, to derive more substantive and useful insights, as opposed to considering them in isolation or duality, as in much of the related literature.
Fundamentally, these apparent links between the spatial distribution, typologies, and catchments of U.S. retail centers contribute heavily to theoretical and conceptual underpinnings in retail geography, particularly in comprehending the role of function and scale in the retail system, and the utility of fit for purpose nonhierarchical classifications, where critical details and niches about retail environments have now been captured. We were also able to evidence the continued applicability of the Huff model in retail (center) geographies, through successful calibration of the model using a large mobility data set from SafeGraph, Inc. (Citation2020c), also shedding significant light on the changing role of function, attractiveness, and distance in conceptualizing patronage.
These conceptual contributions echo many of the findings of other studies in Annals of the American Association of Geographers, notably Scharadin, Ver Ploeg, and Dicken (Citation2022) and Shannon (Citation2016), who investigated the geographies of food environments. Both studies noted the role of food offering and function(s) in determining the patronage behaviors of (retail) food environments, calling for more holistic and multidimensional understandings of them, and highlighting the apparent utility of using observed mobilities to better understand and model these patronage behaviors; enabling definitions of neighborhoods based on individual movements across space and time (Root Citation2012). Thus, although these studies did not explicitly integrate the three geographies of food environments—where, what, and who—they also demonstrated the intrinsic links between them. Our research, however, provides significant scope for future studies into food environment geographies, both in demonstrating the utility of mobility data, to derive catchments or trade areas for a larger number of food environments beyond those based on individual observations (as in Shannon Citation2016), and more broadly, providing a systematic framework through which to measure the national geographies of food environments.
As a resource, these U.S. retail center geographies also offer significant potential in helping to identify how and where effective responses are needed, to protect the physical component of the U.S. retail system, and the social and economic value that they represent (Lloyd and Cheshire Citation2017). Given the role of retail centers in affecting the livability and desirability of cities (Sevtsuk Citation2014), this new knowledge can be used to support development of legislation and the design of cities (Baker and Wood Citation2010). Placing an emphasis on the overall sense of place and the quality of the retail offer can result in significant enhancements to the livability and economic success of these areas (Glaeser, Kolko, and Saiz Citation2001; Sevtsuk Citation2014). Furthermore, given the continued role of the pandemic in our daily lives, increasing volume of online sales and the expanding network of literature on the retail apocalypse, developing metrics for the centers presented here, such as those seen in Singleton et al. (Citation2016) and Comber et al. (Citation2020), could provide an assessment of the pertinence of these issues across the entire U.S. retail system.
These structural challenges are not unique, as they are pertinent in other international settings, which can also benefit from such geographical understandings, and the development of effective, data-driven policy action in response. For such outcomes to be feasible, however, the empirical measurement of retail center geographies has to be replicable (Dolega et al. Citation2019), offering repeatability in existing contexts, and applicability to different ones. Through the development of a fully replicable workflow, utilizing open-source tools and methodologies, and creation of a comprehensive GitHub repository (https://github.com/patrickballantyne/USRetailCentres), the geographies of U.S. retail centers can be updated at regular intervals, enabling insights about their evolution to be gained (Joseph and Kuby Citation2016). Furthermore, in conjunction with the increased availability of globally available retail location data (Safegraph, Inc. Citation2021), and a new conceptual framework providing a comprehensive overview of the national retail (center) system (), the workflow presented here can be modified and extended to derive impactful understandings of retail center geographies in other international settings, as suggested by Ballantyne et al. (Citation2022).
With this research, we do not claim to provide the definitive set of U.S. retail center geographies, as our study is inherently limited by a lack of engagement and validation involving stakeholders, local experts, and qualitative understandings. Furthermore, a significant limitation of our study is exclusion of the smallest and likely most ruralized retail centers. These are likely to exhibit a significantly different distribution when considering where they are located, and as a result, all retail center functions have likely not been captured and described. This also has notable implications when considering the relationships between retail center scale and function, described earlier and shown in . Further studies into U.S. retail center geographies at the national extent should seek to explore these ideas further, seeking to understand what additional knowledge can be generated about the geographies of the U.S. retail system when incorporating these localities. Limitations aside, it is our view that we have been able to provide an empirically grounded and conceptual framework through which to better understand the geographies of U.S. retail centers. Throughout this article, we have generated new knowledge about where they are located, what characteristics they have and who uses them, and more importantly emphasized the importance of integration, utilizing the conceptual framework presented here, to yield the most compelling and useful geographical insights about these phenomena.
Supplemental Materials
Supplemental data for this article can be accessed on the publisher’s site at: http://dx.doi.org/10.1080/24694452.2022.2098087. This includes a more detailed overview of the variables used in the “The What of U.S. Retail Center Geographies” section of the article. In these materials we provide a much more specific summary of the variables used to assemble the multidimensional typology, in particular justifying and detailing their calculation, and use in the classification approach.
Supplemental Material
Download MS Word (43.9 KB)Acknowledgments
The authors would like to thank SafeGraph, Inc., for permitting access to various SafeGraph data sets through their academic program. We would also like to thank Professor Ling Bian (editor) and the two anonymous reviewers for their kind and thoughtful feedback on this article at various stages.
Additional information
Funding
Notes on contributors
Patrick Ballantyne
PATRICK BALLANTYNE is a Postdoctoral Research Fellow in the Geographic Data Science Lab, University of Liverpool, Liverpool L69 7ZT, UK. E-mail: [email protected]. His research generally involves the application of quantitative and spatial methodologies to better understand retail environments, with a particular interest in those outside of the United Kingdom. In particular, he is interested in the geographies of retail centers, and in demonstrating how such understanding can be used to better understand the effects of wider retail sector processes (e.g., COVID-19).
Alex Singleton
ALEX SINGLETON is a Professor of Geographic Information Science at the University of Liverpool, Liverpool L69 7ZT, UK, and Deputy Director of the ESRC CDRC. E-mail: [email protected]. His research is concerned with how the complexities of individual behaviors manifest spatially and can be represented and understood though a framework of geographic data science. In particular, his research has extended a tradition of area classification and he has developed a broad critique of the ways in which geodemographic methods can be refined through modern scientific approaches to data mining, GIScience, and quantitative human geography.
Les Dolega
LES DOLEGA is a Senior Lecturer in Retail Geography and Geographic Information Science, University of Liverpool, Liverpool L69 7ZT, UK. E-mail: [email protected]. His research interests and expertise are in economic and retail geography and GIS, in particular performance of town centers and their evolutionary trajectories. During his PhD at Southampton University, he investigated the impact of the 2008–2009 economic crisis on UK town centers and high streets. At the University of Liverpool, he has led a number of projects related to retail geography including “e-Resilience,” delineation of retail center boundaries for a national extent, and analysis of the economic performance of retail centers in Liverpool City Region.
Jacob Macdonald
JACOB MACDONALD is a Lecturer in GIS and Spatial Analysis in the Department of Urban Studies and Planning, University of Sheffield, Sheffield S10 2TN, UK. E-mail: [email protected]. His research interests involve leveraging big, spatial data for studies of urban environmental and economic processes. He is particularly interested in novel forms of granular data and the interplay of urban amenities, built environment, and neighborhood dynamics.
References
- Baker, R. G., and S. Wood. 2010. Towards robust development of retail planning policy: Maintaining the viability and vitality of main street shopping precincts. Geographical Research 48 (1):65–74. doi: 10.1111/j.1745-5871.2009.00622.x.
- Ballantyne, P., A. Singleton, L. Dolega, and K. Credit. 2022. A framework for delineating the scale, extent and characteristics of American retail centre agglomerations. Environment and Planning B: Urban Analytics and City Science 49 (3):1112–28. doi: 10.1177/23998083211040519.
- Berman, B., and J. R. Evans. 2013. Retail management: A strategic approach. London: Pearson.
- Berry, B. J. 1963. Commercial structure and commercial blight: Retail patterns and processes in the City of Chicago. Research Paper 85, University of Chicago, Department of Geography, Chicago.
- Berry, T., A. Newing, D. Davies, and K. Branch. 2016. Using workplace population statistics to understand retail store performance. International Review of Retail, Distribution and Consumer Research 26 (4):375–95. doi: 10.1080/09593969.2016.1170066.
- Borchert, J. G. 1998. Spatial dynamics of retail structure and the venerable retail hierarchy. GeoJournal 45 (4):327–36. doi: 10.1023/A:1006976407047.
- Brown, S. 1992. Retail location: A micro-scale perspective. Aldershot, UK: Ashgate.
- Casparis, J. 1969. Shopping center location and retail store mix in metropolitan areas. Demography 6 (2):125–31.
- Clapp, J. M., S. L. Ross, and T. Zhou. 2019. Retail agglomeration and competition externalities: Evidence from openings and closings of multiline department stores in the U.S. Journal of Business & Economic Statistics 37 (1):81–96. doi: 10.1080/07350015.2016.1272460.
- Clark, W. A. V. 1967. The spatial structure of retail functions in a New Zealand city. New Zealand Geographer 23 (1):23–33. doi: 10.1111/j.1745-7939.1967.tb00027.x.
- Comber, S., D. Arribas-Bel, A. Singleton, G. Dong, and L. Dolega. 2020. Building hierarchies of retail centers using Bayesian multilevel models. Annals of the American Association of Geographers 110 (4):1150–73. doi: 10.1080/24694452.2019.1667219.
- Davies, A., L. Dolega, and D. Arribas-Bel. 2019. Buy online collect in-store: Exploring grocery click & collect using a national case study. International Journal of Retail & Distribution Management 47 (3):278–91. doi: 10.1108/IJRDM-01-2018-0025.
- DeLisle, J. R. 2005. US shopping center classifications: Challenges and opportunities. Research Review 12 (2):96–101.
- Dennis, C., D. Marsland, and T. Cockett. 2002. Central place practice: Shopping centre attractiveness measures, hinterland boundaries and the UK retail hierarchy. Journal of Retailing and Consumer Services 9 (4):185–99. doi: 10.1016/S0969-6989(01)00021-2.
- Dolega, L., and D. Celińska-Janowicz. 2015. Retail resilience: A theoretical framework for understanding town centre dynamics. MPRA Paper No. 72319. Accessed December 3, 2021. https://mpra.ub.uni-muenchen.de/72319/1/MPRA_paper_72319.pdf.
- Dolega, L., and A. Lord. 2020. Exploring the geography of retail success and decline: A case study of the Liverpool City Region. Cities 96:102456. doi: 10.1016/j.cities.2019.102456.
- Dolega, L., M. Pavlis, and A. Singleton. 2016. Estimating attractiveness, hierarchy and catchment area extents for a national set of retail centre agglomerations. Journal of Retailing and Consumer Services 28 (28):78–90. doi: 10.1016/j.jretconser.2015.08.013.
- Dolega, L., J. Reynolds, A. Singleton, and M. Pavlis. 2019. Beyond retail: New ways of classifying UK shopping and consumption spaces. Environment and Planning B: Urban Analytics and City Science 48 (1):132–50.
- Dramowicz, E. 2005. Retail trade area analysis using the Huff model. Directions Magazine. Accessed December 3, 2021. https://www.directionsmag.com/article/3207.
- Environmental Protection Agency (EPA). 2021. Smart location database. Accessed December 7, 2021. https://www.epa.gov/smartgrowth/smart-location-mapping.
- Fotheringham, A. S. 1983. A new set of spatial-interaction models: The theory of competing destinations. Environment and Planning A: Economy and Space 15 (1):15–36. doi: 10.1177/0308518X8301500103.
- Glaeser, E., J. Kolko, and A. Saiz. 2001. Consumer city. Journal of Economic Geography 1 (1):27–50. doi: 10.1093/jeg/1.1.27.
- Gong, S., J. Cartlidge, R. Bai, Y. Yue, Q. Li, and G. Qiu. 2021. Geographical and temporal huff model calibration using taxi trajectory data. GeoInformatica 25 (3):485–512. doi: 10.1007/s10707-019-00390-x.
- Guy, C. M. 1998. Classifications of retail stores and shopping centres: Some methodological issues. GeoJournal 45 (4):255–64. doi: 10.1023/A:1006960414161.
- Han, Z., C. Cui, C. Miao, H. Wang, and X. Chen. 2019. Identifying spatial patterns of retail stores in road network structure. Sustainability 11 (17):4539–59. doi: 10.3390/su11174539.
- Helm, S., S. H. Kim, and S. Van Riper. 2020. Navigating the “retail apocalypse”: A framework of consumer evaluations of the new retail landscape. Journal of Retailing and Consumer Services 54:101683. doi: 10.1016/j.jretconser.2018.09.015.
- Huang, X., J. Lu, S. Gao, S. Wang, Z. Liu, and H. Wei. 2022. Staying at home is a privilege: Evidence from fine-grained mobile phone location data in the United States during the COVID-19 pandemic. Annals of the American Association of Geographers 112 (1):286–20. doi: 10.1080/24694452.2021.1904819.
- Huff, D. L. 1964. Defining and estimating a trading area. Journal of Marketing 28 (3):34–38. doi: 10.1177/002224296402800307.
- International Council of Shopping Centers (ICSC). 2017. U.S. shopping-center classification and typical characteristics. Accessed October 14, 2021. https://www.icsc.com/uploads/t07-subpage/US-Shopping-Center-Definition-Standard.pdf.
- Joseph, L., and M. Kuby. 2016. The location types of US retailers. International Journal of Applied Geospatial Research 7 (4):1–22.
- Larsson, J. P., and Ö. Öner. 2014. Location and co-location in retail: A probabilistic approach using geo-coded data for metropolitan retail markets. The Annals of Regional Science 52 (2):385–408. doi: 10.1007/s00168-014-0591-7.
- Liang, Y., S. Gao, Y. Cai, N. Z. Foutz, and L. Wu. 2020. Calibrating the dynamic Huff model for business analysis using location big data. Transactions in GIS 24 (3):681–703. doi: 10.1111/tgis.12624.
- Lloyd, A., and J. Cheshire. 2017. Deriving retail centre locations and catchments from geo-tagged Twitter data. Computers, Environment and Urban Systems 61:108–118. doi: 10.1016/j.compenvurbsys.2016.09.006.
- McCann, B. T., and T. B. Folta. 2008. Location matters: Where we have been and where we might go in agglomeration research. Journal of Management 34 (3):532–65. doi: 10.1177/0149206308316057.
- Micu, C. B. 2019. Types of shopping centers—Literature review. Spring Proceedings in Business and Economics. In Challenges and opportunities to develop organizations through creativity, technology and ethics, ed. S. L. Fotea, I. S. Fotea, and S. A. Vaduva, 164–77. Springer.
- Newing, A., G. P. Clarke, and M. Clarke. 2015. Developing and applying a disaggregated retail location model with extended retail demand estimations. Geographical Analysis 47 (3):219–39. doi: 10.1111/gean.12052.
- Nong, Y., S. Zhou, L. Liu, Q. Li, Y. Peng, and X. Hao. 2019. Structural cities: Delimiting retailing center boundaries and their hierarchical characteristics in urban China based on GPS-enabled taxi data. Journal of Planning Education and Research 39 (3):345–59. doi: 10.1177/0739456X17741964.
- Parr, J. B. 2017. Central place theory: An evaluation. Review of Urban and Regional Development Studies 29 (3):151–64.
- Pavlis, M., L. Dolega, and A. Singleton. 2018. A modified DBSCAN clustering method to estimate retail center extent. Geographical Analysis 50 (2):141–61. doi: 10.1111/gean.12138.
- Porta, S., E. Strano, V. Iacoviello, R. Messora, V. Latora, A. Cardillo, F. Wang, and S. Scellato. 2009. Street centrality and densities of retail and services in Bologna, Italy. Environment and Planning B: Planning and Design 36 (3):450–65. doi: 10.1068/b34098.
- Pratt, M. D., J. A. Wright, S. Cockings, and I. Sterland. 2014. Delineating retail conurbations: A rules-based algorithmic approach. Journal of Retailing and Consumer Services 21 (5):667–75. doi: 10.1016/j.jretconser.2014.04.011.
- Rao, F. 2020. Shopping centre morphologies in transition: Towards a morphological typology of retail synergies. Urban Design International 25 (4):310–27. doi: 10.1057/s41289-020-00114-w.
- Reilly, W. J. 1929. Methods for the study of retail relationships. Research Monograph No. 4, Bureau of Business Research, University of Texas, Austin.
- Root, E. D. 2012. Moving neighborhoods and health research forward: Using geographic methods to examine the role of spatial scale in neighborhood effects on health. Annals of the Association of American Geographers 102 (5):986–95.
- Rudavsky, R., C. E. Pollack, and A. Mehrotra. 2009. The geographic distribution, ownership, prices, and scope of practice at retail clinics. Annals of Internal Medicine 151 (5):315–20. doi: 10.7326/0003-4819-151-5-200909010-00005.
- Sadahiro, Y. 2001. A PDF-based analysis of the spatial structure of retailing. GeoJournal 52 (3):237–52. doi: 10.1023/A:1014272208507.
- SafeGraph, Inc. 2020a. Geometry data: The anchor of SafeGraph places. Accessed October 14, 2021. https://www.safegraph.com/blog/geometry-the-anchor-of-safegraph-places.
- SafeGraph, Inc. 2020b. Places manual. Accessed October 14, 2021. https://docs.safegraph.com/docs/places-manual.
- SafeGraph, Inc. 2020c. Weekly patterns. Accessed December 6, 2021. https://docs.safegraph.com/docs/weekly-patterns.
- SafeGraph, Inc. 2021. Announcing SafeGraph global brands. Accessed December 3, 2021. https://www.safegraph.com/blog/announcing-safegraph-global-brands.
- Scharadin, B., M. Ver Ploeg, and C. Dicken. 2022. Geographic boundary definitions and the robustness of common food retail environment measures. Annals of the American Association of Geographers 112 (5):1403–23.
- Sevtsuk, A. 2014. Location and agglomeration: The distribution of retail and food businesses in dense urban environments. Journal of Planning Education and Research 34 (4):374–93. doi: 10.1177/0739456X14550401.
- Shannon, J. 2016. Beyond the supermarket solution: Linking food deserts, neighborhood context, and everyday mobility. Annals of the American Association of Geographers 106 (1):186–202. doi: 10.1080/00045608.2015.1095059.
- Singleton, A., A. Alexiou, and R. Savani. 2020. Mapping the geodemographics of digital inequality in Great Britain: An integration of machine learning into small area estimation. Computers, Environment and Urban Systems 82:101486. doi: 10.1016/j.compenvurbsys.2020.101486.
- Singleton, A., D. L. Dolega, J. Macdonald, and P. Ballantyne. 2021. Retail centre boundaries. Accessed December 3, 2021. https://data.cdrc.ac.uk/dataset/retail-centre-boundaries.
- Singleton, A. D., L. Dolega, D. Riddlesden, and P. A. Longley. 2016. Measuring the spatial vulnerability of retail centres to online consumption through a framework of e-resilience. Geoforum 69:5–18. doi: 10.1016/j.geoforum.2015.11.013.
- Teller, C., and T. Reutterer. 2008. The evolving concept of retail attractiveness: What makes retail agglomerations attractive when customers shop at them? Journal of Retailing and Consumer Services 15 (3):127–43. doi: 10.1016/j.jretconser.2007.03.003.
- Torres-Baron, V. 2018. Is American retail at a historic tipping point?. CUNY Academic Works. Accessed December, 13, 2021. https://academicworks.cuny.edu/gj_etds/296/.
- Uber. 2018. H3: Uber’s hexagonal hierarchical spatial index. Accessed October 14, 2021. https://eng.uber.com/h3/.
- U.S. Census Bureau. 2021. American Community Survey data. Accessed December 7, 2021. https://www.census.gov/programs-surveys/acs/data.html.
- Vom Hofe, R., and S. D. Bhatta. 2007. Method for identifying local and domestic industrial clusters using interregional commodity trade data. Industrial Geographer 4 (2):1–27.
- Waddington, T. B. P., G. P. Clarke, M. Clarke, and A. Newing. 2018. Open all hours: Spatiotemporal fluctuations in U.K. grocery store sales and catchment area demand. International Review of Retail, Distribution and Consumer Research 28 (1):1–26. doi: 10.1080/09593969.2017.1333966.
- Wang, F., C. Chen, C. Xiu, and P. Zhang. 2014. Location analysis of retail stores in Changchun, China: A street centrality perspective. Cities 41:54–63. doi: 10.1016/j.cities.2014.05.005.
- Wang, J., N. McDonald, A. L. Cochran, L. Oluyede, M. Wolfe, and L. Prunkl. 2021. Health care visits during the COVID-19 pandemic: A spatial and temporal analysis of mobile device data. Health & Place 72:102679. doi: 10.1016/j.healthplace.2021.102679.
- Wang, Y., W. Jiang, S. Liu, X. Ye, and T. Wang. 2016. Evaluating trade areas using social media data with a calibrated Huff model. ISPRS International Journal of Geo-Information 5 (7):112. doi: 10.3390/ijgi5070112.
- Wilson, A. G. 1969. The use of entropy maximising models, in the theory of trip distribution, mode split and route split. Journal of Transport Economics and Policy 3 (1):108–26.
- Woodbury, C. 1928. The size of retail business districts in the Chicago metropolitan region. The Journal of Land & Public Utility Economics 4 (1):85–91. doi: 10.2307/3139227.
- Wrigley, N., D. Lambiri, G. Astbury, L. Dolega, C. Hart, C. Reeves, M. Thurstain-Goodwin, and S. Wood. 2015. British high streets: From crisis to recovery? A comprehensive review of the evidence. Southampton, UK: University of Southampton.
- Yabe, T., P. S. C. Rao, and S. V. Ukkusuri. 2021. Regional differences in resilience of social and physical systems: Case study of Puerto Rico after Hurricane Maria. Environment and Planning B: Urban Analytics and City Science 48 (5):1042–57. doi: 10.1177/2399808320980744.
- Zhai, W., M. Liu, X. Fu, and Z. R. Peng. 2021. American inequality meets COVID-19: Uneven spread of the disease across communities. Annals of the American Association of Geographers 111 (7):2023–43. doi: 10.1080/24694452.2020.1866489.
- Zhou, T., and J. M. Clapp. 2015. The location of new anchor stores within metropolitan areas. Regional Science and Urban Economics 50:87–107. doi: 10.1016/j.regsciurbeco.2014.11.003.