
 ?Mathematical formulae have been encoded as MathML and are displayed in this HTML version using MathJax in order to improve their display. Uncheck the box to turn MathJax off. This feature requires Javascript. Click on a formula to zoom.
Abstract
The rampant COVID-19 pandemic swept the globe rapidly in 2020, causing a tremendous impact on human health and the global economy. This pandemic has stimulated an explosive increase of related studies in various disciplines, including geography, which has contributed to pandemic mitigation with a unique spatiotemporal perspective. Reviewing relevant research has implications for understanding the contribution of geography to COVID-19 research. The sheer volume of publications, however, makes the review work more challenging. Here we use the support vector machine and term frequency-inverse document frequency algorithm to identify geographical studies and bibliometrics to discover primary research themes, accelerating the systematic review of COVID-19 geographical research. We confirmed 1,171 geographical papers about COVID-19 published from 1 January 2020 to 31 December 2021, of which a large proportion are in the areas of geographic information systems (GIS) and human geography. We identified four main research themes—the spread of the pandemic, social management, public behavior, and impacts of the pandemic—embodying the contribution of geography. Our findings show the feasibility of machine learning methods in reviewing large-scale literature and highlight the value of geography in the fight against COVID-19. This review could provide references for decision makers to formulate policies combined with spatial thinking and for scholars to find future research directions in which they can strengthen collaboration with geographers.
2020年, 新冠肺炎流行病迅速席卷全球, 对人类健康和全球经济造成了巨大影响。这次流行病激发了各个学科研究的爆炸性增长。其中, 地理学研究以独特的时空角度, 为流行病治理做出了贡献。对有关研究进行综述, 有助于理解地理学对新冠肺炎研究的贡献。然而, 海量的文献使得这个综述更具挑战性。为了加快对新冠肺炎地理研究的系统性综述, 我们利用支持向量机和词频-反文档频率算法寻找文献中的地理学研究, 利用文献计量学发掘主要研究题目。本文确认了2020年1月1日至2021年12月31日发表的1,171篇新冠肺炎地理学论文, 其中多数文章属于地理信息系统和人文地理学领域。确定了体现地理学贡献的四个主要研究题目:流行病传播、社会管理、公众行为和流行病影响。研究结果表明了利用机器学习方法去开展海量文献综述的可行性, 强调了地理学在抗击新冠肺炎的价值。该文献综述有助于决策者制定具备空间思维的政策, 也有助于学者们寻求加强与地理学者合作的未来研究方向。
La desenfrenada pandemia del COVID-19 se extendió con gran rapidez por todo el globo en 2020, ocasionando tremendo impacto en la salud humana y en la economía mundial. Esta pandemia ha estimulado un incremento explosivo de estudios relacionados en diferentes disciplinas, la geografía incluida, disciplina que ha contribuido a la mitigación de la pandemia, con una perspectiva espaciotemporal única. La revisión de la investigación relevante tiene implicaciones para entender la contribución de la geografía en la investigación del COVID-19. Sin embargo, el gran volumen de publicaciones hace más desafiante el trabajo de revisión. Dentro de ese contexto, usamos la máquina de vectores de apoyo y el algoritmo de frecuencia del término por frecuencia inversa de documento para identificar los estudios geográficos y la bibliometría, con el fin de descubrir los temas primarios de investigación, acelerando así la revisión sistemática de la investigación geográfica del COVID-19. Confirmamos la existencia de1.171 escritos geográficos sobre COVID-19, publicados entre el 1 de enero de 2020 y el 31 de diciembre de 2021, de los cuales una alta proporción se encuentra en las áreas de los sistemas de información geográfica (SIG) y de la geografía humana. Identificamos cuatro temas principales de investigación –la propagación de la pandemia, el manejo social de la crisis, el comportamiento público y los impactos de la pandemia– en los que se involucró la geografía. Nuestros hallazgos muestran la idoneidad de los métodos de aprendizaje automático para la revisión de literatura a gran escala y destacan el valor de la geografía en la lucha contra el COVID-19. Esta revisión podría aportar referencias para quienes son responsables de tomar decisiones en la formulación de políticas combinadas con el pensamiento espacial; y para los estudiosos puede ofrecer indicios para identificar direcciones futuras hacia la investigación en las que ellos puedan fortalecer la colaboración con los geógrafos.
Key Words:
Palabras clave:
The COVID-19 pandemic has caused a tremendous impact on the global economy, human health, and daily life. From the beginning of the outbreak, governments around the world have been striving to mitigate the epidemic. Researchers from different fields joined the battle against the pandemic on an unprecedented scale (Cunningham, Smyth, and Greene Citation2021). Understanding the spatial and temporal dynamics of COVID-19 is crucial to alleviate its spread, as it assists in comprehending the extent of the pandemic and decision-making (Franch-Pardo et al. Citation2020). Therefore, geography played an indispensable role in many aspects of the outbreak response. For example, geographical studies used surveys and interviews to understand people’s life and work status during the pandemic (Wasdani and Prasad Citation2020; Azeez E P et al. Citation2021). Many studies applied spatial analysis and other techniques to process multiple types of data obtained from the government, enterprises, and questionnaires to reveal COVID-19 distribution patterns (Benita and Gasca-Sanchez Citation2021), evolutionary trends (F. L. Liu et al. Citation2020), and associations with other variables (Correa-Araneda et al. Citation2021). Spatial analytics, such as spatial lag models (Oyedotun and Moonsammy Citation2021), multiscale geographically weighted regression (MGWR; Mollalo, Vahedi, and Rivera Citation2020; Mansour et al. Citation2021), and empirical Bayes smoothing (Mansour et al. Citation2022) have been used to explore the relationships between the virus transmission and environmental, socioeconomic, and demographic variables.
Identifying the contributions of geographers to the fight against the pandemic is underpinned by a systematic review of COVID-19 geographical research. In other fields, scholars have carried out reviews and bibliometric analysis to summarize the current findings in response to massive scientific outputs from COVID-19 studies to understand the research progress. For example, in environmental science, Shakil et al. (Citation2020) reviewed fifty-seven papers to disclose the relationship between COVID-19 and the environment, identified four research clusters, and proposed future research issues. In business and management, Verma and Gustafsson (Citation2020) conducted a bibliometric study of 107 papers, which showed that COVID-19 would catalyze several policy changes. In water science, Ji et al. (Citation2021) performed a bibliometric analysis of 262 papers, reflecting the role of water science in monitoring and predicting COVID-19. In addition, researchers from social sciences (Nasir et al. Citation2020) and tourism (Sigala Citation2020) have done similar work. The sheer volume of COVID-19 research has constrained the implementation of such review work. In response, many review studies used bibliometrics to assist in the evaluation and summary of the research. The enhancement of literature collection methods has been ignored, however, resulting in a smaller literature volume.
Machine learning techniques can greatly accelerate the identification of target articles. We aim to use machine learning and bibliometric methods to conduct a systematic review of geographical research to reveal the contributions of geographical science to COVID-19 research. The machine learning approach was adopted to identify whether a paper belongs to geographical research from the Web of Science database, and the co-word analysis was used to identify the research topics. Our review summarizes the following four questions from the view of geography: Which factors affect the spread of COVID-19? Which nonpharmaceutical intervention is appropriate? How are people living during the pandemic? What is the impact of COVID-19? This review helps policymakers better understand how spatial thinking can be adopted to control the spread of the virus, helps researchers understand current research progress, and provides a reference for future research.
Methods and Procedures
Data Sources
We choose the Web of Science (WOS) Core Collection database for our research. The WOS platform tracks interdisciplinary and cross-time ideas from nearly 1.9 billion cited references from more than 171 million records.Footnote1 Although WOS is not the database with the most extensive literature coverage, we can retrieve an adequate number of high-quality literature entries in this database. This is more fully reflected in the fields of medicine and natural science (Ellegaard and Wallin Citation2015).
Query Strategy
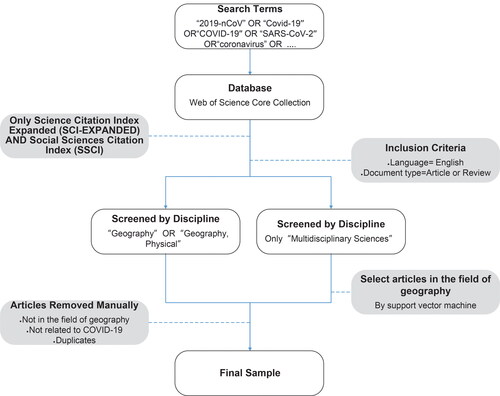
We selected Science Citation Index Expanded (SCI-Expanded) and the Social Sciences Citation Index (SSCI) from the WOS Core Collection database. To obtain comprehensive literature related to COVID-19, we performed the search string (see Appendix A in the Supplemental Material) in the Topic field (including title, abstract, author keywords, and keywords plus). We further filtered the search results in the following fields to ensure the quality of our search: Languages = English, Document Types = Articles or Review Articles, Year Published = 2020 or 2021. To limit the literature search results to the field of geography, we implemented a discipline screening work, detailed in the next section. Finally, we manually removed papers not in geography or irrelevant to COVID-19 and duplicate results. summarizes the entire paper retrieval process.
Figure 1 Flowchart of paper selection. We simultaneously identify articles in the target discipline in two ways. One is to screen the articles directly through the Web of Science Category (WC) field in the WOS platform, and the other is to use the machine learning method to automatically identify articles in the target discipline from articles with WC= (“Multidisciplinary Sciences”).
Defining Geographical Studies and Its Subfields
We selected Geography and Geography, Physical in the Web of Science Category (WC) field to collect geographic literature. In the WOS Core Collection, more than 200 journals are assigned to these two subject categories. The subject category of papers published in these journals is assigned as Geography or Geography, Physical in WOS.
Many geographical papers are published in interdisciplinary journals, however. Therefore, papers with WC= (“Multidisciplinary Sciences”) were selected.Footnote2 We applied a machine learning approach to identify geographical papers from among these papers.
Here, we chose support vector machine (SVM; Cortes and Vapnik Citation1995) as our machine learning approach. Its text classification ability is stronger than other common algorithms such as k-nearest-neighbor and naive Bayes (Z. Liu et al. Citation2010). SVM separates all kinds of samples by one or more hyperplanes in n-dimensional space, which can classify new samples. Computers, though, cannot directly process text data, meaning that we need to convert the text into numerical form first. Term frequency-inverse document frequency (TF-IDF; Salton and Yu Citation1975) is a statistical model that can vectorize text and is very popular in text mining. The TF-IDF value evaluates the relevance of a word to a document in a corpus. The following is a classic equation to calculate the TF-IDF value (W. Zhang, Yoshida, and Tang Citation2011):
In this equation,
is the TF-IDF value of word i in document j,
is the frequency of word i appearing in document j, N refers to the total number of documents in the corpus, and
refers to the number of documents in which word i appears. In this way, a document is represented as a vector composed of TF-IDF values of words, which the SVM model can then process. SVM models are often paired with the TF-IDF algorithm for text classification.
The specific process of geographical research identification is as follows: First, we select papers as the training set to train the SVM model. To simultaneously divide geographical papers into subdisciplines, we chose the Classification Catalogue of High-Quality Scientific and Technological Journals in The Field of Geographical Resources (2020)Footnote3 published by the Geographical Society of China, as one of the bases for selecting the text of the training set. The catalogue covers many geographical journals. It divides these journals into five fields: physical geography, human geography, geographic information system (GIS), natural resources, and geoscience data publishing. Here, we considered the first three subdisciplines. We conducted the literature retrieval to obtain the training set text according to the following criteria: Language = English, Document Type = Article or Review. We searched the papers of WC= (“Geography” OR “Geography, Physical”). We obtained 10,000 papers that are in and only in the list of physical geography journals, human geography journals, and GIS journals in the Catalogue, as well as 10,000 papers published in the journals that are not in the Catalogue. A total of 40,000 papers’ titles and abstracts are used as the training set text of geographical papers. Then, the papers whose WC values are not Geography, Geography, Physical, Geosciences, Multidisciplinary, and Multidisciplinary Sciences at the same time are retrieved. The titles and abstracts of 40,000 such papers are obtained as the training set text of nongeographical papers. In total, we collected the titles and abstracts of 80,000 papers as the training set.
Second, we converted these 80,000 documents into vectors through the TF-IDF method and input them into the SVM to train the model. The model gave a promising performance with 94.74 percent accuracy, 94.21 percent precision, 95.21 percent recall, and 94.71 percent F1 score. This model identified geographical papers from those Multidisciplinary Sciences papers.
Third, we divided the geographical papers into subdisciplines. These papers were divided into two parts. One part included subdiscipline classification because their journals were only in the physical geography, human geography, or the GIS journal lists. The second part did not. We then used the SVM algorithm to identify the subdisciplines to which they belonged. This training set consisted of the titles and abstracts of 10,000 papers published in each category of physical geography, human geography, or GIS journals, with a total of 30,000 samples. Those 30,000 samples were converted into vector form by the TF-IDF method to train the SVM model. Finally, the model classified papers in the second part according to subdisciplines.
Research Themes
To identify research themes in geography under COVID-19, we used biblioshiny, the app for an R-package named bibliometrix (Aria and Cuccurullo Citation2017), to generate a cooccurrence network of keywords plus. Keywords plus are generated by WOS (Tripathi et al. Citation2018). They are more descriptive than keywords and can more succinctly express the contents of the papers (Tripathi et al. Citation2018). From collecting the keywords plus from the papers’ data set and generating a cooccurrence network to using clustering technology to classify the themes of concern, we used biblioshiny for every step, and then research themes could be identified.
Results
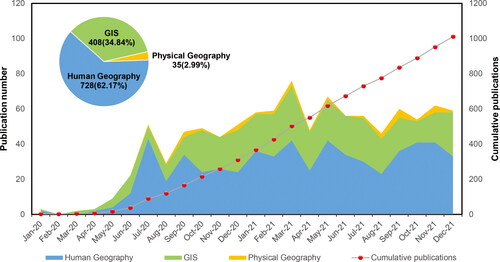
We obtained 490 papers on the premise of WC= (“Geography” OR “Geography, Physical”) and 7,236 papers with WC= (“Multidisciplinary Sciences”). We identified 780 geographical papers from the 7,236 papers through SVM. After the manual screening, we ended up with 1,171 geographical papers about COVID-19, including 728 human geography papers, 408 GIS papers, and 35 physical geography papers (). There are 378, 537, 164, and 57 papers from Q1, Q2, Q3, and Q4 journals, respectively.Footnote4
Figure 2 The COVID-19 publications in geography and monthly trends before December 2021. The line chart is presented with two y-axes. The left one represents the publication number per month, and the right one represents the cumulative publications. The pie chart shows the total amount and proportion of publications of the three subdisciplines. Since July 2020, the total number of publications has increased constantly, and the publications of human geography and geographic information systems (GIS) account for the vast majority.
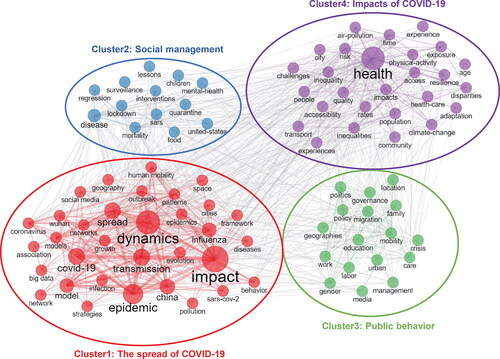
According to the cooccurrence network, we identified four major research themes, including the spread of COVID-19, social management, public behavior, and impacts of COVID-19 ( and Supplemental Material Table 1), and ten subthemes (Supplemental Material Table 1). We discuss them in detail in the next section. Other bibliometric results, including top productive journals, countries, and affiliations, are presented in the Supplemental Material, Tables 2 through 4.
Figure 3 Keywords plus cooccurrence network visualization map of COVID-19 literature in geography. Keywords plus are assigned by Web of Science. Each circle represents a keyword plus, and circles of the same color belong to the same cluster. The network indicates that there are four major research themes.
The Spread of COVID-19
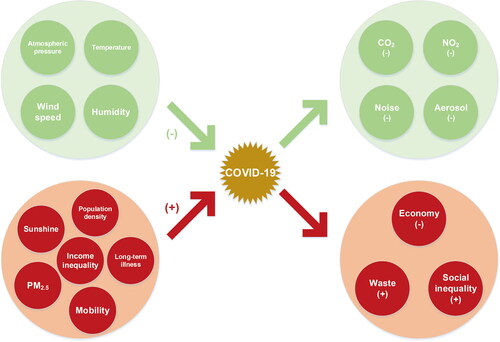
Factors Affecting the Spread of COVID-19. We can infer from the third law of geography (Zhu et al. Citation2018) that regions with similar geographical conditions tend to have similar epidemic situations. Studying the factors influencing the spread of COVID-19 helps us assess the infection risk. We divided and reviewed three factors: nature, economy, and society. illustrates the main findings. Sunshine, ozone, fine particulate matter (PM2.5), population mobility, employment level, income inequality, population density, and long-term illness promote the spread of COVID-19. Conversely, atmospheric pressure, temperature, wind speed, and humidity inhibit it.
Figure 4 Illustration of factors affecting the spread of COVID-19 and negative/positive impacts of COVID-19. On the left, the green and red circles represent the factors that inhibit and promote the spread of COVID-19, respectively (– represents inhibit and + represents promote). On the right, the green and red circles represent the positive and negative impacts, respectively (– represents decrease and + represents increase).
Among natural factors, temperature has been the most studied. Rising temperature inhibits the transmission of COVID-19 (Correa-Araneda et al. Citation2021; Ganslmeier, Furceri, and Ostry Citation2021). For example, Shaman et al. (Citation2021) found that the rise in the UK autumn lethality of COVID-19 in 2020 was due to not only the alpha variant (B.1.1.7), but also seasonality. Briz-Redon and Serrano-Aroca (Citation2020), however, found that research results on the effects of temperature are controversial and might reflect the spatial heterogeneity of the relationship between temperature and COVID-19 transmission. Similarly, humidity (Correa-Araneda et al. Citation2021), wind speed (Ganslmeier, Furceri, and Ostry Citation2021), and atmospheric pressure (Correa-Araneda et al. Citation2021) are also negatively correlated with the spread. Sunshine, however, can promote the spread. The longer the duration of sunshine, the more cases of infection (Lim et al. Citation2021). As for air quality factors, PM2.5 (Benita and Gasca-Sanchez Citation2021) and ozone (Lim et al. Citation2021) increase the number of local cases.
For economic factors, at the national level, gross domestic product (GDP) correlates positively with the number of cases, deaths, and infection growth rates (Skórka et al. Citation2020). Countries with higher GDP per capita tend to have earlier outbreaks (Jankowiak et al. Citation2020). At the regional or city level, employment level (Buja et al. Citation2020) and GDP (Lilleri et al. Citation2020) covary positively with COVID-19 transmission. This might be because higher employment levels and GDP mean greater population mobility (Buja et al. Citation2020; Lilleri et al. Citation2020). Another study, however, shows a negative relationship between GDP per capita and deaths (Oyedotun and Moonsammy Citation2021). Moreover, income inequality has led to an increase in cases (Benita and Gasca-Sanchez Citation2021). At the individual level, lower individual income carries a higher risk of death (Drefahl et al. Citation2020).
In terms of social factors, the greater the population density, the more difficult it is to maintain social distance (Wong and Li Citation2020). Therefore, high population density facilitates COVID-19 transmission (Buja et al. Citation2020; Wong and Li Citation2020). Wong and Li (Citation2020), however, emphasized that the effect of population density is mainly reflected in the later stage of the pandemic. The reason could be the temporal nonstationarity in the association between population density and health.
Furthermore, age structure is also an important factor. The growth rate of cases (Skórka et al. Citation2020) and infection rate (Buja et al. Citation2020) are negatively associated with age, as older adults leave home less and do better in maintaining social distance (Buja et al. Citation2020). Older populations have higher mortality rates, though (Millar et al. Citation2021). Meanwhile, intergenerational coresidence regulates the relationship between age structure and viral propagation. Living with young people increases older adults’ risk of death due to family infection (Esteve et al. Citation2020). The effect of interage contacts might be small, however (Sage, Albertini, and Scherer Citation2021). Long-term illnesses such as asthma (Millar et al. Citation2021) and diabetes (Benita and Gasca-Sanchez Citation2021) also bring about more serious circumstances. In the United States, the spread of COVID-19 reflects certain racial differences. The disease is more severe in counties in metropolitan areas where African Americans and Hispanic Americans live isolated from White Americans (Yu et al. Citation2021). In other respects, the lack of health insurance (Grekousis, Wang, and Liu Citation2021) and low education levels (Drefahl et al. Citation2020; Grekousis, Wang, and Liu Citation2021) have also led to a higher mortality rate.
According to the first law of geography (Tobler Citation1970), “Everything is related to everything else, but near things are more related than distant things,” we speculate that proximity to high-infection areas carries a high risk, which was confirmed by Florida and Mellander (Citation2022). Mobility compresses spatial things (Kost Citation2020), bringing regions closer. Thus, human mobility is one of the main driving forces for the spread of COVID-19 (Kubota et al. Citation2020). At the international level, mobility promotes spread (Kubota et al. Citation2020). The number of tourists in a country is positively related to COVID-19 infections, deaths, and growth rate (Skórka et al. Citation2020). At the intercity level, the risk is associated with the degree of urban transport development and urban openness (F. X. Wang et al. Citation2021). In the initial stage of the outbreak, intercity mobility from Wuhan (the first city in China to report COVID-19 cases) caused a difference in disease incidence between cities, with cities closer to Wuhan facing a higher risk (Mu, Yeh, and Zhang Citation2021). In the United Kingdom, mobility from Greater London enhanced the spread of the alpha (B.1.1.7) variant (Kraemer et al. Citation2021). As for intracity mobility, citizens’ mobility affects disease diffusion, including job commuting as a transmission channel (Mitze and Kosfeld Citation2022).
The Spread of COVID-19 in the Media. Information about the pandemic spread on traditional television news and modern social media. Highly accurate information can promote public self-protection, but dis- and misinformation can cause panic and increase the infection risk (X. Zhang et al. Citation2021). Scholars have studied how the information flow affects COVID-19, using techniques such as network reconstruction techniques (X. Zhang et al. Citation2021), MGWR (Forati and Ghose Citation2021), and diffusion models (Prieto Curiel and Gonzalez Ramirez Citation2021). They found that rural residents in media markets more affected by COVID-19 were more willing to maintain social distancing (K. Kim, Shepherd, and Clinton Citation2020). At the same time, novel social media have become spaces for some people to express their care and solidarity (Chen Citation2020). The free spread of misinformation, however, might have contributed to the rapid global spread of the pandemic (X. Zhang et al. Citation2021). For example, antivaccine views reduce the social benefits of vaccination strategies (Prieto Curiel and Gonzalez Ramirez Citation2021). Six states in the United States experienced a surge in COVID-19 cases after a period of misinformation spread on Twitter (Forati and Ghose Citation2021).
Epidemic Prediction. Capturing the temporal and spatial evolution of COVID-19 can help us better prevent and avoid the spread of viruses. The Susceptible-Infected-Recovered (SIR) model, Susceptible-Exposed-Infected-Recovered (SEIR) model, and their variants (Piccolomini and Zama Citation2020), as well as the Bayesian model (Bryant and Elofsson Citation2020) and geographically weighted regression (GWR) model (F. L. Liu et al. Citation2020) were widely used to predict the development of the pandemic. In addition to the data of confirmed cases, mobility data of the population (F. L. Liu Citation2020), geotagged social media data (I. K. Cheng et al. Citation2021), Google query data (Mavragani and Gkillas Citation2020), and data on phone calls to a COVID information line (Alvarez et al. Citation2021) can be used in prediction. Public participation also plays a role. Antoniou, Vassilakis, and Hatzaki (Citation2020) developed a GIS-based crowdsourcing application, predicting possible hot spots by anonymously answering whether people have experienced COVID-19 symptoms.
Social Management
To curb the spread of COVID-19, governments implemented a series of nonpharmaceutical interventions (NPIs). Implementing some NPIs, however, has incurred certain social costs (Brauner et al. Citation2021). Therefore, it is crucial to assess the effectiveness of NPIs. Studies used models like the agent-based model and several variants of the SIR model to simulate epidemic changes. The effectiveness of interventions can be evaluated by comparing the epidemic situation before and after their implementation.
Travel Restriction. Cross-regional travel leads to the disease’s spread, which develops independently in each region (Cacciapaglia and Sannino Citation2020). Travel restrictions can slow the spread of disease from the source (Espinoza, Castillo-Chavez, and Perrings Citation2020). The results of Cacciapaglia and Sannino (Citation2020) suggest that inter-city travel bans delayed the peak of infection, and if there were no inter-city travel restrictions, the COVID-19 in China and western countries would have been more serious (Yang et al. Citation2020). Simultaneously, for most Western countries, the earlier international travel is banned, the fewer the total confirmed cases (Yang et al. Citation2020).
Social Distancing. Cacciapaglia and Sannino (Citation2020) found that social distancing interventions were more effective in postponing the epidemic peak than restrictions on cross-border travel. Brauner et al. (Citation2021) studied the individual effectiveness of diverse social distancing measures and confirmed that they all reduced the COVID-19 spread. Nonetheless, rurality and other factors dampen their effects (Courtemanche et al. Citation2021; Glogowsky, Hansen, and Schachtele Citation2021). Moreover, related research uses people’s location data from smartphones to study public compliance with the social distancing policy (Lee et al. Citation2020).
Contact Tracing. Tracing the close contacts of confirmed patients is important in preventing further disease transmission. Some studies support this view (Hartvigsen Citation2021; Piasecki, Mucha, and Rosińska Citation2021). After the outbreak of COVID-19, many governments deployed digital contact tracing applications (Amann, Sleigh, and Vayena Citation2021). When users test positive for the virus, the applications notify their recent contacts (Wymant et al. Citation2021). Wymant et al. (Citation2021) estimated that a 1 percent increase in the application’s coverage resulted in a 0.8 percent to 2.3 percent reduction in the number of cases. In addition to mobile phones, credit cards and closed-circuit television have also achieved contact tracing (Sonn and Lee Citation2020).
Test–trace–quarantine. Interventions that restrict mobility have generated huge social and economic costs (Kerr et al. Citation2021), which are difficult to sustain for a long time. In reopening society, testing and quarantining interventions resulted in fewer lost working days than long-term lockdown (Eilersen and Sneppen Citation2020). Unless the overall transmission rate remains persistently low, however, the effectiveness of quarantining symptomatic cases in local areas is limited (Wells et al. Citation2020). Further quarantining nonsymptomatic persons with infections that can be detected through testing and tracing is critical to reducing the overall epidemic (Wells et al. Citation2020). Chiba (Citation2021) reached a similar conclusion. The success of the test–trace–quarantine intervention, however, requires good performance at each step, including high quarantine compliance and high testing and tracing rates (Kerr et al. Citation2021).
Public Behavior
Mobility. COVID-19 has changed people’s mobility patterns to an unprecedented extent. Mobile phone positioning data, geotagged social media data, and data from transportation systems (subway systems, bike-sharing programs) have been used to discover mobility patterns.
The primary change is the reduction in mobility. For example, travel interventions in China reduced intercity (Li et al. Citation2021; Mu, Yeh, and Zhang Citation2021) and intracity mobility (Mu, Yeh, and Zhang Citation2021). After stay-at-home orders were implemented, people’s willingness to stay at home became stronger (Lee et al. Citation2020). Mobility gradually recovered, though, as the lockdown continued (Joshi and Musalem Citation2021). In some areas, fewer people went to recreational places and workplaces, but more went to urban green spaces (Venter et al. Citation2021; Zhai, Liu, and PengCitation2021). As for the direction of mobility, migration from cities to rural areas (Kishore et al. Citation2021), suburbs, and exurbs (Anacker Citation2022) occurred. A study in Finland found that this pandemic led to a decrease in population in urban centers but an increase in rural areas (Willberg et al. Citation2021).
Mobility patterns also vary by group or region. Residents in poorer areas reduced their mobility less than those in wealthier areas (S. Kim et al. Citation2021; Zhai, Liu, and PengCitation2021). In addition, mobility patterns are related to political parties (J. Kim and Kwan Citation2021) and individuals’ education levels (Charoenwong, Kwan, and Pursiainen Citation2020).
Work. People who need to work outside the home have been greatly affected by COVID-19. There was a decline in out-of-home commuting activities due to COVID-19–related restrictions and employer mandates (Beck, Hensher, and Wei Citation2020). As a result, teleworking rates have increased (Lee et al. Citation2020). Working from home has certain disadvantages, though. Graduate students and postdoctoral fellows are limited in doing experiments in the lab and getting data, increasing their stress when working from home (Suart et al. Citation2021).
Education. The pandemic forced the closure of many kindergartens, schools, and universities (Katz, Jordan, and Ognyanova Citation2021; Poulain et al. Citation2021). Therefore, educational institutions shifted their teaching methods from face-to-face to online (Day et al. Citation2021). This had negative effects. Pupils made little progress in learning at home, especially in countries with longer school closures or poorer infrastructure (Engzell, Frey, and Verhagen Citation2021). Children’s learning at home reduced education to indoor activities and school assignments (Poulain et al. Citation2021). Disciplines like microbiology need some means to make up for the lack of practical activities (Armellini et al. Citation2021). As for college students, the absence of field work and laboratory learning posed challenges for education in majors such as geography (Day et al. Citation2021). To improve the efficiency of students’ online learning, we need to ensure two factors: (1) high-quality Internet and devices that can connect to the Internet, and (2) the ability to easily contact and communicate with teaching staff (Katz, Jordan, and Ognyanova Citation2021). As opposed to students, online learning has helped workers. Mass layoffs following the outbreak stimulated the demand for online learning, and online platforms support job security and promote social mobility by providing equal learning opportunities (Kizilcec, Makridis, and Sadowski Citation2021).
Mental Health. COVID-19 restricted people’s daily activities, making harm to their mental health inevitably. Meanwhile, some people in geography are just concerned with the dynamic and recursive relationship between emotions and places or spaces—emotional geography (Gregory et al. Citation2009). Therefore, COVID-19 research in geography has focused on people’s mental health.
People’s expressed sentiment (J. H. Wang et al. Citation2022) and happiness (Choi et al. Citation2021) dropped, and loneliness increased (McKenna-Plumley et al. Citation2021) after the outbreak. Juggling family education, child care, and additional housework could bring about poor mental health among people with families, especially single mothers (Xue and McMunn Citation2021). Research on rural areas has also found negative effects of lockdown policies on the mental health of residents, particularly rural women (Jia et al. Citation2021). Men’s happiness changed less than women’s (Choi et al. Citation2021; Saikia et al. Citation2021). To combat this damage, people either seek a sense of belonging and closeness through family (Okabe-Miyamoto et al. Citation2021) or visit parks to boost their happiness (Y. Y. Cheng et al. Citation2021).
Impacts of COVID-19
The pandemic and NPIs reduce human activities, which resulted in a series of impacts, covering economic, social, and natural aspects (see ).
Impact on Economy. Both economic vitality and market demand declined after the outbreak. First, at the macrolevel, international trade was affected. Verschuur, Koks, and Hall (Citation2021) found the following situation through geospatial location and other data: Global maritime trade suffered huge losses, hitting the manufacturing industry and some small island developing countries hardest. Besides maritime trade (Millefiori et al. Citation2021), Meng et al. (Citation2021) predicted a decrease in the scale of air cargo by seasonal autoregressive integrated moving average model, a time series prediction method.
Second, the economic impact is reflected at the industry and regional levels. The downturn was particularly evident in energy markets, putting extraordinary pressure on energy-producing countries such as Russia (Connolly, Hanson, and Bradshaw Citation2020). Labor-intensive industries were one of the most affected industries in the short term (Wu et al. Citation2021). For example, NPIs such as roadblocks harm crop production and the supply of agricultural products (Pan et al. Citation2020). In addition, Shao et al. (Citation2021) used nighttime light to monitor the recovery of economic activities. To understand economic resilience, Zhai and Yue (Citation2022) visualized the spatiotemporal distribution of closed businesses.
Finally, at the individual level, the pandemic affected people of different incomes differently, leading to increased inequality (Aspachs et al. Citation2021).
To mitigate the impact on the economy, we need to improve our NPIs, such as only quarantining people with symptoms similar to those of COVID-19 (Balike Dieudonne Citation2021). Furthermore, governments need to enhance unemployment insurance and the welfare of furloughed workers (Aspachs et al. Citation2021).
Impact on Nature. The weakening of human activity indirectly caused COVID-19 to affect the natural environment. The most important change was the improvement of air quality. Through satellite monitoring and other means, researchers found that the emissions of nitrogen dioxide (NO2), carbon dioxide (CO2), sulfur dioxide (SO2), particulate matter (e.g., PM2.5), and aerosols decreased after the lockdown (Z. Liu et al. Citation2020; Ali et al. Citation2021; Fyfe et al. Citation2021; Misra et al. Citation2021; Slezakova and Pereira Citation2021; Y. Z. Zhang et al. Citation2021). This short-term reduction in emissions, however, has only a limited impact on the climate (Fyfe et al. Citation2021). There is also a noise reduction during the lockdown (Somala Citation2021). Therefore, the impact on nature has more positive significance than other aspects, and this is a good opportunity to study the impact of human activities on the natural environment, such as air quality (Misra et al. Citation2021). Humans produce more waste than before (van Zyl and Celik Citation2021), though, such as plastic waste (Peng et al. Citation2021).
Social Inequality. Equality, including social equality, is an important principle underlying some geographical scholarship (Gregory et al. Citation2009). The pandemic brought many difficulties and inconveniences to people’s lives, especially vulnerable populations, aggravating social inequality. Geography, especially in areas such as welfare geography, has long focused on inequality of living standards (Gregory et al. Citation2009). Several groups were particularly affected during the pandemic.
In slums, basic facilities such as water supply and sanitation are unreliable and often shared (Morgan Citation2020). Moreover, the high population density in slums led to the rapid spread of the coronavirus (Wasdani and Prasad Citation2020). Meanwhile, slum dwellers tend to be daily wage workers (Wasdani and Prasad Citation2020). COVID-19 cannot stop them from working (Morgan Citation2020), increasing the likelihood of residents violating the lockdown policy. Huang et al. (Citation2022) found that low-income groups were relatively less compliant with stay-at-home orders through mobile phone location data. Therefore, protective policies should be provided for slum dwellers, including (Morgan Citation2020; Wasdani and Prasad Citation2020) (1) providing cash support, (2) disseminating relevant information on the response to the virus, (3) providing hygiene products, and (4) deploying health workers to slums.
During the pandemic, numerous migrant workers lost their jobs due to factors such as the closure of economic activities (Azeez E P et al. Citation2021) and the reduction of the market size (Che, Du, and Chan Citation2020). Moreover, the virus made it harder for migrant workers to travel between their hometowns and work areas (Che, Du, and Chan Citation2020; Azeez E P et al. Citation2021). For all these reasons, the lives of migrant workers have fallen into trouble, reflecting the urgent need for the government to strengthen social security for migrant workers (Che, Du, and Chan Citation2020; Azeez E P et al. Citation2021).
Around the world, the impact of COVID-19 on ethnic minorities has been particularly severe (Ibarra-Nava et al. Citation2021). Some ethnic minorities have higher rates of infection or death, such as Indigenous Mexicans (Ibarra-Nava et al. Citation2021), African Americans (Bassolas, Sousa, and Nicosia Citation2021), Hispanic Americans (Yu et al. Citation2021), and Native Americans (F. X. Wang et al. Citation2021). The main reasons for this phenomenon are social and historical factors, not biological factors (Bassolas, Sousa, and Nicosia Citation2021).
Ethnic minority populations are more engaged in basic service work and cannot work remotely (Bassolas, Sousa, and Nicosia Citation2021). Bassolas, Sousa, and Nicosia (Citation2021) discovered the importance of commuting locations by building two spatial networks: the adjacency network and the commuting network. Second, the unfair distribution of health resources leads to difficulty in accessing health services (Ibarra-Nava et al. Citation2021). Third, the combination of racial residential segregation and unequal income distribution exacerbates the concentration of poverty and furthers the uneven distribution of social resources (Yu et al. Citation2021). Furthermore, it also has to do with language barriers (Ibarra-Nava et al. Citation2021), comorbidity (Bassolas, Sousa, and Nicosia Citation2021; F. X. Wang et al. Citation2021), and racial biases in medical treatment (Yu et al. Citation2021).
In response, it is necessary to solve the unequal distribution of health resources and eliminate financial, social, and other obstacles to realizing social justice (Ibarra-Nava et al. Citation2021), such as reducing the income gap (Yu et al. Citation2021). In addition, the difficult experiences of lesbian, gay, bisexual, transgender, queer, questioning, and two-spirit youth (LGBTQ2S; Abramovich et al. Citation2021) and noncitizen children (Loganathan et al. Citation2021) have also attracted the attention of researchers.
Methodologies in the Research
Regression. Regression methods mainly reveal the correlation of various factors with COVID-19 transmission. COVID-19 research in geography has used many general regression methods, including stepwise ordinary least squares (OLS) regression (Buja et al. Citation2020), zero-inflated negative binomial regression (Benita and Gasca-Sanchez Citation2021), and logistic regression (Ibarra-Nava et al. Citation2021). In addition, some spatial regression models have also been used. Oyedotun and Moonsammy (Citation2021) applied a spatial lag model to consider the spatial dependence between neighboring countries. F. L. Liu et al. (Citation2020) used the GWR model to study the effects of geographical factors and perform an epidemic prediction. Forati and Ghose (Citation2021) used MGWR to study the virus variation on multiple spatial scales.
Clustering. Methods related to clustering are used to detect COVID-19 hot spots and automatically classify data with spatiotemporal attributes. Ganegoda et al. (Citation2021) used global Moran’s I and global Geary’s C to calculate the spatial autocorrelation to identify local clusters of COVID-19 cases. Benita and Gasca-Sanchez (Citation2021) confirmed geographical disease clusters via spatial scan statistics. Grekousis, Wang, and Liu (Citation2021) used local fuzzy geographically weighted clustering that combines geography with the fuzzy c-means method to classify counties.
Network. Network technology can simulate the spread of the virus and information in the population. In a network, nodes represent individuals, and edges represent contacts between individuals. This method analyzes the effects of information transmission (Prieto Curiel and Gonzalez Ramirez Citation2021), NPIs (Hartvigsen Citation2021), and factors (Sage, Albertini, and Scherer Citation2021) on the spread of the pandemic.
Remote Sensing. Remote sensing has played a part in the research on the impacts of COVID-19 on nature. Various instruments have observed changes in air quality (e.g., NO2, aerosols; Ali et al. Citation2021; Y. X. Zhang et al. Citation2021) and solid waste production (van Zyl and Celik Citation2021) after the outbreak.
Survey and Interview. Such methods help researchers gather target information, contributing to public behavior and social inequality research. For example, Saikia et al. (Citation2021) studied the impact of the pandemic on personal well-being, including mental health, through online surveys. Abramovich et al. (Citation2021) and Azeez E P et al. (Citation2021) investigated the impact of COVID-19 on the lives of LGBTQ2S youth and migrant women workers, respectively, through interviews.
Other Common Methodologies. The agent-based model determines the epidemic trend by simulating the spatial behavior of individuals and the interactions between individuals. This model is mainly used to evaluate the efficiency of various NPIs. Kishore et al. (Citation2021) studied how changes in human mobility due to lockdown policies affected COVID-19 transmission. The SIR model and its variants are often used in evaluating NPIs and epidemic prediction. Yang et al. (Citation2020) incorporated human mobility into the SEIR model to comprehend the disease spread.
Discussion and Conclusions
This study has completed a systematic review of COVID-19 geographical research. We identified four major research topics through machine learning and bibliometric methods. First, the spread of the pandemic is a major research topic. Because the distribution of the virus is spatially heterogeneous, research on factors affecting the spread receives extensive attention. For instance, PM2.5 promotes COVID-19 transmission, and high temperature inhibits transmission. Second, researchers did much work on NPIs and found that the test–trace–quarantine process only produces relatively lower social costs. Third, the virus and NPIs have changed the daily life of people, including mobility, work, and education patterns. Meanwhile, people’s mental health has suffered, necessitating the attention of researchers and policymakers. Fourth, the pandemic has hampered economic activities and exacerbated social inequality. The only exception is that the impact of COVID-19 on nature is relatively positive, resulting in the improvement of air quality.
Therefore, geographical science has contributed to many aspects of COVID-19 research. The identified research themes indicate hot spots and provide references for future research by geographers. This pandemic presents a good opportunity to study the impact of human activities on the natural environment due to the sharp decline in human activities. Moreover, other researchers studying these themes can strengthen their interdisciplinary cooperation with geographers. Geographers provide a spatiotemporal perspective for research in other fields. Spatial analysis methods in geography and data sets with spatiotemporal attributes made by geographers have the power to facilitate interdisciplinary research. For governments, GIS-based applications recording public mobility can help officials and policymakers understand the development trend of COVID-19 and predict the hot spots. Findings from COVID-19 research in geography on the theme of the spread of COVID-19 help authorities assess jurisdiction-wide infection risks based on local natural, economic, and social characteristics to take more targeted strategies, avoiding the waste of public resources from the one-size-fits-all approach. Prediction models can help with the prediction of future waves and allow policymakers to prepare in advance. Findings from the social management theme help select the most appropriate NPI to contain the diffusion of the virus. Findings from the last two themes tell managers to focus not only on the pandemic itself but also on the series of impacts of the pandemic when formulating policies. For example, depending on the specific impacts of the virus on people’s lives, economy, nature, and society, governments need to propose targeted policies to minimize the damage of the virus. As well as interdisciplinary cooperation, governments need to enhance cross-sectoral integration to combat COVID-19.
Although other fields have also conducted reviews of COVID-19 research, they did not consider machine learning methods to collect literature, reducing the comprehensiveness of the collection results. Moreover, through this study, one can realize that the scope of COVID-19 research in many other fields is generally less extensive than in geography. For example, systematic reviews tell us that environmental science (Shakil et al. Citation2020) mainly focuses on the impact of various natural factors on COVID-19 transmission and the impact of COVID-19 on the natural environment, and the field of business and management (Verma and Gustafsson Citation2020) studies the effects of COVID-19 on business, supply chain management, the service industry, and so on. This fact reflects the all-encompassing nature of geographical science.
Our systematic review has certain limitations. First, we only searched publications published in 2020 and 2021, resulting in very few studies on COVID-19 variants collected. Second, this study restricted the search to publications indexed in one database (Web of Science). Finally, although our study applied machine learning and bibliometric methods, it borrowed much manual power to conduct the review work, reducing the automation of the whole workflow.
We found several directions worthy of our attention in future research. Studying the factors affecting virus transmission is critical, but the conclusions of some related studies are not consistent. It is necessary to carry out a quantitative meta-analysis of all relative factors. Then, COVID-19 has attracted researchers from different fields. What interdisciplinary work have geographers been involved in? In what fields have they collaborated with researchers? We think these are interesting research questions. Furthermore, review work needs deeper integration with machine learning methods. Future research should explore more machine learning methods to be applied to a systematic review, reducing labor costs to a greater extent and mining more interesting results.
Supplemental Material
Download MS Word (36.3 KB)Acknowledgments
We are grateful to Ling Bian and two anonymous reviewers for their insightful comments.
Supplemental Material
Supplemental data for this article can be accessed on the publisher’s site at: https://doi.org/10.1080/24694452.2022.2130143
Additional information
Funding
Notes on contributors
Jinglun Xi
JINGLUN XI is a PhD Student in the State Key Laboratory of Resources and Environmental Information System, Institute of Geographic Sciences and Natural Resources Research, Chinese Academy of Sciences, Chaoyang 100101, Beijing, China. E-mail: [email protected]. His research interests include quantitative geoscience and knowledge graphing.
Xiaolu Liu
XIAOLU LIU is a PhD Student in the State Key Laboratory of Resources and Environmental Information System, Institute of Geographic Sciences and Natural Resources Research, Chinese Academy of Sciences, Chaoyang 100101, Beijing, China. E-mail: [email protected]. Her research interests include geoscience knowledge graphing.
Jianghao Wang
JIANGHAO WANG is an Associate Professor in the State Key Laboratory of Resources and Environmental Information System, Institute of Geographic Sciences and Natural Resources Research, Chinese Academy of Sciences, Chaoyang 100101, Beijing, China. E-mail: [email protected]. His research interests include geospatial analysis and modeling.
Ling Yao
LING YAO is an Associate Professor in the State Key Laboratory of Resources and Environmental Information System, Institute of Geographic Sciences and Natural Resources Research, Chinese Academy of Sciences, Chaoyang 100101, Beijing, China. E-mail: [email protected]. His research interests include remote sensing and geographical analysis.
Chenghu Zhou
CHENGHU ZHOU is a Professor in the State Key Laboratory of Resources and Environmental Information System, Institute of Geographic Sciences and Natural Resources Research, Chinese Academy of Sciences, Chaoyang 100101, Beijing, China. E-mail: [email protected]. His research interests include GIScience and geographical analysis.
Notes
1 The Web of Science Web site is available at https://clarivate.com/webofsciencegroup/solutions/web-of-science/ (accessed July 9, 2021).
2 Note that in WOS, a paper can be assigned to multiple categories. Here we only retain papers that have been assigned to only one WC and WC= (“Multidisciplinary Sciences”).
4 There are thirty-five papers from the journal HELIYON, for which WOS did not assign the attribute category quartile.
References
- Abramovich, A., N. Pang, A. Moss, C. H. Logie, M. Chaiton, S. A. Kidd, and H. A. Hamilton. 2021. Investigating the impacts of COVID-19 among LGBTQ2S youth experiencing homelessness. PLoS ONE 16 (9):e0257693. doi: 10.1371/journal.pone.0257693.
- Ali, G., S. Abbas, F. M. Qamer, and S. M. Irteza. 2021. Environmental spatial heterogeneity of the impacts of COVID-19 on the top-20 metropolitan cities of Asia-Pacific. Scientific Reports 11 (1):20339. doi: 10.1038/s41598-021-99546-9.
- Alvarez, E., D. Obando, S. Crespo, E. Garcia, N. Kreplak, and F. Marsico. 2021. Estimating COVID-19 cases and outbreaks on-stream through phone calls. Royal Society Open Science 8 (3):202312. doi: 10.1098/rsos.202312.
- Amann, J., J. Sleigh, and E. Vayena. 2021. Digital contact-tracing during the Covid-19 pandemic: An analysis of newspaper coverage in Germany, Austria, and Switzerland. PLoS ONE 16 (2):e0246524. doi: 10.1371/journal.pone.0246524.
- Anacker, K. B. 2022. US suburbs and the global COVID-19 pandemic: From cleanscapes to safescapes? The case of the New York Metropolitan area. Urban Geography 43 (8):1260–67. doi: 10.1080/02723638.2021.2003608.
- Antoniou, V., E. Vassilakis, and M. Hatzaki. 2020. Is crowdsourcing a reliable method for mass data acquisition? The case of COVID-19 spread in Greece during spring 2020. ISPRS International Journal of Geo-Information 9 (10):605. doi: 10.3390/ijgi9100605.
- Aria, M., and C. Cuccurullo. 2017. bibliometrix: An R-tool for comprehensive science mapping analysis. Journal of Informetrics 11 (4):959–75. doi: 10.1016/j.joi.2017.08.007.
- Armellini, B. R. C., A. La Luna, V. Bueris, A. P. de Almeida, A. M. Tamais, F. Krzyzanowski, V. S. H. Reiter, C. Lellis-Santos, and R. D. C. Ferreira. 2021. Comparison of hybrid learning and remote education in the implementation of the “Adopt a Microorganism” methodology. PLoS ONE 16 (11):e0248906. doi: 10.1371/journal.pone.0248906.
- Aspachs, O., R. Durante, A. Graziano, J. Mestres, M. Reynal-Querol, and J. G. Montalvo. 2021. Tracking the impact of COVID-19 on economic inequality at high frequency. PLoS ONE 16 (3):e0249121. doi: 10.1371/journal.pone.0249121.
- Azeez E P, A., D. P. Negi, A. Rani, and S. K. A P. 2021. The impact of COVID-19 on migrant women workers in India. Eurasian Geography and Economics 62 (1):93–112. doi: 10.1080/15387216.2020.1843513.
- Balike Dieudonne, Z. 2021. Mathematical model for the mitigation of the economic effects of the Covid-19 in the Democratic Republic of the Congo. PLoS ONE 16 (5):e0250775.
- Bassolas, A., S. Sousa, and V. Nicosia. 2021. Diffusion segregation and the disproportionate incidence of COVID-19 in African American communities. Journal of the Royal Society, Interface 18 (174):20200961. doi: 10.1098/rsif.2020.0961.
- Beck, M. J., D. A. Hensher, and E. Wei. 2020. Slowly coming out of COVID-19 restrictions in Australia: Implications for working from home and commuting trips by car and public transport. Journal of Transport Geography 88:102846. doi: 10.1016/j.jtrangeo.2020.102846.
- Benita, F., and F. Gasca-Sanchez. 2021. The main factors influencing COVID-19 spread and deaths in Mexico: A comparison between phases I and II. Applied Geography 134:102523. doi: 10.1016/j.apgeog.2021.102523.
- Brauner, J. M., S. Mindermann, M. Sharma, D. Johnston, J. Salvatier, T. Gavenčiak, A. B. Stephenson, G. Leech, G. Altman, V. Mikulik, et al. 2021. Inferring the effectiveness of government interventions against COVID-19. Science 371 (6531):eabd9338. doi: 10.1126/science.abd9338.
- Briz-Redon, A., and A. Serrano-Aroca. 2020. The effect of climate on the spread of the COVID-19 pandemic: A review of findings, and statistical and modelling techniques. Progress in Physical Geography: Earth and Environment 44 (5):591–604. doi: 10.1177/0309133320946302.
- Bryant, P., and A. Elofsson. 2020. Estimating the impact of mobility patterns on COVID-19 infection rates in 11 European countries. Peerj 8:e9879. doi: 10.7717/peerj.9879.
- Buja, A., M. Paganini, S. Cocchio, M. Scioni, V. Rebba, and V. Baldo. 2020. Demographic and socio-economic factors, and healthcare resource indicators associated with the rapid spread of COVID-19 in Northern Italy: An ecological study. PLoS ONE 15 (12):e0244535.
- Cacciapaglia, G., and F. Sannino. 2020. Interplay of social distancing and border restrictions for pandemics via the epidemic renormalisation group framework. Scientific Reports 10 (1):15828. doi: 10.1038/s41598-020-72175-4.
- Charoenwong, B., A. Kwan, and V. Pursiainen. 2020. Social connections with COVID-19-affected areas increase compliance with mobility restrictions. Science Advances 6 (47):eabc3054. doi: 10.1126/sciadv.abc3054.
- Che, L., H. Du, and K. W. Chan. 2020. Unequal pain: A sketch of the impact of the Covid-19 pandemic on migrants’ employment in China. Eurasian Geography and Economics 61 (4–5):448–63. doi: 10.1080/15387216.2020.1791726.
- Chen, X. L. 2020. Spaces of care and resistance in China: Public engagement during the COVID-19 outbreak. Eurasian Geography and Economics 61 (4–5):435–47. doi: 10.1080/15387216.2020.1762690.
- Cheng, I. K., J. Heyl, N. Lad, G. Facini, and Z. Grout. 2021. Evaluation of Twitter data for an emerging crisis: An application to the first wave of COVID-19 in the UK. Scientific Reports 11 (1):19009. doi: 10.1038/s41598-021-98396-9.
- Cheng, Y. Y., J. G. Zhang, W. Wei, and B. Zhao. 2021. Effects of urban parks on residents’ expressed happiness before and during the COVID-19 pandemic. Landscape and Urban Planning 212:104118. doi: 10.1016/j.landurbplan.2021.104118.
- Chiba, A. 2021. Modeling the effects of contact-tracing apps on the spread of the coronavirus disease: Mechanisms, conditions, and efficiency. PLoS ONE 16 (9):e0256151. doi: 10.1371/journal.pone.0256151.
- Choi, I., J. H. Kim, N. Kim, E. Choi, J. Choi, H. W. Suk, and J. Y. Na. 2021. How COVID-19 affected mental well-being: An 11-week trajectories of daily well-being of Koreans amidst COVID-19 by age, gender and region. PLoS ONE 16 (4):e0250252. doi: 10.1371/journal.pone.0250252.
- Connolly, R., P. Hanson, and M. Bradshaw. 2020. It’s deja vu all over again: COVID-19, the global energy market, and the Russian economy. Eurasian Geography and Economics 61 (4–5):511–31. doi: 10.1080/15387216.2020.1776627.
- Correa-Araneda, F., A. Ulloa-Yáñez, D. Núñez, L. Boyero, A. M. Tonin, A. Cornejo, M. A. Urbina, M. E. Díaz, G. Figueroa-Muñoz, and C. Esse. 2021. Environmental determinants of COVID-19 transmission across a wide climatic gradient in Chile. Scientific Reports 11 (1):9849. doi: 10.1038/s41598-021-89213-4.
- Cortes, C., and V. Vapnik. 1995. Support-vector networks. Machine Learning 20 (3):273–97. doi: 10.1007/BF00994018.
- Courtemanche, C., J. Garuccio, A. Le, J. Pinkston, and A. Yelowitz. 2021. Chance elections, social distancing restrictions, and Kentucky’s early COVID-19 experience. PLoS ONE 16 (7):e0250152.
- Cunningham, E., B. Smyth, and D. Greene. 2021. Collaboration in the time of COVID: A scientometric analysis of multidisciplinary SARS-CoV-2 research. Humanities and Social Sciences Communications 8 (1):240. doi: 10.1057/s41599-021-00922-7.
- Day, T., I. C. C. Chang, C. K. L. Chung, W. E. Doolittle, J. Housel, and P. N. McDaniel. 2021. The immediate impact of COVID-19 on postsecondary teaching and learning. The Professional Geographer 73 (1):1–13. doi: 10.1080/00330124.2020.1823864.
- Drefahl, S., M. Wallace, E. Mussino, S. Aradhya, M. Kolk, M. Branden, B. Malmberg, and G. Andersson. 2020. A population-based cohort study of socio-demographic risk factors for COVID-19 deaths in Sweden. Nature Communications 11 (1):5097. doi: 10.1038/s41467-020-18926-3.
- Eilersen, A., and K. Sneppen. 2020. Cost-benefit of limited isolation and testing in COVID-19 mitigation. Scientific Reports 10 (1):18543. doi: 10.1038/s41598-020-75640-2.
- Ellegaard, O., and J. A. Wallin. 2015. The bibliometric analysis of scholarly production: How great is the impact? Scientometrics 105 (3):1809–31. doi: 10.1007/s11192-015-1645-z.
- Engzell, P., A. Frey, and M. D. Verhagen. 2021. Learning loss due to school closures during the COVID-19 pandemic. Proceedings of the National Academy of Sciences 118 (17):e2022376118. doi: 10.1073/pnas.2022376118.
- Espinoza, B., C. Castillo-Chavez, and C. Perrings. 2020. Mobility restrictions for the control of epidemics: When do they work? PLoS ONE 15 (7):e0235731. doi: 10.1371/journal.pone.0235731.
- Esteve, A., I. Permanyer, D. Boertien, and J. W. Vaupel. 2020. National age and coresidence patterns shape COVID-19 vulnerability. Proceedings of the National Academy of Sciences of the United States of America 117 (28):16118–20. doi: 10.1073/pnas.2008764117.
- Florida, R., and C. Mellander. 2022. The geography of COVID-19 in Sweden. The Annals of Regional Science 68 (1):125–50. doi: 10.1007/s00168-021-01071-0.
- Forati, A. M., and R. Ghose. 2021. Geospatial analysis of misinformation in COVID-19 related tweets. Applied Geography 133:102473. doi: 10.1016/j.apgeog.2021.102473.
- Franch-Pardo, I., B. M. Napoletano, F. Rosete-Verges, and L. Billa. 2020. Spatial analysis and GIS in the study of COVID-19: A review. The Science of the Total Environment 739:140033. doi: 10.1016/j.scitotenv.2020.140033.
- Fyfe, J., V. Kharin, N. Swart, G. Flato, M. Sigmond, and N. Gillett. 2021. Quantifying the influence of short-term emission reductions on climate. Science Advances 7 (10):eabf7133. doi: 10.1126/sciadv.abf7133.
- Ganegoda, N. C., K. P. Wijaya, M. Amadi, K. Erandi, and D. Aldila. 2021. Interrelationship between daily COVID-19 cases and average temperature as well as relative humidity in Germany. Scientific Reports 11 (1):11302. doi: 10.1038/s41598-021-90873-5.
- Ganslmeier, M., D. Furceri, and J. D. Ostry. 2021. The impact of weather on COVID-19 pandemic. Scientific Reports 11 (1):22027. doi: 10.1038/s41598-021-01189-3.
- Glogowsky, U., E. Hansen, and S. Schachtele. 2021. How effective are social distancing policies? Evidence on the fight against COVID-19. PLoS ONE 16 (9):e0257363. doi: 10.1371/journal.pone.0257363.
- Gregory, D., R. Johnston, G. Pratt, M. Watts, and S. Whatmore. 2009. The dictionary of human geography. 5th ed. Malden, MA: Blackwell.
- Grekousis, G., R. Wang, and Y. Liu. 2021. Mapping the geodemographics of racial, economic, health, and COVID-19 deaths inequalities in the conterminous US. Applied Geography 135:102558.
- Hartvigsen, G. 2021. Network assessment and modeling the management of an epidemic on a college campus with testing, contact tracing, and masking. PLoS ONE 16 (9):e0257052. doi: 10.1371/journal.pone.0257052.
- Huang, X., J. Lu, S. Gao, S. Wang, Z. Liu, and H. Wei. 2022. Staying at home is a privilege: Evidence from fine-grained mobile phone location data in the United States during the COVID-19 pandemic. Annals of the American Association of Geographers 112 (1):286–305. doi: 10.1080/24694452.2021.1904819.
- Ibarra-Nava, I., K. G. Flores-Rodriguez, V. Ruiz-Herrera, H. C. Ochoa-Bayona, A. Salinas-Zertuche, M. Padilla-Orozco, and R. G. Salazar-Montalvo. 2021. Ethnic disparities in COVID-19 mortality in Mexico: A cross-sectional study based on national data. PLoS ONE 16 (3):e0239168. doi: 10.1371/journal.pone.0239168.
- Jankowiak, L., L. Rozsa, P. Tryjanowski, and A. P. Moller. 2020. A negative covariation between toxoplasmosis and CoVID-19 with alternative interpretations. Scientific Reports 10 (1):12512. doi: 10.1038/s41598-020-69351-x.
- Ji, B., Y. Zhao, T. Wei, and P. Kang. 2021. Water science under the global epidemic of COVID-19: Bibliometric tracking on COVID-19 publication and further research needs. Journal of Environmental Chemical Engineering 9 (4):105357. doi: 10.1016/j.jece.2021.105357.
- Jia, Z. Y., S. J. Xu, Z. C. Zhang, Z. Y. Cheng, H. Q. Han, H. X. Xu, M. T. Wang, H. Zhang, Y. Zhou, and Z. X. Zhou. 2021. Association between mental health and community support in lockdown communities during the COVID-19 pandemic: Evidence from rural China. Journal of Rural Studies 82:87–97. doi: 10.1016/j.jrurstud.2021.01.015.
- Joshi, Y. V., and A. Musalem. 2021. Lockdowns lose one third of their impact on mobility in a month. Scientific Reports 11 (1):22658. doi: 10.1038/s41598-021-02133-1.
- Katz, V. S., A. B. Jordan, and K. Ognyanova. 2021. Digital inequality, faculty communication, and remote learning experiences during the COVID-19 pandemic: A survey of US undergraduates. PLoS ONE 16 (2):e0246641. doi: 10.1371/journal.pone.0246641.
- Kerr, C. C., D. Mistry, R. M. Stuart, K. Rosenfeld, G. R. Hart, R. C. Núñez, J. A. Cohen, P. Selvaraj, R. G. Abeysuriya, M. Jastrzębski, et al. 2021. Controlling COVID-19 via test–trace–quarantine. Nature Communications 12 (1):2993. doi: 10.1038/s41467-021-23276-9.
- Kim, E., M. E. Shepherd, and J. D. Clinton. 2020. The effect of big-city news on rural America during the COVID-19 pandemic. Proceedings of the National Academy of Sciences of the United States of America 117 (36):22009–14. doi: 10.1073/pnas.2009384117.
- Kim, J., and M. P. Kwan. 2021. The impact of the COVID-19 pandemic on people’s mobility: A longitudinal study of the US from March to September of 2020. Journal of Transport Geography 93:103039. doi: 10.1016/j.jtrangeo.2021.103039.
- Kim, S., S. Lee, E. Ko, K. Jang, and J. Yeo. 2021. Changes in car and bus usage amid the COVID-19 pandemic: Relationship with land use and land price. Journal of Transport Geography 96:103168. doi: 10.1016/j.jtrangeo.2021.103168.
- Kishore, N., R. Kahn, P. P. Martinez, P. M. De Salazar, A. S. Mahmud, and C. O. Buckee. 2021. Lockdowns result in changes in human mobility which may impact the epidemiologic dynamics of SARS-CoV-2. Scientific Reports 11 (1):6995. doi: 10.1038/s41598-021-86297-w.
- Kizilcec, R. F., C. A. Makridis, and K. C. Sadowski. 2021. Pandemic response policies’ democratizing effects on online learning. Proceedings of the National Academy of Sciences 118 (11):e2026725118. doi: 10.1073/pnas.2026725118.
- Kost, G. J. 2020. Geospatial hotspots need point-of-care strategies to stop highly infectious outbreaks. Archives of Pathology & Laboratory Medicine 144 (10):1166–90. doi: 10.5858/arpa.2020-0172-RA.
- Kraemer, M. U. G., V. Hill, C. Ruis, S. Dellicour, S. Bajaj, J. T. McCrone, G. Baele, K. V. Parag, A. L. Battle, B. Gutierrez, et al. 2021. Spatiotemporal invasion dynamics of SARS-CoV-2 lineage B.1.1.7 emergence. Science 373 (6557):889–95. doi: 10.1126/science.abj0113.
- Kubota, Y., T. Shiono, B. Kusumoto, and J. Fujinuma. 2020. Multiple drivers of the COVID-19 spread: The roles of climate, international mobility, and region-specific conditions. PLoS ONE 15 (9):e0239385.
- Lee, M. H., J. Zhao, Q. Q. Sun, Y. X. Pan, W. Y. Zhou, C. F. Xiong, and L. Zhang. 2020. Human mobility trends during the early stage of the COVID-19 pandemic in the United States. PLoS ONE 15 (11):e0241468. doi: 10.1371/journal.pone.0241468.
- Li, T., J. E. Wang, J. Huang, W. Y. Yang, and Z. Chen. 2021. Exploring the dynamic impacts of COVID-19 on intercity travel in China. Journal of Transport Geography 95:103153. doi: 10.1016/j.jtrangeo.2021.103153.
- Lilleri, D., F. Zavaglio, E. Gabanti, G. Gerna, and E. Arbustini. 2020. Analysis of the SARS-CoV-2 epidemic in Italy: The role of local and interventional factors in the control of the epidemic. PLoS ONE 15 (11):e0242305. doi: 10.1371/journal.pone.0242305.
- Lim, Y. K., O. J. Kweon, H. R. Kim, T. H. Kim, and M. K. Lee. 2021. The impact of environmental variables on the spread of COVID-19 in the Republic of Korea. Scientific Reports 11 (1):5977. doi: 10.1038/s41598-021-85493-y.
- Liu, F. L., J. Wang, J. W. Liu, Y. Li, D. G. Liu, J. L. Tong, Z. Q. Li, D. Yu, Y. F. Fan, X. H. Bi, et al. 2020. Predicting and analyzing the COVID-19 epidemic in China: Based on SEIRD, LSTM and GWR models. PLoS ONE 15 (8):e0238280.
- Liu, Z., P. Ciais, Z. Deng, S. J. Davis, B. Zheng, Y. L. Wang, D. Cui, B. Q. Zhu, X. Y. Dou, P. Y. Ke, et al. 2020. Carbon Monitor, a near-real-time daily dataset of global CO2 emission from fossil fuel and cement production. Scientific Data 7 (1):392. doi: 10.1038/s41597-020-00708-7.
- Liu, Z., X. Lv, K. Liu, and S. Shi. 2010. Study on SVM compared with the other text classification methods. In 2010 Second international workshop on education technology and computer science, ed. Z Hu and Z. Ye, Vol. 1, 219–22. New York: IEEE. doi: 10.1109/ETCS.2010.248.
- Loganathan, T., Z. E. X. Chan, F. Hassan, W. Kunpeuk, R. Suphanchaimat, H. S. Yi, and H. A. Majid. 2021. Education for non-citizen children in Malaysia during the COVID-19 pandemic: A qualitative study. PLoS ONE 16 (12):e0259546. doi: 10.1371/journal.pone.0259546.
- Mansour, S., A. Abulibdeh, M. Alahmadi, A. Al-Said, A. Al-Said, G. Watmough, and P. M. Atkinson. 2022. Spatial associations between COVID-19 incidence rates and work sectors: Geospatial modeling of infection patterns among migrants in Oman. Annals of the American Association of Geographers 112 (7):1974–93. doi: 10.1080/24694452.2021.2015281.
- Mansour, S., A. Al Kindi, A. Al Said, A. Al-Said, and P. Atkinson. 2021. Sociodemographic determinants of COVID-19 incidence rates in Oman: Geospatial modelling using multiscale geographically weighted regression (MGWR). Sustainable Cities and Society 65:102627. doi: 10.1016/j.scs.2020.102627.
- Mavragani, A., and K. Gkillas. 2020. COVID-19 predictability in the United States using Google trends time series. Scientific Reports 10 (1):20693. doi: 10.1038/s41598-020-77275-9.
- McKenna-Plumley, P. E., L. Graham-Wisener, E. Berry, and J. M. Groarke. 2021. Connection, constraint, and coping: A qualitative study of experiences of loneliness during the COVID-19 lockdown in the UK. PLoS ONE 16 (10):e0258344.
- Meng, F., W. Gong, J. Liang, X. Li, Y. Zeng, and L. Yang. 2021. Impact of different control policies for COVID-19 outbreak on the air transportation industry: A comparison between China, the U.S. and Singapore. PLoS ONE 16 (3):e0248361. doi: 10.1371/journal.pone.0248361.
- Millar, J. A., H. D. N. Dao, M. E. Stefopulos, C. G. Estevam, K. Fagan-Garcia, D. H. Taft, C. Park, A. Alruwaily, A. N. Desai, and M. S. Majumder. 2021. Risk factors for increased COVID-19 case-fatality in the United States: A county-level analysis during the first wave. PLoS ONE 16 (10):e0258308. doi: 10.1371/journal.pone.0258308.
- Millefiori, L. M., P. Braca, D. Zissis, G. Spiliopoulos, S. Marano, P. K. Willett, and S. Carniel. 2021. COVID-19 impact on global maritime mobility. Scientific Reports 11 (1):18039. doi: 10.1038/s41598-021-97461-7.
- Misra, P., M. Takigawa, P. Khatri, S. K. Dhaka, A. P. Dimri, K. Yamaji, M. Kajino, W. Takeuchi, R. Imasu, K. Nitta, et al. 2021. Nitrogen oxides concentration and emission change detection during COVID-19 restrictions in North India. Scientific Reports 11 (1):9800. doi: 10.1038/s41598-021-87673-2.
- Mitze, T., and R. Kosfeld. 2022. The propagation effect of commuting to work in the spatial transmission of COVID-19. Journal of Geographical Systems 24 (1):5–31. doi: 10.1007/s10109-021-00349-3.
- Mollalo, A., B. Vahedi, and K. M. Rivera. 2020. GIS-based spatial modeling of COVID-19 incidence rate in the continental United States. The Science of the Total Environment 728:138884. doi: 10.1016/j.scitotenv.2020.138884.
- Morgan, A. K. 2020. Making COVID-19 prevention etiquette of social distancing a reality for the homeless and slum dwellers in Ghana: Lessons for consideration. Local Environment 25 (7):536–39. doi: 10.1080/13549839.2020.1789854.
- Mu, X. Y., A. G. O. Yeh, and X. H. Zhang. 2021. The interplay of spatial spread of COVID-19 and human mobility in the urban system of China during the Chinese New Year. Environment and Planning B: Urban Analytics and City Science 48 (7):1955–71. doi: 10.1177/2399808320954211.
- Nasir, A., K. Shaukat, I. A. Hameed, S. Luo, T. M. Alam, and F. Iqbal. 2020. A bibliometric analysis of Corona pandemic in social sciences: A review of influential aspects and conceptual structure. IEEE Access: Practical Innovations, Open Solutions 8:133377–402. doi: 10.1109/ACCESS.2020.3008733.
- Okabe-Miyamoto, K., D. Folk, S. Lyubomirsky, and E. W. Dunn. 2021. Changes in social connection during COVID-19 social distancing: It’s not (household) size that matters, it’s who you’re with. PLoS ONE 16 (1):e0245009. doi: 10.1371/journal.pone.0245009.
- Oyedotun, T. D. T., and S. Moonsammy. 2021. Spatiotemporal variation of COVID-19 and its spread in South America: A rapid assessment. Annals of the American Association of Geographers 111 (6):1868–79.
- Pan, D., J. Yang, G. Zhou, and F. Kong. 2020. The influence of COVID-19 on agricultural economy and emergency mitigation measures in China: A text mining analysis. PLoS ONE 15 (10):e0241167. doi: 10.1371/journal.pone.0241167.
- Peng, Y. M., P. P. Wu, A. T. Schartup, and Y. X. Zhang. 2021. Plastic waste release caused by COVID-19 and its fate in the global ocean. Proceedings of the National Academy of Sciences 118 (47):e2111530118. doi: 10.1073/pnas.2111530118.
- Piasecki, T., P. B. Mucha, and M. Rosińska. 2021. On limits of contact tracing in epidemic control. PLoS ONE 16 (8):e0256180. doi: 10.1371/journal.pone.0256180.
- Piccolomini, E. L., and F. Zama. 2020. Monitoring Italian COVID-19 spread by a forced SEIRD model. PLoS ONE 15 (8):e0237417. doi: 10.1371/journal.pone.0237417.
- Poulain, T., C. Meigen, C. Sobek, P. Ober, U. Igel, A. Korner, W. Kiess, and M. Vogel. 2021. Loss of childcare and classroom teaching during the Covid-19-related lockdown in spring 2020: A longitudinal study on consequences on leisure behavior and schoolwork at home. PLoS ONE 16 (3):e0247949. doi: 10.1371/journal.pone.0247949.
- Prieto Curiel, R., and H. Gonzalez Ramirez. 2021. Vaccination strategies against COVID-19 and the diffusion of anti-vaccination views. Scientific Reports 11 (1):6626. doi: 10.1038/s41598-021-85555-1.
- Sage, L., M. Albertini, and S. Scherer. 2021. The spreading of SARS-CoV-2: Interage contacts and networks degree distribution. PLoS ONE 16 (8):e0256036. doi: 10.1371/journal.pone.0256036.
- Saikia, U., M. M. Dodd, J. Chalmers, G. Dasvarma, and S. Schech. 2021. COVID-19, individual wellbeing and multi-dimensional poverty in the state of South Australia. PLoS ONE 16 (6):e0252898.
- Salton, G., and C. T. Yu. 1975. On the construction of effective vocabularies for information retrieval. ACM SIGPLAN Notices 10 (1):48–60. doi: 10.1145/951787.951766.
- Shakil, M. H., Z. H. Munim, M. Tasnia, and S. Sarowar. 2020. COVID-19 and the environment: A critical review and research agenda. The Science of the Total Environment 745:141022. doi: 10.1016/j.scitotenv.2020.141022.
- Shaman, J., P. Pietzonka, E. Brorson, W. Bankes, M. E. Cates, R. L. Jack, and R. Adhikari. 2021. Bayesian inference across multiple models suggests a strong increase in lethality of COVID-19 in late 2020 in the UK. PLoS ONE 16 (11):e0258968. doi: 10.1371/journal.pone.0258968.
- Shao, Z. F., Y. Tang, X. Huang, and D. R. Li. 2021. Monitoring work resumption of Wuhan in the COVID-19 epidemic using daily nighttime light. Photogrammetric Engineering and Remote Sensing 87 (3):197–206.
- Sigala, M. 2020. Tourism and COVID-19: Impacts and implications for advancing and resetting industry and research. Journal of Business Research 117:312–21. doi: 10.1016/j.jbusres.2020.06.015.
- Skórka, P., B. Grzywacz, D. Moroń, and M. Lenda. 2020. The macroecology of the COVID-19 pandemic in the Anthropocene. PLoS ONE 15 (7):e0236856. doi: 10.1371/journal.pone.0236856.
- Slezakova, K., and M. C. Pereira. 2021. 2020 COVID-19 lockdown and the impacts on air quality with emphasis on urban, suburban and rural zones. Scientific Reports 11 (1):21336. doi: 10.1038/s41598-021-99491-7.
- Somala, S. N. 2021. Lockdowns and their influence on Earth’s hum. Scientific Reports 11 (1):17838. doi: 10.1038/s41598-021-97459-1.
- Sonn, J. W., and J. K. Lee. 2020. The smart city as time-space cartographer in COVID-19 control: The South Korean strategy and democratic control of surveillance technology. Eurasian Geography and Economics 61 (4–5):482–92. doi: 10.1080/15387216.2020.1768423.
- Suart, C., T. N. Suart, K. Graham, and R. Truant. 2021. When the labs closed: Graduate students’ and postdoctoral fellows’ experiences of disrupted research during the COVID-19 pandemic. Facets 6:966–97. doi: 10.1139/facets-2020-0077.
- Tobler, W. R. 1970. A computer movie simulating urban growth in the Detroit region. Economic Geography 46 (Suppl. 1):234–40. doi: 10.2307/143141.
- Tripathi, M., S. Kumar, S. K. Sonker, and P. Babbar. 2018. Occurrence of author keywords and keywords plus in social sciences and humanities research: A preliminary study. COLLNET Journal of Scientometrics and Information Management 12 (2):215–32. doi: 10.1080/09737766.2018.1436951.
- van Zyl, T. L., and T. Celik. 2021. Did we produce more waste during the COVID-19 lockdowns? A remote sensing approach to landfill change analysis. IEEE Journal of Selected Topics in Applied Earth Observations and Remote Sensing 14:7349–58. doi: 10.1109/JSTARS.2021.3097446.
- Venter, Z. S., D. N. Barton, V. Gundersen, H. Figari, and M. S. Nowell. 2021. Back to nature: Norwegians sustain increased recreational use of urban green space months after the COVID-19 outbreak. Landscape and Urban Planning 214:104175. doi: 10.1016/j.landurbplan.2021.104175.
- Verma, S., and A. Gustafsson. 2020. Investigating the emerging COVID-19 research trends in the field of business and management: A bibliometric analysis approach. Journal of Business Research 118:253–61. doi: 10.1016/j.jbusres.2020.06.057.
- Verschuur, J., E. E. Koks, and J. W. Hall. 2021. Global economic impacts of COVID-19 lockdown measures stand out in high-frequency shipping data. PLoS ONE 16 (4):e0248818. doi: 10.1371/journal.pone.0248818.
- Wang, F. X., Z. Q. Tan, Z. H. Yu, S. Q. Yao, and C. F. Guo. 2021. Transmission and control pressure analysis of the COVID-19 epidemic situation using multisource spatio-temporal big data. PLoS ONE 16 (3):e0249145. doi: 10.1371/journal.pone.0249145.
- Wang, H. 2021. Why the Navajo Nation was hit so hard by coronavirus: Understanding the disproportionate impact of the COVID-19 pandemic. Applied Geography 134:102526. doi: 10.1016/j.apgeog.2021.102526.
- Wang, J. H., Y. C. Fan, J. Palacios, Y. C. Chai, N. Guetta-Jeanrenaud, N. Obradovich, C. H. Zhou, and S. Q. Zheng. 2022. Global evidence of expressed sentiment alterations during the COVID-19 pandemic. Nature Human Behaviour 6 (3):349–58. doi: 10.1038/s41562-022-01312-y.
- Wasdani, K. P., and A. Prasad. 2020. The impossibility of social distancing among the urban poor: The case of an Indian slum in the times of COVID-19. Local Environment 25 (5):414–18. doi: 10.1080/13549839.2020.1754375.
- Wells, K., M. Lurgi, B. Collins, B. Lucini, R. R. Kao, A. L. Lloyd, S. D. W. Frost, and M. B. Gravenor. 2020. Disease control across urban–rural gradients. Journal of the Royal Society, Interface 17 (173):20200775. doi: 10.1098/rsif.2020.0775.
- Willberg, E., O. Jarv, T. Vaisanen, and T. Toivonen. 2021. Escaping from cities during the COVID-19 crisis: Using mobile phone data to trace mobility in Finland. ISPRS International Journal of Geo-Information 10 (2):103. doi: 10.3390/ijgi10020103.
- Wong, D. W., and S. Y. Li. 2020. Spreading of COVID-19: Density matters. PLoS ONE 15 (12):e0242398. doi: 10.1371/journal.pone.0242398.
- Wu, F., G. Liu, N. Guo, Z. Li, and X. Deng. 2021. The impact of COVID-19 on China’s regional economies and industries. Journal of Geographical Sciences 31 (4):565–83. doi: 10.1007/s11442-021-1859-3.
- Wymant, C., L. Ferretti, D. Tsallis, M. Charalambides, L. Abeler-Dorner, D. Bonsall, R. Hinch, M. Kendall, L. Milsom, M. Ayres, et al. 2021. The epidemiological impact of the NHS COVID-19 app. Nature 594 (7863):408–12. doi: 10.1038/s41586-021-03606-z.
- Xue, B. W., and A. McMunn. 2021. Gender differences in unpaid care work and psychological distress in the UK Covid-19 lockdown. PLoS ONE 16 (3):e0247959. doi: 10.1371/journal.pone.0247959.
- Yang, T., Y. Liu, W. Deng, W. Zhao, and J. Deng. 2020. SARS-Cov-2 trajectory predictions and scenario simulations from a global perspective: A modelling study. Scientific Reports 10 (1):18319. doi: 10.1038/s41598-020-75332-x.
- Yu, Q., C. E. Salvador, I. Melani, M. K. Berg, E. W. Neblett, and S. Kitayama. 2021. Racial residential segregation and economic disparity jointly exacerbate COVID-19 fatality in large American cities. Annals of the New York Academy of Sciences 1494 (1):18–30. doi: 10.1111/nyas.14567.
- Zhai, W., M. Y. Liu, and Z. R. Peng. 2021. Social distancing and inequality in the United States amid COVID-19 outbreak. Environment and Planning A: Economy and Space 53 (1):3–5. doi: 10.1177/0308518X20932576.
- Zhai, W., and H. Yue. 2022. Economic resilience during COVID-19: An insight from permanent business closures. Environment and Planning A: Economy and Space 54 (2):219–21. doi: 10.1177/0308518X211055181.
- Zhang, W., T. Yoshida, and X. Tang. 2011. A comparative study of TF* IDF, LSI and multi-words for text classification. Expert Systems with Applications 38 (3):2758–65. doi: 10.1016/j.eswa.2010.08.066.
- Zhang, X., Z.-K. Zhang, W. Wang, D. Hou, J. Xu, X. Ye, and S. Li. 2021. Multiplex network reconstruction for the coupled spatial diffusion of infodemic and pandemic of COVID-19. International Journal of Digital Earth 14 (4):401–23. doi: 10.1080/17538947.2021.1888326.
- Zhang, Y. X., H. X. Bo, Z. Jiang, Y. Wang, Y. F. Fu, B. W. Cao, X. W. Wang, J. Q. Chen, and R. Li. 2021. Untangling the contributions of meteorological conditions and human mobility to tropospheric NO2 in Chinese mainland during the COVID-19 pandemic in early 2020. National Science Review 8 (11):nwab061. doi: 10.1093/nsr/nwab061.
- Zhu, A. X., G. Lu, J. Liu, C. Z. Qin, and C. Zhou. 2018. Spatial prediction based on Third Law of Geography. Annals of GIS 24 (4):225–40. doi: 10.1080/19475683.2018.1534890.
