
Abstract
The ideal of U.S. public education as “a great equalizer” remains unrealized across large swaths of the country. Young people in schools are at varying levels of educational advantage and disadvantage owing to wide gaps in learning opportunities and disparate access to high-quality curriculum. Unequal educational achievement has also been linked to inequities affecting some students before they enter school due to socioeconomic circumstances, prejudice, and discriminatory social systems and structures. In this study, we begin to partition the various factors that account for inequality in student outcomes in the context of U.S. geography education. Using large-scale data sets provided by the National Center for Education Statistics within the U.S. Department of Education, we developed a two-level statistical model to analyze the extent to which geography achievement in eighth grade varies systematically with contextual opportunity to learn (OTL) factors and the relative poverty level of neighborhoods around schools. Hierarchical linear modeling was used to account for data clustering, producing an achievement estimate for each predictor and controlling for the effects of all other predictors. Statistically significant OTL predictors included instructional exposure, taking geography prior to eighth grade, teaching experience, and the availability of computers in classrooms. Schools located in neighborhoods with higher income-to-poverty ratios outperformed schools in neighborhoods closer to the federal poverty threshold. Controlling for OTL and school neighborhood effects accounted for some of the geography achievement disadvantage associated with race and other student characteristics. Geographers can further explore these relationships with formal mediational models and educational programs based on equity-oriented frameworks.
“大均衡”是美国公立教育的理念。但是, 美国大部分地区仍未实现这一理念。因为学习机会和获得高质量课程机会的巨大差异, 学校里的年轻人拥有不同的教育优势和劣势。此外, 教育成绩的不平等, 还与学生入学前面临的社会经济环境、偏见、歧视性社会制度和结构的不平等有关。针对美国地理学教育, 我们对导致学生成绩不平等的各种因素进行了划分。利用美国教育部国家教育统计中心的大数据, 我们研制了一个二级统计模型。针对学习机会(OTL)的背景因素、学校周边社区的相对贫困水平, 我们分析了它们导致的八年级学生地理成绩的系统性差异。我们用分层线性模型对数据聚类进行解读, 估算了每个预测因子的成绩, 并控制了其它预测因子的影响。具有统计学意义的OTL预测因子包括:教育机会、八年级以前的地理课程、教学经验和计算机设备。位于收入—贫困比率高的社区的学校, 其学生成绩优于位于接近联邦贫困线的社区的学校。OTL和学校社区的影响, 诠释了与种族等学生特征有关的地理成绩劣势。地理学家可以进一步采用形式中介模型去探讨这些关系, 采用公平性框架去讨论教育部门。
El ideal de la educación pública americana, que la considera como “el gran igualador”, sigue sin realizarse en amplios espacios del país. Los jóvenes que están matriculados en las escuelas se encuentran en diferentes niveles de ventaja y desventaja, debido a las grandes brechas en las oportunidades de aprender y el acceso desigual a currículos de alta calidad. La desigualdad en el rendimiento escolar ha sido también asociada con las desigualdades que afectan a algunos estudiantes desde antes de su ingreso a la escuela, debido a circunstancias socioeconómicas, al prejuicio y a los sistemas y estructuras sociales discriminatorios. En este estudio, empezamos partiendo los diferentes factores vinculados causalmente con la desigualdad en el rendimiento de los estudiantes, dentro del contexto de la educación geográfica en los EE.UU. Mediante el uso de conjuntos de datos a gran escala, provistos por el Centro Nacional de Estadísticas Educativas del Departamento de Educación americano, desarrollamos un modelo estadístico de dos niveles para analizar en qué medida el rendimiento en geografía en octavo grado varía sistemáticamente con los factores contextuales de oportunidad de aprender (OTL) y el nivel de pobreza relativa de los vecindarios situados alrededor de las escuelas. Se usó un modelo lineal jerárquico para buscar una explicación a la agrupación de los datos, produciéndose un estimativo del rendimiento para cada uno de los predictores y ejerciendo control por los efectos de todos los demás predictores. Los predictores OTL estadísticamente significativos incluyeron la exposición a la instrucción, el haber cursado geografía antes del octavo grado, la experiencia docente y la disponibilidad de computadoras en las aulas. Las escuelas localizadas en vecindarios con una mayor relación entre ingresos y pobreza lograron mejores resultados que las escuelas ubicadas en los vecindarios más cercanos al umbral federal de la condición de pobreza. Con el control de los efectos de los OTL y del vecindario de la escuela se logró explicar parcialmente la desventaja en el rendimiento geográfico asociada con la raza y otras características de los estudiantes. Los geógrafos pueden explorar con mayor profundidad estas relaciones con los modelos de mediación formales y los programas educativos basados en marcos orientados a la equidad.
In this article, we present the results of a study conducted to identify factors that account for inequality in student outcomes at the eighth-grade level in U.S. geography education. Our research directly builds on an initial statistical analysis of geography achievement based on data provided by the National Assessment of Educational Progress (NAEP; Solem et al. Citation2021). That baseline study found roughly two thirds of the variability in geography achievement across the country was due to within-school differences in student performance. Unequal educational outcomes were consistently associated with student characteristics including gender, race, socioeconomic status (SES), disability, and minority language status. Geography achievement levels also varied between schools, yet performance differences were much less predictable on the basis of the type (private vs. public), regional location, and urbanicity of the schools in the NAEP sample.
The achievement estimates in our baseline study are generalizable to the nation’s population of eighth graders over two decades of considerable change in U.S. geography education (1994–2018). This period encompassed two editions of national geography standards (Geography Education Standards Project Citation1994; Heffron and Downs Citation2012); the addition of a human geography course in the College Board’s Advanced Placement (AP) program (Murphy Citation2000); the publication of the College, Career, and Civic Life (C3) Framework for Social Studies State Standards (National Council for the Social Studies [NCSS] Citation2013); the National Geographic Society’s sponsorship of the erstwhile state-based network of Geographic Alliances (McClure Citation2018); and the emergence of Web-based geographical information systems (GIS) as tools for teaching and learning in schools (Downs Citation2016).
Public policy interest in geography education appeared to crest in 2015 when the U.S. Government Accountability Office (GAO Citation2015) published a report that used NAEP data to show most of the nation’s eighth graders do not know enough geography to be considered proficient in the subject. The GAO’s report discussed the NAEP results for geography in relation to several challenges that complicate the provision of high-quality geography instruction in schools. One major challenge is the limited time to teach geography owing to the pressure faced by most schools to teach math, reading, and other subjects emphasized on high-stakes state exams. Requirements to teach geography also vary from state to state and at the school district level within many states. Other challenges include a shortage of geographically trained teachers, outdated computer technology and instructional materials, and perennially low levels of funding support for geography education. All of this adds up to systemic inequality in opportunity to learn (OTL) geography in U.S. schools.
The GAO did not attempt to measure the relative impact of different OTL factors on geography achievement. To address this, we acquired a license for raw, restricted-use NAEP data files that contain the assessment results and contextual data about the students, teachers, and schools participating in the assessment. Like much of the existing NAEP research literature, our study uses OTL as a conceptual framework for understanding and interpreting variability in large-scale educational assessment data. For example, social studies education researchers have found instructional exposure to be predictive of student achievement on NAEP U.S. History after controlling for student SES (Heafner and Fitchett Citation2015). Others have found course type (e.g., on-level, AP, honors) to be a predictive indicator of student achievement on NAEP Economics (Walstad and Buckles Citation2008; Walstad Citation2013; Heafner, VanFossen, and Fitchett Citation2019). Controlling for OTL in these and similar NAEP studies accounted for some of the achievement gaps between White and non-Asian minority youth as well as outcome inequalities associated with gender, students who are classified as English language learners (ELL), and students with a disability that qualifies them for learning accommodations under an individualized education plan (IEP).
The causes of educational inequality have also been researched from the perspective of the social and economic sciences. A considerable amount of attention has been given to the role of residential segregation (e.g., Johnson Citation2014; Zhang and Ruther Citation2021), social stratification (e.g., Reardon Citation2016), SES (e.g., Hanushek et al. Citation2019), and early childhood and family experiences (e.g., Bassok and Loeb Citation2014) in perpetuating educational divides between student groups. Researchers have also examined student achievement in the context of the local social and cultural environments around schools (Meusburger Citation2015; Brock Citation2016).
In this study, we innovate methodologically on existing literature examining the educational, social, and economic factors associated with unequal educational opportunity and outcomes. Our research considerably expands the scope taken in prior NAEP studies by exploring the predictive significance of a wider array of OTL factors in a series of multilevel models for a single subject assessment. Working with NAEP’s large-scale assessment data enabled us to address factors associated with student outcomes beyond a single school district or metropolitan area. Our study also adds a geographic dimension to the analysis of relationships between SES and school performance.
NAEP data include surrogate SES variables such as a student’s eligibility for free or reduced-price lunch and the number of books in a student’s home. Some researchers have argued these surrogate variables are less valid than household income and other SES indicators (Harwell and LeBeau Citation2010). We addressed this concern by merging the school sample for NAEP Geography with a large-scale data set containing direct point estimates of poverty levels in the neighborhoods around the schools. This method enabled us to estimate the significance of neighborhood poverty as a predictor of school performance, conditional on other OTL and SES predictors in our models.
To advance knowledge of the factors responsible for varying levels of geography achievement in lower secondary education, we further developed our baseline two-level predictive model to include explanatory variables related to OTL and school neighborhood poverty. Three questions specify the aims of our research:
How is geography achievement in eighth grade associated with student-level and teacher- and school-level OTL factors?
How is geography achievement in eighth grade associated with the relative poverty level of school neighborhoods?
To what extent does student-level outcome variance remain after controlling for OTL and school neighborhood effects?
Theoretical Background
As an educational assessment based on psychometric theory and methods, the NAEP program measures the amount of geography a student likely knows, the depth of a student’s understanding of the subject, and how capably a student can apply geography knowledge and skills for problem solving. Student performance on the NAEP Geography assessment is reported on a scale of 0 to 500 with scores typically ranging from 220 to 300, representing the 10th and 90th percentiles, respectively. NAEP Geography is a norm-referenced assessment with a mean of 250 and standard deviation of 50 (National Center for Education Statistics [NCES] Citation2022). A score of 282 or higher signifies a student has achieved at the NAEP-Proficient level, which is a marker of strong competency over challenging subject matter.Footnote1
The GeoCapabilities project’s three scenarios for the future of geography education offer a useful heuristic for interpreting NAEP scores in OTL context (Lambert, Solem, and Tani Citation2015; Bustin Citation2019). A Future 1 “traditional” curriculum is characterized by the delivery of a given and inert selection of geographic content knowledge, whereas a Future 2 “progressive” curriculum treats knowledge as arbitrary and incidental to the process of learning skills and technical competencies. Pedagogically, Future 1 tends to emphasize rote memorization and recall of geographic information and facts, whereas Future 2 entails highly socialized learning experiences often involving geography games, role playing, exploration, collaborative projects, and training in the use of various types of software and technologies. In both scenarios, students are likely to gain only a shallow and incomplete understanding of geography, which we would expect to result in lower NAEP scores.
Seeking to reconcile these polarities, the GeoCapabilities project advanced a conceptual argument for a “Future 3” curriculum based on the idea of powerful knowledge. The aim of Future 3 is for students to acquire substantive, conceptual, and procedural knowledge necessary for deeper comprehension of geography topics and thinking geographically at a high level of proficiency. Future 3 is often supported by high-quality, youth-centered teaching that connects powerful knowledge to students’ lived experiences and engages students in authentic geographic practices (Enser Citation2021). We would therefore expect to see higher NAEP scores associated with students learning geography in Future 3 scenarios.
Considering the many challenges identified in the GAO study of U.S. geography education, we further hypothesize that student outcomes will vary systematically in relation to curriculum requirements, teacher quality, and the availability and functional utility of computers and other technologies that support learning. Additionally, we expect school performance levels in geography to vary in relation to the poverty level of school neighborhoods. Neighborhood poverty and economic segregation have been shown to exacerbate local disparities in the amount of resources schools receive to improve teacher quality, campus environments, extracurricular programs, and school facilities (Schneider Citation2002; Maxwell and Schechtman Citation2012; Johnson Citation2014; Maxwell Citation2016; Eitland et al. Citation2017).
As a by-product of controlling for OTL and school neighborhood effects, we expect to account for some of the geography achievement disadvantages we estimated for different student groups in our baseline study. We continue this article by describing the method used to incorporate and analyze the explanatory variables of interest. Because of the number and variety of predictor variables in each NAEP Geography assessment, we focused this study only on the most recent assessment in 2018.
Data and Methods
NAEP samples are representative of the geographic, racial and ethnic, and socioeconomic diversity of the United States (U.S. Department of Education Citation2022). The NCES oversees NAEP data collection to ensure the highest levels of consistency, accuracy, and fairness. Additional oversight is provided by the NAEP Validity Studies panels organized by the American Institutes of Research.Footnote2
The 2018 NAEP Geography assessment was taken by a nationally representative sample of 12,900 eighth graders from 780 schools. The sample included 1,840 teachers. Students and schools were selected at random, and participation was voluntary. Each student was given two blocks of cognitive assessment questions featuring a variety of item types such as multiple-choice and constructed response items. Students also completed a contextual survey with questions common to all NAEP assessments (e.g., student demographics) and questions specific to geography education. The examination lasted seventy-five minutes. Following the assessment, item-response theory procedures were used by the assessment analysts to generate multiple plausible values (PVs) for each student’s performance on the overall assessment as well as on each specific content area represented in the assessment.
NAEP questionnaires for students, teachers, and schools are validated through a process that includes reviews by external advisory groups and field testing. The OTL variables we examined for this study derive from the responses to these questionnaires. Examples of student-reported data include how frequently students go on field trips to study geography topics; read and conduct research about geography; use computers and digital devices to create multimedia presentations about geography; and participate in discussions and debates about geographic issues, among many other variables. Teacher- and school-reported data include various indicators of teacher quality (e.g., years of teaching experience, teaching credentials, undergraduate major), the availability of professional development and training to improve geography instruction, the organization of geography curriculum (e.g., as discrete courses vs. integrated courses), and the grade levels at which geography is offered in schools.
In addition to the restricted-use NAEP data file, we acquired a federal data set containing school neighborhood poverty estimates from the NCES Education Demographic and Geographic Estimates (EDGE) program. The EDGE program’s estimates are based on spatially interpolated statistical models that extract new value from existing sources of poverty data, thereby providing a direct estimate of neighborhood poverty around specific locations (Geverdt and Nixon Citation2018). According to EDGE technical documentation:
School neighborhood poverty estimates are based on income data from families with children ages 5 to 18 who were surveyed over a five-year period as part of the U.S. Census Bureau’s American Community Survey (ACS). The ACS is a continuous household survey that collects social, demographic, economic, and housing information from the population in the United States each month. The estimates reflect the income-to-poverty ratio (IPR), which is the percentage of family income that is above or below the federal poverty threshold set for the family’s size and structure. The IPR indicator ranges from 0 to 999. Lower IPR values indicate a greater degree of poverty. A family with income at the poverty threshold has an IPR value of 100. (Geverdt Citation2018, 1–2)
In practice, researchers tend to incorporate OTL variables into HLMs by first leveraging the intercorrelation among the many specific variables to create a smaller number of composite factors (Diket Citation2001; Heafner and Fitchett Citation2015) or principal components (Harbour Citation2015) that each represent thematically unitary constructs. When appropriate, we followed this precedent by using factor analysis to arrive at composite quantitative factor scores for level 1 (student) and level 2 (teacher and school) OTL variables in the NAEP Geography data set, including those related to multimodal or differentiated instruction, text-dependent instruction, student use of technology resources, classroom emphasis on content areas, assessment variety, and teacher responsiveness to the learning needs of individual students.
The inclusion of OTL predictors was complicated by issues of missing data. Because of the difficulties of estimating and combining PV models in multilevel context with large numbers of random effects, and given the large sample size available, several series of models were estimated using listwise deletion. Records were kept of every predictor variable that was ever statistically significant at the p ≤ 0.05 level, and of how each predictor affected the available sample size; due to nesting, missing data at Level 2 (teacher and school) could have a variable effect on the number of lost observations at Level 1 (student). A manual backwards elimination procedure was initiated, beginning with this entire set of ever-significant predictors. A p value of 0.05 was the criterion for predictor retention. Nonsignificant predictors were removed one at a time, and the Level 1 and Level 2 sample sizes were noted at each iteration of the model. As the analytic sample size increased with each eliminated predictor, previously eliminated predictors were reentered periodically one at a time to test again for significance. The goal was to arrive at a final model that accounted for as much outcome variance as possible while still utilizing most of the available sample. present descriptive statistics for all potential predictor variables at Level 1 and Level 2.Footnote4
Table 1. 2018 National Assessment of Education Progress (NAEP) Geography descriptive statistics for all student-level (Level 1) predictors
Table 2. 2018 National Assessment of Educational Progress (NAEP) Geography descriptive statistics for all dichotomous Level 2 predictors derived from the teacher questionnaire
Table 3. 2018 National Assessment of Educational Progress (NAEP) Geography descriptive statistics for ordinal and continuous Level 2 predictors derived from the teacher questionnaire
Table 4. 2018 National Assessment of Educational Progress (NAEP) Geography descriptive statistics for all Level 2 predictors derived from the school questionnaire and Education Demographic and Geographic Estimates (EDGE) school neighborhood income-to-poverty ratio (IPR) estimates data file
Results
In this section, we first present the achievement estimates for the retained Level 1 and 2 predictors from our baseline study of the 2018 NAEP Geography assessment. From there we report the effects of the newly added OTL and school neighborhood IPR predictors. We conclude this section by describing the extent to which the initial, retained student-level predictor effects remain after controlling for OTL and school neighborhood effects. We focused on changes in regression coefficients associated with race, gender, and other student-level characteristics that consistently predicted achievement gaps since the first NAEP Geography assessment in 1994.
In the models that follow, the reported regression coefficients are unstandardized effects of each predictor on the theta-scale achievement outcome. In the context of the theta scale (M = 0, SD = 1) outcome variable, coefficients are interpreted per the predictor variable type: continuous, ordinal, or dichotomous. A regression coefficient for a continuous variable represents the estimated outcome change in standard deviation units per one-unit change in the predictor variable, holding all other predictors constant. Many of the continuous predictors are factor scores from principal axis factor analyses; they represent two or more original variables that are conceptually related measures of a construct. These predictors have means of approximately 0 and standard deviations ranging from 0.73 to 0.97. A one-unit change in one of these predictors therefore represents a change of greater than one standard deviation. Coefficients for these predictors therefore typically represent the expected change in standard deviations of achievement per greater than one standard deviation change in the factor score. Ordinal predictors are individual variables based on a Likert-type or similar ordinal response scale, with coefficients interpreted as the estimated difference in standard deviations of achievement per change in response category of the predictor, holding other predictors constant. Finally, regression coefficients for dichotomous predictor variables represent estimated mean differences in theta units between the reference group and the group that is the focus of the predictor, controlling for other predictors.
2018 NAEP Geography Baseline Model Estimates
presents the variable specifications for the retained predictors at Level 1 (student) and Level 2 (school) from the baseline two-level statistical model. present the geography achievement estimates for the retained Level 1 and Level 2 predictors, respectively. The coefficient for each retained predictor is an estimated net effect conditional on all Level 1 and Level 2 predictors. These results are discussed in our baseline study’s report (Solem et al. Citation2021).
Figure 1 Baseline model (A) Level 1 and (B) Level 2 predictors of geography achievement in the United States, 2018, based on an analytic sample size of 650 schools, 1,560 teachers, and 10,830 students. Note: Effect sizes are conditional on all retained Level 1 and 2 predictors. ELL = English language learner; IEP = individualized education plan; FRLE = free and reduced-price lunch eligibility. *p < 0.05. **p < 0.01. ***p < 0.001. Source: U.S. Department of Education, National Center for Education Statistics, National Assessment of Educational Progress (NAEP) Geography, 2018.
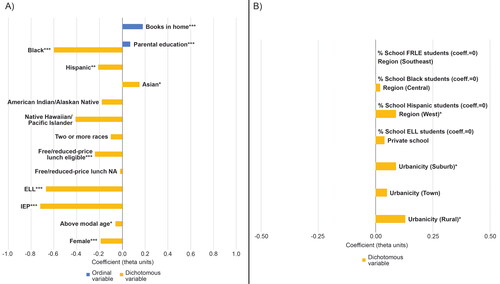
Table 5. Specifications for retained National Assessment of Educational Progress (NAEP) Geography predictor variables, 2018
2018 NAEP Geography OTL Models with School Neighborhood Poverty Estimates
For these models, we report results for the school neighborhood poverty variable as well as OTL variables that were statistically significant predictors of geography achievement. At Level 1, statistically significant OTL variables were: student took geography class or course prior to eighth grade; learning activities focused on (1) geographic practices, (2) spending time studying geography topics, and (3) multimodal process-oriented instruction; days absent in the last month; and the number of classes during which students used computer technology. At Level 2, statistically significant OTL variables were functionality and speed of school computers and technology; years of social studies teaching experience (Grades 6–12); teachers’ beliefs about why students test well in social studies; schools that offer professional development to improve social studies instruction; and schools that offer professional development to improve reading and writing instruction. and present the variable specifications for the newly added predictors at Level 1 and Level 2.
Table 6. Specifications for National Assessment of Educational Progress (NAEP) Geography Level 1 opportunity to learn (OTL) predictor variables (statistically significant only), 2018
Table 7. Specifications for National Assessment of Educational Progress (NAEP) Geography Level 2 opportunity to learn (OTL) predictor variables (statistically significant only), 2018
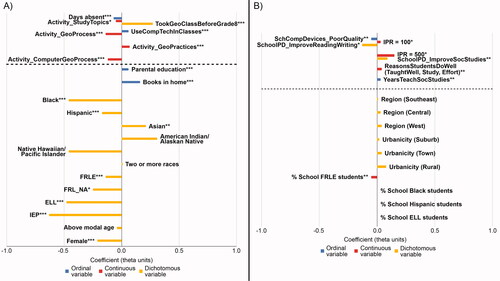
Student-Level OTL Predictors. presents our estimates of geography achievement associated with student-level variance in opportunity to learn. The reported regression coefficients are conditional on all level 1 (student) and level 2 (teacher and school) predictors (retained initial model predictors + newly added OTL and school neighborhood IPR predictors).
Figure 2 Expanded model (A) Level 1 and (B) Level 2 predictors of geography achievement in the United States, 2018, based on analytic sample size of 340 schools, 980 teachers, and 6,620 students. Note: Effect sizes are conditional on all retained and newly added Level 1 and 2 predictors. Newly added predictor variables appear above the dashed line. FRLE = free and reduced-price lunch eligibility; ELL = English language learner; IEP = individualized education plan; IPR = income-to-poverty ratio. *p < 0.05. **p < 0.01. ***p < 0.001. Source: U.S. Department of Education, National Center for Education Statistics, National Assessment of Educational Progress (NAEP) Geography, 2018.
Grade-Level Exposure to Geography Curriculum. Geography achievement was associated with early exposure to geography in the middle school curriculum. Students who took a geography class or course before eighth grade scored about 0.27 standard deviations higher on NAEP Geography on average, compared with students who did not take a geography class or course prior to eighth grade.
Exposure to Geography Instruction. Varying levels of geography achievement were associated with the types of geography learning activities that students performed during the school year. Higher achievement was linked to activities that engage students in geographic practices such as analyzing human–environment interaction and the movement of people and resources. Each unit increase in factor scores reflecting how often students reported doing these activities results in an increase in NAEP Geography scores of about 0.07 standard deviations on average.
There was a negative association with geography achievement and how much time students reported studying environmental issues, natural resources, countries and cultures, and the use of physical or digital maps in their social studies class. Each unit increase in the factor score reflecting how frequently students study these topics results in a decrease in NAEP Geography scores of about 0.05 standard deviations on average.
Geography achievement was also lower among students who were overexposed to process-oriented geography instruction during the school year. Exposure to process-oriented instruction is a factor score composite measure of how often students went on field trips to learn about geography topics, gave class presentations about geography topics, wrote opinions about geographic problems or issues, or participated in an environmental debate or panel discussion. Each unit increase in exposure to process-oriented geography instruction results in a decrease in NAEP Geography scores of about 0.14 standard deviations on average.
Similarly, geography achievement was lower among students who were overexposed to computer-mediated, process-oriented instruction as part of their social studies schoolwork or homework, as measured by how often students used computers or other digital devices to play games or use apps for role playing; organize information about geography topics by creating tables, charts, or graphs; create reports or projects about geography using multimedia; participate in online discussions about geography; or use the Internet to look for evidence or sources. Each unit increase in the factor score representing how often students reported doing these activities results in a decrease in NAEP Geography scores of about 0.12 standard deviations on average.
Absenteeism. Geography achievement was inversely related to the number of days students reported being absent from school in the last month. For this ordinal predictor, a unit change corresponds to a larger number of days a student was absent from school. Each unit increase in absenteeism results in about a 0.07 standard deviation decrease in geography achievement on average; students who were absent more than ten days scored about 0.28 standard deviations lower on average than students with no self-reported absenteeism, net of other predictors in the model.
Using Computers and Tablets in Classes. Geography achievement was associated with the use of computer technology (desktops or tablets) during classes taken in school. For this variable, each unit change represents a categorical increase in the number of classes in which students used computer technology. Each unit change in this predictor results in about a 0.06 standard deviation improvement in geography achievement on average; students who reported using computer technology in all or almost all of their classes scored about 0.24 standard deviations higher on average than students who reported no uses of computer technology in their classes.
Teacher- and School-Level OTL and Neighborhood IPR Predictors. presents our estimates of geography achievement associated with teacher- and school-level variance in opportunity to learn. This model level also includes the estimated IPR ratios for school neighborhoods as a predictor variable. Reported regression coefficients are conditional on all level 1 (student) and level 2 (teacher and school) predictors (retained initial model predictors + newly added OTL and school neighborhood IPR predictors).
Functionality of School Computers and Digital Devices. This ordinal teacher-level variable is a composite measure of the working condition and speed of desktop computers, laptop computers, and tablets in schools. A unit change for this predictor represents a downgrade in the functionality of school technologies as reported by teachers. Each unit change in this predictor results in about a 0.05 standard deviation decrease in geography achievement on average; in schools where some of the computer technology did not work, geography achievement was about 0.15 standard deviations lower on average relative to schools with fully functional equipment.
Years of Teaching Social Studies in Grades 6 through 12. Geography achievement is associated with the number of years a teacher has taught social studies at the secondary level. For this ordinal predictor, a unit change represents an accumulation of experience as a social studies teacher. Each unit change in social studies teaching experience results in an improvement in geography achievement of about 0.03 standard deviations on average. Teachers with more than twenty years of experience are associated with geography scores that are 0.15 standard deviations higher than the scores associated with teachers with less than one year of experience.
Teachers’ Beliefs about Student Success in Social Studies. This variable is a measure of teachers’ perceptions of students who did well on their last social studies test. Specifically, the factor score measures the perceived likelihood that students performed well on the test because they studied, put in effort, and were taught well. A unit change in this predictor represents an increase in how likely those reasons explained student test performance according to the teachers. Each unit change results in about a 0.04 standard deviation improvement in geography achievement on average.
Professional Development. Two school-level dichotomous predictors measured the availability of teacher professional development programs in schools. Geography achievement was about 0.09 standard deviations higher on average for schools that offer professional development to improve social studies instruction, compared with schools where this professional development was not available. In contrast, geography achievement was about 0.13 standard deviations lower for schools that offer professional development to improve the teaching of reading and writing skills, compared with schools not offering this professional development.
School Neighborhood IPRs. The school neighborhood poverty predictor was statistically significant after controlling for OTL and all other student- and school-level predictors, with a predicted net effect of 0.0003 per one-unit change in value. This result indicates schools located in wealthier neighborhoods performed better on NAEP Geography than schools located in neighborhoods with greater levels of poverty, conditional on all other covariates. To illustrate, schools associated with an IPR value of 500 scored about 0.12 standard deviations higher on NAEP Geography compared with schools located in neighborhoods at the federal poverty threshold (IPR = 100): (500 – 100) * 0.0003 = 0.12.
Change in Baseline Student-Level Achievement Estimates. Controlling for OTL and school neighborhood poverty effects partially accounted for student-level outcome variance (). In the OTL and IPR models, compared with White students, Black students scored about 0.47 standard deviations lower on average and Hispanic students scored about 0.18 standard deviations lower on average. These results represent reduced estimates of the geography achievement disadvantage of Black and Hispanic students of about 0.14 and 0.03 standard deviations, respectively. There was only a slight change in effect associated with female students relative to male students. The result for Asian students represents an increased estimate of geography achievement advantage of about 0.05 standard deviations on average. Above modal age lost significance as a predictor.
Figure 3 Net change in student-level effects after controlling for OTL and school neighborhood poverty. Note: ELL = English language learner; IEP = individualized education plan. *p < 0.05. **p < 0.01. ***p < 0.001. Source: U.S. Department of Education, National Center for Education Statistics, National Assessment of Educational Progress (NAEP) Geography, 2018.
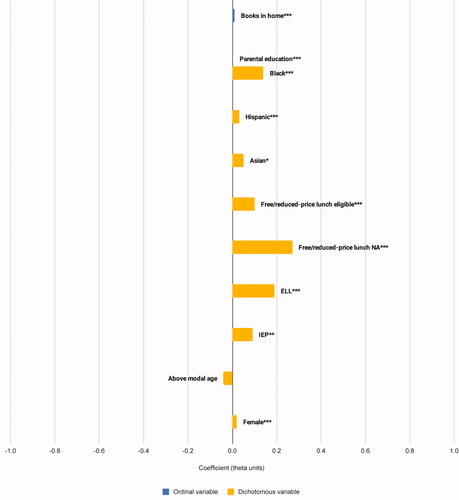
Controlling for OTL and school neighborhood effects also partially accounted for the geography achievement gaps associated with a student’s ELL status, eligibility for free or reduced-price lunch (FRLE), and IEP status. Relative to their respective comparison group, ELL students scored about 0.48 standard deviations lower on average; FRLE students scored about 0.14 standard deviations lower on average; and IEP students scored about 0.63 standard deviations lower on average. These results represent reduced estimates of the geography achievement disadvantage of ELL students by about 0.19 standard deviations on average; a reduction in estimated achievement disadvantage of FRLE students by about 0.1 standard deviations on average; and a reduction in estimated achievement disadvantage of IEP students by about 0.09 standard deviations on average.
Discussion
In this study, we identified factors accounting for within-school and between-school performance differences in U.S. geography education. A noteworthy limitation of the study is the loss of sample size associated with the incorporation of OTL variables into the original baseline student- and school-level model of geography achievement. Because of missing data, the results of the study are not generalizable to a national target population and therefore should be interpreted here as suggestive of national patterns. The results are nonetheless an important step toward a comprehensive explanation of the causes of student outcome inequality in U.S. geography education. In the following paragraphs, we discuss the results of our model estimations at both levels and how they can be applied to strengthen the effectiveness of geography educational programs. We also discuss the need for geographic research aimed at reducing inequality in student outcomes in geography and other school subjects.
Student-Level Variance in Opportunity to Learn
Consistent with our hypotheses, geography achievement varied in relation to students’ exposure to geography curriculum and instruction during middle school. Taking geography prior to eighth grade appears to provide students with foundational knowledge and skills that benefit their geography educational outcomes at the end of lower secondary education. In terms of a policy recommendation, this result underscores the importance for states and school districts to add geography requirements as a means of increasing the geography competence of students before they begin high school.
Unfortunately, it appears that the nation is heading in the opposite direction. According to the most recent social studies survey conducted by the Grosvenor Center for Geographic Education (Zadrozny Citation2021), since 2009–2010 there has been a large reduction in the number of states requiring geography in middle schools either as a stand-alone course or as a combined social studies course. Reversing this trend will not be easy. As Downs (Citation2016) noted, the school curriculum is a zero-sum game, and any change in favor of one subject will require another subject to give up some of its space.
The results of this study verify key rationales of the GeoCapabilities project. Geography achievement was lower among students who reported spending a lot of time studying the use of maps, countries and cultures, environmental issues, and natural resources in their social studies class. Because these topics are common themes in geography education, this result might seem puzzling. The focus of this variable, however, is on how much students study these topics. Spending a lot of time studying (a standard deviation or more above the norm) implies that students are committing time to learning facts and information about geography, but not much else—hallmarks of a Future 1 curriculum model. The negative effect associated with this predictor is evidence that too much time spent studying limits an opportunity for students to learn how to think and reason with geographic concepts and apply what they learn to solve problems—capabilities that are precisely what would be expected of students who score higher on the NAEP Geography scale.
We also estimated lower levels of achievement associated with overexposure to process-oriented learning activities delivered through various modalities, including field trips, map making, role playing, and creating multimedia presentations. This result is consistent with other social studies research findings (Heafner and Fitchett Citation2015). Although process-oriented instruction is not inherently ineffective as a means of learning geography, too much of it (a standard deviation or more above the norm) implies a Future 2 curriculum that reduces deep engagements with geography’s powerful knowledge and thus the lower NAEP scores.
We estimated higher levels of achievement for students who were frequently taught how to practice geography while studying geography topics, such as by analyzing human–environment interaction and the processes that shape physical and human systems and patterns on Earth’s surface. These practices represent essential ingredients of effective Future 3 geography curriculum. Less clear from the NAEP data is what this entailed locally in classrooms as far as the nature and substance of the applied geography content. This is an important matter that calls for deeper consideration and critical study of U.S. geography curriculum.
In advocating for Future 3, the GeoCapabilities project noted the associated challenge of making geography’s powerful knowledge accessible for youth of all backgrounds. Indeed, the results of this study imply geography remains inaccessible for some groups of learners. Even in schools where geography exists in the curriculum, the student-level outcome variance that remained unaccounted for in this quantitative study leaves open the possibility that minority youth perceive the subject to be profoundly disconnected from their lives and see little value in learning it. To address this, we recommend research and the development of educational programs that apply ideas from recent writings by geographers calling for decolonized curriculum (Moore Citation2020; Puttick and Murrey Citation2020; Alderman Citation2021). Expanding the epistemic contributions to what geography education entails can be done by intentionally organizing research–practice partnerships in school districts serving minority youth and codeveloping those partnerships with individuals and communities that have been adversely affected by racism and unfavorable socioeconomic circumstances (Dony, Solem, and Nara Citation2022).
By centering voices and experiences that have previously been erased and silenced, Future 3 geography curriculum can become more relevant and responsive to the aspirations and geographies of diverse youth. With rare exceptions (Monk Citation1997; Monk et al. Citation2000), fostering racial and gender equity in curriculum has not been the focus of major initiatives in U.S. geography education over the history of the NAEP Geography assessment. For an academic discipline that has long struggled to grow and diversify its student and professional body, equity-oriented research and decolonial educational practices could well advance educational progress at all levels of geography education.
Teacher- and School-Level Variance in Opportunity to Learn
Recognizing the worldwide diversity of geography education systems, the GeoCapabilities project did not propose a universal solution for how Future 3 curriculum might be conceived and enacted in practice. The project did emphasize the crucial role of teachers and the imperative of developing teachers as knowledge leaders who regularly interact with the geography discipline and teach geography’s powerful knowledge by making pedagogical choices that account for their students. We turn now to a detailed discussion of the importance of teacher quality and the school learning environment for more proficient geography achievement.
Teaching experience, and specifically how long a secondary schoolteacher has taught social studies, is an indicator of teacher quality that was associated positively with geography achievement. As teachers gain experience as social studies educators, they not only learn from personal observation but also remain eligible to pursue specialized professional development and trainings that update their knowledge and teaching skills (Rueschhoff and Palma Citation2021).
Teacher quality is especially crucial for applying the findings of this study to future reforms in U.S. geography education. To be successful, those reforms must be attuned to the fact that teachers’ curriculum-making practices are mediated by local realities and the educational contexts of their states and school districts (Anderson and Stillman Citation2013). Teachers must possess the subject matter expertise necessary to understand and implement the content messages of state and district-level curriculum standards (Hill Citation2001; Polikoff Citation2013).
Although few teachers have an undergraduate or graduate degree in geography, a geography degree was not a significant predictor of achievement in our study. This result replicates an earlier NAEP study that found no relationship between geography achievement levels and teachers with a geography degree (Savage Citation2019). A more significant factor affecting school excellence in geography education was the availability of in-service professional development trainings, courses, and workshops to improve social studies instruction. School performance levels were also higher when teachers believed student success in social studies classrooms was a result of effective instruction and students who dedicated time and effort to do well on tests. These teacher- and school-level factors are suggestive of positive cultures that promote quality teaching and a desire among youth to learn social studies (Blömeke et al. Citation2014).
Significant geography achievement disadvantages were associated with schools in challenging conditions. Because of resource constraints, many schools find it difficult to invest in social studies in general and geography specifically. This is especially true when schools do not perform well on mandatory state assessments, leading many to revert to extra instruction in math, reading, and writing while shifting resources for professional development toward those areas and away from geography and other subjects that are deemed a lesser priority. We found that this adversely affected geography academic outcomes at the school level. Schools lacking fast and dependable computers for classrooms were also associated with lower performance levels in geography.
Neighborhood effects associated with poverty and economic segregation complicate efforts to foster equity and reduce unequal educational achievement (Nieuwenhuis and Hooimeijer Citation2016). Unlike the large-scale geographic predictors in our models, estimated school neighborhood poverty accounted for outcome variance. Given the complex and fragmented nature of school geographies, future geographic analyses of educational inequality should address how characteristics of social policy interact with neighborhood poverty and student characteristics. Geographers can explore these relationships in predictive models of school performance, ideally by linking NAEP data files for geography and other school subjects to large-scale statistical data sets available from the federal government. NCES school identifiers will support data set mergers with other Department of Education large-scale data sets containing those identifiers, including NCES data on teacher salaries. The EDGE data files also contain the names of the NAEP sampled schools. This means researchers can locate the schools and spatially analyze school-level achievement in relation to population, economic, and workforce data available from other federal statistical agencies, while keeping confidential the identities of the schools per NCES data security requirements.
Educational progress in geography is attainable, but the scale and complexity of the challenge must be met by discipline-based education research involving a broad coalition of geographers and education researchers. Systematic answers gained from this future research will provide signposts for policy formulation aimed at improving student outcomes, inclusive of necessary reforms to curriculum and instruction and the social systems and structures responsible for geographic patterns of inequality in education. Through that necessary work, young people across the country stand to gain the capacity to think geographically while geography’s methods and perspectives contribute to a scientific understanding of how Horace Mann’s conception of U.S. public education as a great equalizer might gain traction, one school neighborhood at a time.
Conclusion
Using HLM, we identified multiple educational and noneducational factors that partially account for student outcome variance in U.S. geography education. The results underscore the importance of exposing students to high-quality geography curriculum and instruction. Higher levels of geography achievement were associated with experienced social studies teachers and schools that offer professional development to improve geography and social studies instruction. Geographic research into the causes and consequences of educational inequality can be considerably facilitated by merging large-scale education and geospatial data sets. Geographers can examine neighborhood effects on education in predictive models of school performance paired with deeply contextual studies of the relationships between race, social policy, curriculum, and divergent educational outcomes.
Acknowledgments
Emmanuel Sikali and Douglas Geverdt at NCES provided very helpful assistance with the restricted-use data files supporting this research. We sincerely appreciate the advice and mentoring provided by Joseph Stoltman and also wish to thank Laura LoGerfo, Lesley Muldoon, and other staff at the National Assessment Governing Board for their support and encouragement.
Correction Statement
This article has been corrected with minor changes. These changes do not impact the academic content of the article.
Additional information
Funding
Notes on contributors
Michael Solem
MICHAEL SOLEM is a Professor in the Department of Geography and Environmental Studies, Texas State University, San Marcos, TX 78666. E-mail: [email protected]. His research interests include curriculum and assessment, workforce development, and broadening participation in geography at all levels of education.
Phillip W. Vaughan
PHILLIP W. VAUGHAN is a Research Scientist in the Data Analytics and Research Methodology Unit, Texas State University, San Marcos, TX 78666. E-mail: [email protected]. He has years of experience in structural equation modeling, HLM, test and scale construction, predictive modeling with large data sets, factor analysis, growth modeling, simulation, power analysis, item-response theory, the handling of missing data, and program evaluation.
Notes
1 Solem (Citation2022) provided examples of the geography content knowledge and cognitive skills measured by the NAEP program and the expected capabilities of students who score at three performance levels: NAEP-Basic, NAEP-Proficient, and NAEP-Advanced.
2 NAEP Technical Documentation on the Web provides detailed information about the technical procedures and methodology of the NAEP program. See https://nces.ed.gov/nationsreportcard/tdw/.
3 Additional explanation of the HLM approach and how it builds on traditional regression is available in the baseline study report (Solem et al. Citation2021).
4 In , N refers to the size of the sample with complete data for Level 1 (student) and Level 2 (teacher and school) predictor variables. At Level 1, N values below 12,900 indicate missing data for student-level predictors. At Level 2, N values below 1,840 indicate missing data for teacher- and school-level predictors.
References
- Alderman, D. H. 2021. On the disciplinary achievement gap: Implications of social disparities in NAEP student outcomes for diversity and decolonization in geography education. Journal of Geography 120 (6):244–48. doi: 10.1080/00221341.2021.1968472.
- Anderson, L., and J. Stillman. 2013. Making learning the object: Using cultural historical activity theory to analyze and organize student teaching in urban high-needs schools. Teachers College Record: The Voice of Scholarship in Education 115 (3):1–36. http://www.tcrecord.org/Content.asp?ContentId=16466. doi: 10.1177/016146811311500303.
- Bassok, D., and S. Loeb. 2014. Early childhood and the achievement gap. In Handbook of research in education finance and policy, ed. H. F. Ladd and M. E. Goertz, 526–43. London and New York: Routledge.
- Blömeke, S., F. Hsieh, G. Kaiser, and W. Schmidt. 2014. International perspectives on teacher knowledge, beliefs, and opportunities to learn. Dordrecht, The Netherlands: Springer.
- Brock, C. 2016. Geography of education: Scale, space, and location in the study of education. London: Bloomsbury Academic.
- Bustin, R. 2019. Geography education’s potential and the capabilities approach: GeoCapabilities and school. Cham, Switzerland: Palgrave Macmillan.
- Diket, R. M. 2001. A factor analytic model of eighth-grade art learning: Secondary analysis of NAEP arts data. Studies in Art Education 43 (1):5–17. doi: 10.2307/1320988.
- Dony, C., M. Solem, and A. Nara. 2022. Attracting students of all backgrounds to programs in geography or geocomputation starts before they enter college. American Association of Geographers Newsletter, September 26. Accessed March 15, 2023. https://www.aag.org/attracting-students-of-all-backgrounds-to-programs-in-geography-or-geocomputation-starts-before-they-enter-college/.
- Downs, R. M. 2016. Bringing geography back to life: The role of the geospatial revolution in the U.S. school system. Geography 101 (2):77–84. doi: 10.1080/00167487.2016.12093988.
- Eitland, E., L. Klingensmith, P. MacNaughton, J. C. Laurent, J. Spengler, A. Bernstein, and J. G. Allen. 2017. Schools for health: Foundations for student success: How school buildings influence student health, thinking and performance. Cambridge, MA: Harvard T. H. Chan School of Public Health.
- Enser, M. 2021. Powerful geography: A curriculum with purpose in practice. Bancyfelin, Wales: Crown House.
- Geography Education Standards Project. 1994. Geography for life: National geography standards. Washington, DC: National Geographic Society Committee on Research and Exploration.
- Geverdt, D. 2018. Education Demographic and Geographic Estimates Program (EDGE): School neighborhood poverty estimates—Documentation. NCES 2018-027, U.S. Department of Education, National Center for Education Statistics, Washington, DC. Accessed September 22, 2022. http://nces.ed.gov/pubsearch/.
- Geverdt, D., and L. Nixon. 2018. Sidestepping the box: Designing a supplemental poverty indicator for school neighborhoods. NCES 2017-039, U.S. Department of Education, National Center for Education Statistics, Washington, DC.
- Hanushek, E. A., P. E. Peterson, L. M. Talpey, and L. Woessmann. 2019. The unwavering SES achievement gap: Trends in US student performance. No. w25648, National Bureau of Economic Research, Cambridge, MA.
- Harbour, K. 2015. A multi-level analysis using NAEP data: Examining the relationships among mathematics coaches and specialists, student achievement, and disability status. Unpublished doctoral diss., University of Louisville.
- Harwell, M. R., and B. LeBeau. 2010. Student eligibility for a free lunch as an SES measure in education research. Educational Researcher 39 (2):120–31. doi: 10.3102/0013189X10362578.
- Heafner, T. L., and P. G. Fitchett. 2015. An opportunity to learn US history: What NAEP data suggest regarding the opportunity gap. The High School Journal 98 (3):226–49. doi: 10.1353/hsj.2015.0006.
- Heafner, T. L., P. J. VanFossen, and P. G. Fitchett. 2019. Predictors of students’ achievement on NAEP economics: A multilevel model. The Journal of Social Studies Research 43 (4):327–41. doi: 10.1016/j.jssr.2019.01.003.
- Heffron, S. G., and R. M. Downs, eds. 2012. Geography for life: National geography standards. 2nd ed. Washington, DC: National Council for Geographic Education.
- Hill, H. C. 2001. Policy is not enough: Language and the interpretation of state standards. American Educational Research Journal 38 (2):289–318. doi: 10.3102/00028312038002289.
- Johnson, O., Jr. 2014. Still separate, still unequal: The relation of segregation in neighborhoods and schools to education inequality. The Journal of Negro Education 83 (3):199–215.
- Lambert, D., M. Solem, and S. Tani. 2015. Achieving human potential through geography education: A capabilities approach to curriculum making in schools. Annals of the Association of American Geographers 105 (4):723–35. doi: 10.1080/00045608.2015.1022128.
- Maxwell, L. E. 2016. School building condition, social climate, student attendance. Journal of Environmental Psychology 46:206–16. doi: 10.1016/j.jenvp.2016.04.009.
- Maxwell, L. E., and S. Schechtman. 2012. The role of objective and perceived school building quality in student academic outcomes and self-perception. Children, Youth and Environments 22 (1):23–51.
- McClure, C. H. 2018. Significance and influence of the National Geographic Society alliance network on K–12 geography education, 1986–2011: A historical analysis. Unpublished diss., Texas State University, San Marcos.
- Meusburger, P. 2015. Geography of education. In International encyclopedia of the social and behavioral sciences, ed. J. D. Wright, 165–71. Oxford: Pergamon.
- Monk, J. 1997. Finding a way. New Zealand Journal of Geography 104:7–11.
- Monk, J., R. Sanders, P. K. Smith, J. Tuason, and P. Wridt. 2000. Finding a way: A program to enhance gender equity in the K-12 classroom. Women’s Studies Quarterly 28 (3-4):177.
- Moore, B. 2020. Fugitive black spaces in environmental education: Black-feminism, blues geographies, and relationality. Unpublished master’s thesis, Texas State University, San Marcos.
- Murphy, A. B. 2000. Teaching Advanced Placement human geography. Journal of Geography 99 (3–4):93–97. doi: 10.1080/00221340008978904.
- National Center for Education Statistics. 2022. NAEP report card: Geography. Accessed March 15, 2023. https://nces.ed.gov/nationsreportcard/geography/.
- National Council for the Social Studies (NCSS). 2013. The college, career, and civic life (C3) framework for social studies state standards: Guidance for enhancing the rigor of K–12 civics, economics, geography, and history. Silver Spring, MD: NCSS.
- Nieuwenhuis, J., and P. Hooimeijer. 2016. The association between neighborhoods and educational achievement, a systematic review and meta-analysis. Journal of Housing and the Built Environment 31 (2):321–47. doi: 10.1007/s10901-015-9460-7.
- Polikoff, M. 2013. Teacher education, experience, and the practice of aligned instruction. Journal of Teacher Education 64 (3):212–25. doi: 10.1177/0022487112472908.
- Puttick, S., and A. Murrey. 2020. Confronting the deafening silence on race in geography education in England: Learning from anti-racist, de-colonial, and Black geographies. Geography 105 (3):126–34. doi: 10.1080/00167487.2020.12106474.
- Raudenbush, S. W., A. S. Bryk, Y. F. Cheong, R. Congdon, and M. DuToit. 2019. HLM 8: Hierarchical linear and nonlinear modeling. Chicago: Scientific Software International.
- Reardon, S. F. 2016. School segregation and racial academic achievement gaps. RSF: The Russell Sage Foundation Journal of the Social Sciences 2 (5):34–57. doi: 10.7758/RSF.2016.2.5.03.
- Rueschhoff, J., and H. Palma. 2021. Geography achievement and opportunity to learn: A focus on teacher quality. Journal of Geography 120 (6):218–24. doi: 10.1080/00221341.2021.2005667.
- Savage, C. 2019. Academic majors of social studies teachers and student achievement in the US. Teaching and Teacher Education 84:66–73. doi: 10.1016/j.tate.2019.04.020.
- Schneider, M. 2002. Do school facilities affect academic outcomes? Washington, DC: National Clearinghouse for Educational Facilities.
- Solem, M. 2023. Geography achievement and future geographers. The Professional Geographer 75 (2):207–19. doi: 10.1080/00330124.2022.2081227.
- Solem, M., P. Vaughan, C. Savage, and A. S. De Nadai. 2021. Student- and school-level predictors of geography achievement in the United States, 1994–2018. Journal of Geography 120 (6):201–11. doi: 10.1080/00221341.2021.2000009.
- U.S. Department of Education. 2022. NAEP technical documentation on the Web. U.S. Department of Education, Institute of Education Sciences, National Center for Education Statistics, National Assessment of Educational Progress (NAEP), Washington, DC. Accessed March 15, 2023. https://nces.ed.gov/nationsreportcard/tdw/sitemap.aspx.
- U.S. Government Accountability Office (GAO). 2015. K–12 education: Most eighth grade students are not proficient in geography. Report to the Senate Appropriations Subcommittee on Labor, Health, and Human Services, Education, and Related Agencies. Accessed October 9, 2022. http://www.gao.gov/assets/680/673128.pdf.
- Walstad, W. 2013. Economic understanding in US high school courses. American Economic Review 103 (3):659–63. doi: 10.1257/aer.103.3.659.
- Walstad, W., and S. Buckles. 2008. The National Assessment of Education Progress in economics: Findings for general economics. American Economic Review 98 (2):541–46. doi: 10.1257/aer.98.2.541.
- Zadrozny, J. 2021. Social studies and geography survey for middle and high schools. San Marcos: Gilbert M. Grosvenor Center for Geographic Education, Texas State University.
- Zhang, C. H., and M. Ruther. 2021. Contemporary patterns and issues of school segregation and white flight in U.S. metropolitan areas: Towards spatial inquiries. GeoJournal 86 (3):1511–26. Accessed August 1, 2022. doi: 10.1007/s10708-019-10122-1.