?Mathematical formulae have been encoded as MathML and are displayed in this HTML version using MathJax in order to improve their display. Uncheck the box to turn MathJax off. This feature requires Javascript. Click on a formula to zoom.
Abstract
Destination, as a key concept in tourism geography, has largely determined the scale at which tourist activity space was modeled and studied. Existing studies usually focused on investigating tourists’ activities and movements either at the intradestination (e.g., within a city) or interdestination scale. Although useful in numerous research contexts, these models based on fixed spatial scales are incapable of portraying the complex spatial structure of tourist activity spaces, which sometimes exhibit hierarchical structures, and could span across different spatial scales. In this study, we propose a new representation of tourist activity space to bridge these gaps. The representation takes tourists’ accommodation locations as key reference points. At the macroscale, the sequence of accommodation locations forms the backbone of tourist activity space, denoted as itinerary type. At the microscale, we introduce the concept of territory to describe how individuals organize activities around these overnight “base camps” (i.e., accommodation locations). We apply this representation over a large-scale mobile phone data set of international travelers visiting South Korea to demonstrate its capability. Results show that four generic itinerary types capture the activity space structure of 89 percent of the tourists. The interrelationships of territories and their topological structures further categorize activity spaces into subtypes, leading to a new method of tourist classification based on their spatiotemporal activity patterns. We believe the proposed representation could enrich new perspectives and debates on how tourist activities can be studied. The representation can also be extended as a generic framework to delineate complex forms of human activity space.
目的地是旅游地理学的关键概念, 它在很大程度上决定了模拟和研究旅游活动的空间尺度。现有的研究, 侧重于探讨游客在目的地之内(例如, 城市内)或目的地之间的活动和流动。尽管许多研究都成功地运用了固定空间尺度模型, 但这些模型无法描述旅游活动空间的复杂空间结构:层次性结构、跨越不同空间尺度。为了弥补这些差距, 本研究提出了一种新的旅游活动空间表达方式。以游客住宿地点为关键参照点。在宏观层面上, 住宿地点序列构成了旅游活动空间的主体——行程类型。在微观层面上, 引入了地域的概念, 来描述个人如何在过夜“大本营”(住宿地点)的周围开展活动。我们将这种表达方式应用于访问韩国的国际旅行者的大规模手机数据。结果表明, 四种行程类型反映了89%游客的活动空间结构。地域的相互关系及其拓扑结构, 将活动空间进一步划分为亚类, 进而提出了基于时空活动模式的游客分类新方法。本文的表达方式给旅游活动研究带来了新观点和讨论;它也可以被扩展为通用框架, 以描绘人类活动空间的复杂形式。
El destino del viaje, como un concepto de la geografía del turismo, ha determinado en gran medida la escala a la cual el espacio de la actividad turística se modelaba y estudiaba. Los estudios existentes usualmente están enfocados a investigar las actividades y movimientos de los turistas, bien a la escala del intradestino (e.g., dentro de una ciudad), o la del interdestino. Si bien estos estudios son útiles en numerosos contextos de investigación, estos modelos basados en escalas espaciales fijas son incapaces de retratar la compleja estructura espacial de los espacios de la actividad turística, que a veces exhiben estructuras jerárquicas, y podrían abarcar diferentes escalas espaciales. En este estudio, proponemos una nueva representación del espacio de la actividad turística para salvar estas lagunas. La representación toma como puntos de referencia clave las localidades de alojamiento de los turistas. A la escala macro, la secuencia de los lugares de alojamiento forma la columna vertebral del espacio de la actividad turística, denotada como tipo de itinerario. A la microescala, presentamos el concepto de territorio para describir el modo como los individuos organizan actividades alrededor de estos transitorios “campamentos base” (o sea, las localidades de alojamiento). Aplicamos esta representación a un conjunto de datos de telefonía móvil, a gran escala, de viajeros internacionales en visita a Corea del Sur, para demostrar su capacidad. Los resultados muestran que cuatro tipos de itinerarios genéricos captan la estructura del espacio de actividad del 89 por ciento de los turistas. Las interrelaciones de los territorios y sus estructuras topológicas categorizan aún más los espacios de actividad en subtipos, conduciendo a un nuevo método de clasificación turística basado en sus patrones espaciotemporales de actividad. Creemos que la representación propuesta podría enriquecer nuevas perspectivas y los debates sobre cómo se pueden estudiar las actividades turísticas. La representación también se puede extender como un marco genérico para delinear formas complejas del espacio de la actividad humana.
Activity space is a person’s direct interaction with the social and physical environment (Golledge and Stimson Citation1987). It is widely used in geography to capture the spatial scope of human movements and daily activities (Schönfelder and Axhausen Citation2003; Wong and Shaw Citation2011). Tourism, as a social, cultural, and economic phenomenon, entails movements of people to places outside their usual environment (UN World Tourism Organization [UNWTO] Citation2015). Therefore, the spatial scope of tourist movements can also be represented through the notion of activity space (McKercher and Zoltan Citation2014). In the context of tourism, activity space contains the locations visited or traveled through by a traveler. It reflects travelers’ spatial interactions with their environment. An adequate representation of tourist activity space could provide new insights into how tourists consume time and space during their travels. Understanding tourist movements in their activity space will have profound implications for the tourism industry, transportation planning, and policy development.
Tourist movements have complex hierarchical structures, however, and could occur across different spatial scales, mainly caused by tourists’ change of accommodation locations. As pointed out by the theory of time geography, both the biological needs of people (e.g., sleeping and eating) and the tools they can command (e.g., transportation tools) lead to limitations on people’s activities in time and space (Hägerstrand Citation1970). Subject to these constraints, a tourist’s activities in a day are usually in the vicinity of the accommodation location, which is the localized core of the tourist’s activity space (Shoval Citation2012). During their travels, tourists might sometimes change their accommodation location to establish a new core near distant attractions. Otherwise, they would have to spend a large amount of time on the way to or traveling back from these attractions. These behaviors are well supported by the utility maximization theory (Lancaster Citation1966), which states that tourists tend to maximize the time available for visiting attractions while minimizing the time cost on reaching these attractions (Tussyadiah, Kono, and Morisugi Citation2006; Parroco et al. Citation2012). Besides these motivations, tourists might also change their accommodation locations during a single journey to gain different lodging experiences (Birinci, Berezina, and Cobanoglu Citation2018; Pérez-Rodríguez and Hernández Citation2022). Therefore, it is not rare that tourists stay at two or more different accommodations during one journey. As a result, tourist movements become a combination of short-distance trips near the accommodation locations (microscale) and relatively long-distance transitions between accommodations (macroscale), leading to a great diversity and hierarchical structures of their activity spaces.
Traditionally, such cross-scale tourist movements and their hidden hierarchical structures are depicted from the micro to macro spatial scales by tourist movement models (Xia and Arrowsmith Citation2005; McKercher and Zoltan Citation2014). Macroscale descriptions of tourist movements provide a higher level of simplification, for example, describing the order of cities in which an international tourist travels in a foreign country (Oppermann Citation1995). Microscale descriptions involve more details, including the scenic spots visited in a city and even the specific walking routes within certain scenic spots (McKercher and Lau Citation2008; Orellana et al. Citation2012). In the tourism literature, the macroscale and microscale descriptions are denoted as inter- and intradestination models, respectively. These models are closely related to the concept of destination, which is usually predetermined, depending on research context and perspective. In other words, the activity space represented by the previously mentioned tourist movement models is constrained by a fixed spatial scale determined by the predefined concept of destination, such as a city (Zhao et al. Citation2022). As pointed out by Raun, Ahas, and Tiru (Citation2016), however, although destinations are often artificially separated by geographical or administrative borders, studies in recent years provided evidence that tourists’ actual movements are sometimes crossing the administrative borders (Beritelli, Reinhold, and Laesser Citation2020; Mooses et al. Citation2020; Paulino, Prats, and Whalley Citation2020). Beritelli, Reinhold, and Laesser (Citation2020) found evidence from Twitter heatmap that people’s mental and physical trajectories cover distant places beyond the administrative borders of regions. Mooses et al. (Citation2020) used mobile phone call detail records to identify cross-border activities and introduced the term transnational activity space to capture permanent and temporary mobility. As one key type of temporary mobility, tourists’ movements usually contain both microscale-level movements and macroscale-level movements due to changes of accommodation locations. Traditional tourist movement models with predefined and fixed spatial scales can either describe tourists’ microscale movements or macroscale movements. They are incapable, however, of depicting the cross-border characteristics, topological relationship between movements of different spatial scales, and the underlying hierarchical structures of tourists’ activity space.
In this study, we introduce a new representation of tourist activity space to bridge the research gaps discussed earlier. The activity space representation aims to portray the spatial organization of tourists’ activities and the hidden hierarchies of their movements. The proposed activity space representation takes tourists’ accommodation locations as key reference points, as they are proved to have a profound impact on the spatial organization of tourist movements (Shoval et al. Citation2011; Koo, Wu, and Dwyer Citation2012). The role of accommodation locations to tourists is similar to that of home locations to urban residents, in that residents’ homes usually serve as central points for residents’ movements and their activity space (Song, Koren, et al. Citation2010; Pappalardo et al. Citation2015; Xu et al. Citation2015). Unlike residents, whose accommodations usually remain unchanged for a long period, a proportion of tourists switch their accommodations during their journeys. Therefore, the sequence of a tourist’s accommodation locations, itinerary type, provides a macroscale representation of his or her activity space. At the microscale, locations visited by a tourist during the day(s) when he or she stays overnight at each accommodation location capture the localized short-distance trips around the “base camp” (Lue, Crompton, and Fesenmaier Citation1993), which forms a territory of this accommodation location. Some itineraries might contain only one territory, whereas multiday or multidestination travels usually consist of a number of territories. The union of all the territories in an individual’s itinerary is the territory component of the itinerary. Transitions between the accommodation locations as well as the stopovers on the way are the transit component of the tourist’s itinerary, which is a higher level description of the tourist activity space, playing the role of a backbone of the itinerary.
The proposed model enables a bottom-up view of the spatiotemporal characteristics of tourist activity space and its hierarchical structure across different spatial scales. To demonstrate the capability of the proposed activity space representation, this article conducts an empirical study using a large-scale mobile phone trajectory data set of international travelers visiting South Korea. The study aims to bring about new insights into the hierarchical structure of tourist activity space and is fundamental for understanding how tourists organize their travel and activities at different spatial scales. Specifically, the proposed model helps answer several fundamental questions on tourist activity space from a cross-scale perspective. At the microscale, how do tourists organize their activities around their accommodation locations as localized cores, and what are the spatiotemporal characteristics of the localized activity spaces? From the macroscale perspective, the overall activity space is composed of a series of localized activity spaces centered around the accommodation locations. To understand how these localized activity spaces interrelate with each other, we are prompted to ask this: What are the hierarchical relationships between these localized activity spaces, and in what way do they constitute the overall activity space? Based on the spatiotemporal characteristics at the microscale and the hierarchical relationships at the macroscale, how should we categorize tourist activity space and identify tourists of different travel patterns? By addressing these questions, this article aims to generate valuable insights that can provide reference information for tourism bureaus on location selection of new attractions or hotels, for hotel stakeholders on targeting potential customers, and for travel agencies or individuals on travel planning or itinerary design.
Research Context
Activity Space: Concepts and Measurements
The spatial extent of resident activities is usually conceptualized as activity space in the geography and transportation literature. In the geography literature, the concept of activity space has a long history, defined as “the subset of all locations within which an individual has direct contact as the result of day-to-day activities” (Golledge Citation1997, 279). In urban studies, activity space is also defined as “the local areas within which people travel during their daily activities” (Mazey Citation1981, 212). In time geography, activity space defines the spatial scope of the space–time prism that is used to capture the space–time structure of traveling patterns (Hägerstrand Citation1970; Miller Citation2008). Over the years, numerous methods have been proposed to represent, visualize, and measure the external descriptive statistics (e.g., shape, size) or the internal structures (e.g., randomness and regularity) of activity space (Yuan and Xu Citation2022). Two simple and straightforward methods are minimum convex hull (Harding et al. Citation2012; Lee et al. Citation2016) and the total distance traveled (Páez et al. Citation2010). The former, however, might be affected by the spatial distribution of activity locations, and the latter relies heavily on data spatial and temporal resolution. Some other methods proposed in the transportation literature summarized by Schönfelder and Axhausen (Citation2003) are two-dimensional ellipses including confidence ellipse, standard deviation ellipse (SDE), kernel density approach, and shortest paths network. The radius of gyration (ROG) is another popular indicator to describe the morphology and geographic scale of activity space and is widely used with mobile phone data or smart card data (Song, Qu, et al. Citation2010; Kang et al. Citation2012; Xu et al. Citation2015; Xu et al. Citation2016; Barbosa et al. Citation2018; Yuan and Wang Citation2018; Li et al. Citation2019). This indicator is proven to correlate with two-dimensional ellipses, and its’ computation is much simpler. The simplest form of ROG, also named standard distance, is widely used to quantify the spatial dispersion of individual travel behavior (Gonzalez, Hidalgo, and Barabasi Citation2008; Yuan and Xu Citation2022). A more meaningful way to compute the ROG is to consider temporal information by using visit times or stay duration as the weights of importance of each location (G. Chen, Viana, and Fiore Citation2018). Compared with other metrics and indicators, ROG is less sensitive to outliers and can provide one single measurement (i.e., the radius) to represent the geographic scale of the activity space (Yuan and Wang Citation2018).
These metrics and indicators are usually used to measure the activity space of urban residents and have led to significant implications in various fields. Harding et al. (Citation2012) used the convex hull minimum bounded geometry to fit the daily travel surveys data and indicated a significant connection between land-use clusters and activity spaces. Sherman et al. (Citation2005) constructed the SDE to quantify the size and orientation of the spread of locations visited by individuals. The study also used three other network-based measures to provide a multifaceted picture of individuals’ activity space and its relevance to health care accessibility. Kang et al. (Citation2012) calculated ROG to represent the geographical range of individual mobile phone users’ activity space. The authors studied the correlation of the ROG values with the size and shape of cities to understand human activities from an urban morphology perspective.
With regard to tourists’ travel, the size and shape of activity space can also be well-captured by the previously mentioned measurements and indicators. Based on Global Positioning System (GPS) data of tourists visiting Tasmania, Hardy, Birenboim, and Wells (Citation2020) used both linear indicators (i.e., maximum distance and cumulative distance) and area indicators (SDE) to quantify how tourists’ footprints disperse in space. To depict the multifaceted patterns of tourists’ mobility, Xu, Xue, et al. (Citation2021) used mobility indicators including ROG, diameter of trajectory, and activity entropy to capture different dimensions of tourists’ travel behavior. With the aid of digital footprints collected by social media platforms, Zhao et al. (Citation2022) identified multiscale tourist activity spaces based on tourists’ areas of interest extracted from a kernel density map of tourist footprints. Although these measurements well capture the shape and size of activity spaces of urban residents as well as tourists, they measure people’s activity space as a whole and neglect the hierarchical structure of tourists’ itineraries led by changes of accommodation locations. There are still difficulties in measuring the activity space of tourist movements due to the cross-scale characteristics and the complex topological structures.
Traditional Tourism Models: Interdestination and Intradestination Models
A variety of tourism models have been developed to depict the topological structure of tourist movements at two major scales: interdestination and intradestination. These models recognize that tourism movements involve two components—a destination touring component and a transit component (McKercher and Zoltan Citation2014). The concept of destination usually refers to destination cities, although it could vary according to the research context. These models have made insightful contributions to the typology of tourist movement patterns.
Interdestination research studies tourists’ travel patterns between their homes and destinations or between destinations. Tourists’ interdestination travel patterns have been classified into several major themes, including direct route (routes as nearly direct as the shortest-distance route), partial orbit (the most direct route to an area followed by a touring loop), full orbit (a completely circular route; Mings and McHugh Citation1992), hub-and-spoke style or base camp (tourists base themselves in one main destination and then take short trips to nearby attractions and destinations; Lue, Crompton, and Fesenmaier Citation1993), resort trip (direct travel with a single destination), and recreational day trips (tourism trips that contain no overnight stay; Flognfeldt Citation1999).
Studies on intradestination tourist movements have emerged as passive electronic tracking devices (e.g., portable GPS receivers) improve the level of precision and reliability of tourists’ travel history. Intradestination models are developed based on two dimensions: territorial dimension and path dimension. The concept of territoriality focuses on the distance traveled from the accommodation location. With increasing distance traveled from the accommodation location, four typical types of territorial movement models are identified: no movement, convenience-based movement, concentric exploration, and unrestricted destination-wide movement. Path dimension takes individual attractions as nodes and studies the relationship and path between nodes. Similar to interdestination studies, the tourist movements between attractions within the destination also exhibit patterns ranging from simple point-to-point patterns and circular patterns to egocentric hub patterns (Lew and McKercher Citation2006). With the aid of advanced tracking technology, empirical studies support the traditional model while revealing great diversity and complexity of intradestination movements (McKercher and Lau Citation2008; Grinberger, Shoval, and McKercher Citation2014; Sugimoto, Ota, and Suzuki Citation2019). McKercher and Lau (Citation2008) identified seventy-eight movement patterns that are further categorized into eleven styles by visualizing tourists’ trip diaries. Based on GPS logger data, Grinberger, Shoval, and McKercher (Citation2014) studied the typology of tourists’ time–space consumption and Sugimoto, Ota, and Suzuki (Citation2019) visualized the distribution of tourist flow within a city and carried out a network analysis of tourist flow. Such studies unveil the complicated characteristics of intradestination tourist movements and complement the traditional theoretical model.
These models, however, are closely tied to the concept of destination, which is usually defined based on predefined spatial units such as administrative regions (Paulino, Prats, and Whalley Citation2020). The conceptualization of destination is usually predetermined, depending on research context and perspective. For example, cities or countries are regarded as destinations in the studies of tourist behavioral patterns (McKercher and Lau Citation2008; Koo, Wu, and Dwyer Citation2012; Raun, Shoval, and Tiru Citation2020). On the other hand, scenic spots within a city, such as theme parks, are also considered as destinations in some studies (X. Huang et al. Citation2020; Y.-S. Chen and Wu Citation2021). The complexities in the definition of destination make it difficult to provide an adequate representation of tourists’ activity space as tourists’ movements often contain both short-distance and long-distance travels that are across different spatial scales and the administrative boundaries.
The Need for a Cross-Scale Representation of Tourist Activity Space
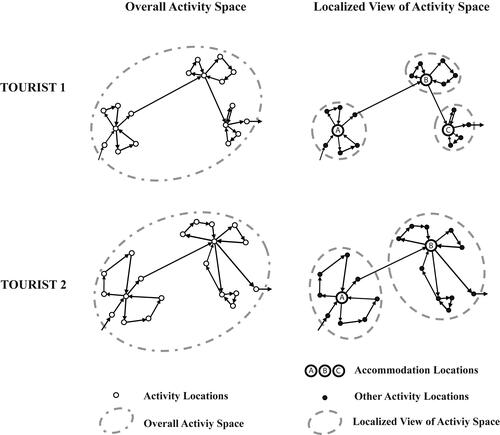
Although the activity space metrics and indicators mentioned earlier are efficient in capturing the spatial extent of urban residents’ activities, they might not be suitable for measuring tourists’ activity space when it is hierarchically structured in different spatial scales (Zhao et al. Citation2022). Metrics like two-dimensional ellipses usually measure the activity space of urban residents whose activity locations mainly focus around two key locations: homes and workplaces (J. Huang et al. Citation2018; L. Zhou and Ji Citation2018). These metrics measure all the locations visited by the individual as a whole. Some tourists, however, switch their accommodation locations more than once and the movements between accommodation locations usually cross a larger spatial scale than the short trips around the accommodation locations. Therefore, using the previously mentioned indicators to measure tourist activity space would neglect the spatial topological traits of tourists’ travels as well as the differences of localized activity space. As illustrated in , the activity space of Tourist 1 and Tourist 2 are similar if all the visited locations are measured as a whole. From the localized view, however, locations visited by Tourist 1 are clustered as three main parts decided by three accommodation locations, whereas those visited by Tourist 2 have only two focal points. It is also explicit that Tourist 2 is more willing to explore further from their accommodations than Tourist 1. Therefore, a cross-scale representation of activity space is needed for capturing the spatial and temporal traits of individual tourists’ movements from different spatial scales. The representation should be able to differentiate tourists with different microscale spatiotemporal traits even if their macroscale activity spaces exhibit similar characteristics.
Figure 1. Comparison of overall activity space and localized view of activity space. Although the overall activity space of Tourist 1 and Tourist 2 look similar (left), a localized view reveals the subcomponents in their activity spaces that exhibit different spatial extent and interrelationships (right).
In the tourism literature, the spatial distribution of tourists’ activities is usually characterized by the concept of dispersal, described as “movement outward from a touring center, and towards locations with declining tourism facilities” in early work (Cooper Citation1981, 369), and later defined as “the tendency of visitors to travel beyond the main gateways of the host destination” (Koo, Wu, and Dwyer Citation2010, 116). Traditional measurements of dispersal are descriptive approaches including Trip Index (TI) by Pearce and Elliott (Citation1983), Main Destination Ratio (MDR) by Leiper (Citation1989), and Travel Dispersal Index (TDI) by Oppermann (Citation1992). These indexes consider variables including number of overnight destinations, the proportion of nights spent in a given destination, and number of different types of accommodation. The concept of dispersal highlights the significance of accommodation location in measuring the spatial distribution of tourist activities, which further supports the proposed cross-scale representation that takes the accommodation locations as key reference points.
Study Area and Data Set
To demonstrate the capability of the proposed activity space representation, we take a large-scale mobile phone trajectory data set of international travelers visiting South Korea as a case study. In 2018, more than 15.3 million foreign tourists visited South Korea (compared to 31.3 million domestic visitations), making it one of the top thirty most visited countries in the world, and the seventh most visited country in Asia (UNWTO Citation2019). Tourism is a key driver of economic growth in South Korea. In 2018, the total tourism receipts in South Korea reached US$18.4 billion, accounting for 4.7 percent of the gross domestic product. About 1.4 million jobs were estimated to be supported by the tourism sector, representing 5.3 percent of total employment in the country (Zhongming et al. Citation2020). South Korea consists of seventeen top-tier administrative regions, including metropolitan cities, one special city, one special self-governing city, provinces, and one special self-governing province. These provincial-level regions are further divided into more than 200 municipal-level divisions. For simplicity, provincial-level divisions and municipal-level divisions are referred to as provinces and cities, respectively, in the remainder of this article.
This study uses an anonymized mobile phone positioning data set collected by one of the major cellular operators in South Korea. The data set contains 3,694,856 location footprints of 192,302 international travelers during a period of fifteen days (1–15 August 2018). A user’s location is recorded when he or she stays within the coverage of a cell tower for at least ten consecutive minutes. Each record documents a user’s start and end timestamps of one recorded location, and the cell towers his or her phone is connected to, associated with the unique ID of the user. The time gaps between records indicate possible movement behavior. The median and average length of gaps are thirty and ninety minutes, respectively. is an example of an individual’s recorded locations in South Korea (only the first two rows and the last two rows are shown in detail). The first two records indicate his or her stay between 02:31:00 and 08:46:00 and between 10:53:00 and 11:16:00, respectively. The change of cell tower between the first two records indicates a movement between 08:46:00 and 10:53:00.
Table 1. An example of an individual’s records in the mobile phone data set
Due to various travel purposes and personal preferences of mobile phone usage, some users in the data set might not have sufficient records. It is necessary to conduct data cleaning to ensure reliability and generality (G. Chen, Viana, and Fiore Citation2018). In this study, two types of users are excluded from further analysis: (1) Users with a very short time span (the duration between the first and the last record is less than twelve hours) or same-day visitors (the first and the last record are within the same day). These users might be transferring passengers and did not intend to travel around the study area. (2) Users without any records for a long time. Users’ devices might lose connection with the cell towers once in a while, but a long-time loss of connection leads to profound incompleteness of their whereabouts recorded by their mobile phone trajectories. There were 70,903 Type 1 users and 9,754 Type 2 users. After filtering these two types of users, 111,645 travelers remain valid for subsequent data analysis.
Methodology
Representing Tourist Activity Space: Key Concepts and Components
This section introduces the key concepts and components in the proposed activity space representation. The framework contains two key components, namely the territory component and the transit component. Territory components represent tourists’ microscale activity space by capturing tourists’ activities within the vicinity of their accommodation locations. Transit components aim to capture macroscale movements due to changes of accommodation locations.
In the context of tourism, a tourist starts and ends a day at the accommodation due to the need for sleep. During the daytime, the tourist’s activity space is usually affected by the decision of whether to switch the accommodation location. If the tourist chooses to return to the same accommodation, he or she usually tours within the vicinity of the hotel before returning to the same accommodation by the end of the day due to the limitations of transportation tools and time budget. The locations visited on this day constitute a part of the territory component. If the tourist decides to switch the accommodation, he or she starts from the previous hotel, engages in touring activities, and arrives at a new hotel by the end of the day. The locations visited on the way to the new hotel belong to the transit component. In the following, we formally define the key concepts used in this study. In , we exemplify the key concepts with a travelers’ trajectory.
Activity location: Activity locations denote tourists’ meaningful activity locations where they have spent a certain amount of time. In the context of the adopted mobile phone data set, a meaningful activity location consists of one or multiple cell towers in close proximity.
Nighttime anchor point (NAP): NAP is a special type of activity location where a tourist spends the largest amount of time during the nighttime. It is an estimation of tourists’ dwelling location. NAPs are key reference points to determine territory components. In the example in , the trajectory contains two NAPs, indicating that the traveler stayed overnight in two different locations, one near the Jeju International Airport and the other in the southern part of Jeju.
Itinerary type: For each individual, the sequence of the NAPs is a high-level representation of his or her movement trace. It represents the backbone of tourist activity space in the proposed representation. For example, the trajectory in has an itinerary type of
as the activity space of this traveler is determined by two different NAPs (to be further discussed in the Results section).
Territory component: A territory component is defined along with a core location (NAP) where a tourist stays overnight. The territory of this NAP consists of a set of activity locations. The NAP serves as the “base camp” for all other activity locations within the territory. The set of locations in this territory represents the microscale activity space during the period when he or she selects one place as the accommodation. In , activity locations within each dashed circle constitute a territory.
Transit component: A transit component refers to the travels between different territories as well as the side trips. It captures the higher level movements due to changes of accommodations. Most transit components are interterritory transit, constituted by travel from one territory to another. Besides, inbound travel to the first territory and outbound travel from the last one are special types of transit components (i.e., inbound transit and outbound transit, respectively).
Side trips: Side trips are a part of transit components. They are stopovers on the way from one territory to another. For far-apart territories, side trips are usually transport hubs like the airport. For close territories, tourists might spend one to two hours visiting small attractions as side trips (McKercher and Zoltan Citation2014).
Gateways: Gateways refer to the first (entry gateway) or the last (exit gateway or egress) visit in this country. Gateway cities usually provide exceptional transportation facilities and services like international airports (Lew and McKercher Citation2002).
Figure 2. Illustration of key concepts of the proposed activity space representation taking a traveler in Jeju Island, South Korea, as an example.
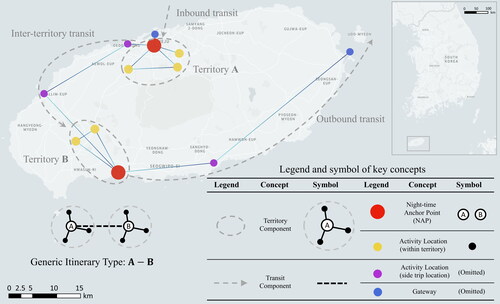
The traveler’s trajectory shown in contains all the key concepts of the proposed activity representation. Some travelers’ trajectories, however, have simple activity patterns and contain only parts of these key concepts. About 47.3 percent of the travelers’ trajectories do not contain inbound transit and 34.3 percent did not contain outbound transit. A possible reason is that some travelers started to use the cellular service after their arrival at the first territory or ended their recording before leaving the last territory. For those who have inbound or outbound transit, compared to their whole journey, the proportion of time spent by a tourist on inbound or outbound transit is rather small (around 13 percent on average with a median of 7 percent). Therefore, in the following analysis, we exclude the inbound or outbound transits as well as the gateways of the trajectories, and solely focus on the main part of the journey (territory components and transit components in between).
Identify Activity Locations and NAPs from Individual Cellphone Trajectories
To represent tourist activity space, the first step is to extract meaningful locations visited by travelers. When a traveler’s mobile phone is within the service coverage of multiple cell towers, however, it often switches the signal connection between different towers, known as oscillation or the ping-pong effect (Iovan et al. Citation2013). The switching signals might lead to noisy shifting in positioning the traveler. To reduce such effects and derive the stationary locations, activity location, a frequently used concept in the geography literature, is adopted to represent clusters of closely located cell towers (Schönfelder and Axhausen Citation2003; Xu, Li, et al. Citation2021). The derivation process of activity locations includes three steps. First, for each individual, the towers are ranked by the total time that the individual stayed nearby. Second, the tower with the longest stay duration will be chosen as an activity location and group the cell towers within 500 m from it. This threshold distance is determined by the mean and median distance between cell towers and has been proven to be an optimal aggregation grid size in previous studies based on mobile phone data (Grauwin et al. Citation2015; Diao et al. Citation2016; Heiler et al. Citation2020; Xu, Li, et al. Citation2021). Third, among the towers that have not been grouped, the first two steps are repeated until all the towers have been chosen as or grouped by activity locations.
Based on travelers’ starting time and ending time of stay at the identified activity locations, we identified NAPs from individuals’ trajectories. Because most traveler behavior follows circadian rhythms, NAPs are used to approximate travelers’ dwelling locations. Some users might have one or more NAPs. A NAP is defined by two simple criteria that cohere with travelers’ overnight staying behaviors: (1) during the time slot from midnight to 8 a.m. in a day, the activity locations at which a traveler spends more than two hours, and (2) the location where the traveler spends the longest time among all the activity locations during that time slot. An activity location is labeled as the traveler’s NAP only if it satisfies both criteria. Note that the extraction of NAPs is robust with respect to variations of the duration threshold, as over 85 percent of NAPs extracted by two-hour threshold have a duration of more than five hours.
Because accommodation locations are proven to have profound influence on movements both for residents and tourists (Shoval et al. Citation2011; Xu et al. Citation2015), the NAP sequence of each traveler represents the dominant places of his or her activity space. Then the backbones of tourist activity space with different topological structures, denoted as itinerary types, are represented by NAP sequences in alphabet-ordered representations. Given an individual’s NAP sequence, the itinerary types are derived by the following steps: (1) Find identical NAPs in the sequence. Merge consecutive identical NAPs. (2) The itinerary type of each individual is represented by an ordered locations sequence, which, for simplicity, is arranged in alphabet series starting from A. Taking a five-day NAP sequence as an example, after Step 1, by merging the consecutive identical locations, the sequence can be represented as
(
denotes the ith NAP of a traveler). After Step 2, the backbone of his or her activity space will be represented as itinerary type
Identify Territory Components and Transit Components from Individual Location Sequences
Based on the identified activity locations and NAPs, territory components and transit components are derived from individual travelers’ trajectories to represent the topological structures of their activity space. From the perspective of the time-varying graph derived from a tourist’s trajectory, a territory is defined as the locations (nodes) strongly connected by tourist movements (paths). Note that in a time-varying graph, for two nodes, i and j, if there exists a temporal path from i to j, and from j to i, then nodes i and j are strongly connected. A temporal path is a sequence of edges that satisfy two conditions: (1) Each node is visited at most once, and (2) the visiting time of the nodes should be an increasing sequence (Nicosia et al. Citation2013). The territory consists of a NAP and the activity locations strongly connected to this NAP. In this study, timestamps of all records of any individual traveler are an increasing sequence by nature. If the visit time of an activity location is between the first and last visit to a NAP (i.e., approximation of check-in time and check-out time of a hotel), then this activity location belongs to the corresponding territory of this NAP. Accordingly, transit trips are the activity locations visited between the last visit to a NAP and the first visit to the next NAP (i.e., approximation of the check-out time of the previous hotel and the check-in time of the next hotel).
Characterize Spatial Extent of Individual Territories
The previously identified components have presented the topological structure of tourist activity space. To understand the spatial characteristics of identified territories individually, we use three indicators to measure the spatial extent of tourists’ activities in the territories, namely territory ROG (ROGterr), diameter, and maximum distance from NAP.
ROG is a commonly used quantitative description of the span of movement (G. Chen, Viana, and Fiore Citation2018). Given N unique activity locations in the NAP territory, ROG is computed as
where
denotes the center of mass of the territory, which is the arithmetic mean of the coordinates of all locations in this NAP territory. The center of mass is usually replaced by the individual’s home location to emphasize the impact of home place on the activity space of urban residents (Schönfelder and Axhausen Citation2003). Because hotels are to tourists what home is to urban residents, in this study, we substitute the center of mass by the coordinates of the NAP,
to reveal the spatial influence of accommodation location on the activity space of tourists. By this substitution, the ROG of each territory is modified as
ROG and ROGterr are usually highly correlated (R2 > 0.85 and ROGterr ≈ 1.3 ROG in this data set). ROGterr is a more behaviorally realistic measurement and can better capture the activity space of territory, because the activity center of territory might be far from the geometrical center. In addition, in the calculation of ROG, each location is usually weighted by its visit frequency or stay duration (Gonzalez, Hidalgo, and Barabasi Citation2008; Ranjan et al. Citation2012). We omit such weights in calculating ROGterr because most NAPs have a dominating effect on ROG with extremely large network degree and the longest stay duration in the territory. The size of territories would otherwise tremendously shrink toward the NAPs.
Diameter is defined as the Euclidean distance between the two most distant activity locations in a territory. It is commonly used to quantify the linear size of a network and has been used to measure the scale of coverage of the transportation supply side (Kou and Cai Citation2019), the size of the mobility network (Saberi et al. Citation2017), and the dispersal of tourists (Hardy, Birenboim, and Wells Citation2020). For the calculation of diameter, at least two activity locations apart from the NAP should be involved. Therefore, territories with only one activity location apart from the NAP are excluded while calculating the diameter. Maximum distance from NAP is an intuitive indicator that measures the Euclidean distance from the most distant activity location to the NAP within the territory. It reflects how tourists’ activity space is limited by their capacity constraints (including circadian rhythm, traveling speed, and time budget) as conceptualized in the framework of time geography (Miller Citation2008).
Analysis Results
Topological Structure and Typology of Itineraries
Generic Itinerary Types. Among the 111,645 travelers selected from the mobile phone positioning data set, 246 types of generic itinerary types are detected, ranging from short NAP sequences like and
to longer ones like
The longest NAP sequence contains eleven NAPs. In spite of the high diversity of itinerary types, the majority of travelers (88.98 percent) are captured by the four most frequent ones, as reported in . They are labeled single-NAP travelers, double-NAP travelers, returning travelers, and exploratory travelers, respectively, according to the generic structures of their activity space. The statistical properties of the four generic types are demonstrated in , and further explained in the following.
Figure 3. The distribution of stay duration: (A) The overall distribution of stay duration of all travelers. (B) The distribution of the stay duration of generic itinerary types. Note: NAP = nighttime anchor point.
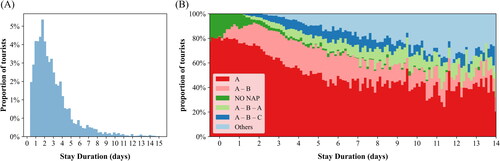
Table 2. The distribution and stay duration of generic itinerary types observed from the 111,645 travelers
Single-NAP travelers (
Double-NAP travelers (
Returning travelers (
No-NAP travelers (
Territory Components: Topological Structures and Interrelationships. Although some travelers are captured by the same generic itinerary type, their activity space further diversifies in terms of time span and spatial extent. Such diversity is mainly contributed by differences lying in the topological structures and interrelationships of territory components. In terms of topological structures, whether a territory contains activity locations other than NAP differentiates the territory into a resort territory or a hub-and-spoke territory. Resort trips, or “trips to a place where the major part of the stay is at the accommodation location,” one of the travel modes documented by Flognfeldt (Citation1999), are well captured in our data set. Following the definition in the tourism literature, we define territories that contain no other activity locations but solely a NAP as resort territories (denoted with ), otherwise the hub-and-spoke territories (denoted without
), where the accommodation locations serve as the “base camp” for other distant scenic spots (Lue, Crompton, and Fesenmaier Citation1993). Among all the detected territories, 47,596 out of 149,498 territories (31.80 percent) are observed to be resort territories (see ).
Figure 4. Distribution of time ratio at the nighttime anchor point (NAP) to the territory: hub-and-spoke territory versus resort territory.
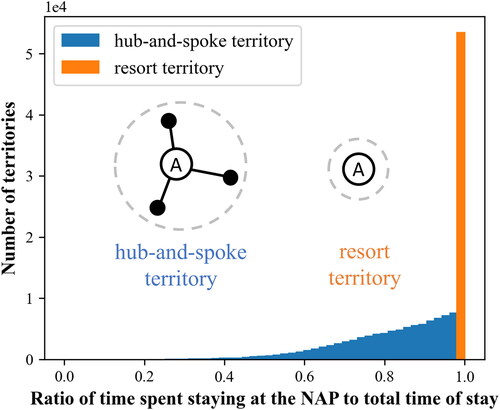
Travelers of resort territories have significantly different spatial usage and time budget arrangements from travelers of hub-and-spoke territories. The spatial extent of resort territories is limited within a confined area from the accommodation location, and a large proportion of the time budget is spent at the accommodation location. Consistently, we find that travelers’ stay duration at the corresponding NAPs of resort territories fluctuates greatly with an average of 34.7 hours and a median of 17.0 hours. The existence of resort territories leads to great diversity in the spatiotemporal characteristics of activity space among tourists sharing the same itinerary types.
For travelers with multiple territories, the territories of each individual traveler are not always well-separated in space or structure. Territories intertwined with each other spatially or structurally or both are referred to as intertwined-territory travelers in the following part of this article. Spatially intertwining territories are closely located territories whose distance is smaller than the spatial extent of the largest territory. Structurally intertwining territories are those involving activity locations visited by multiple territories. As the tourism literature points out that transit components “may or may not be integrated into the destination components” (McKercher and Zoltan Citation2014, 35), the transit components of such travelers are integrated with their territory components. The travel patterns of intertwined-territory travelers manifest frequent round trips. On average, an intertwined-territory traveler has 4.2 round trips between certain pairs of activity locations, compared to 1.6 round trips for other travelers. One possible reason is that travelers involving these intertwined territories might be in-bound visitors for business, religious, medical, or other purposes apart from leisure travel. Their trips might require multiple visits to certain locations like meeting venues, specialized clinics, and so on.
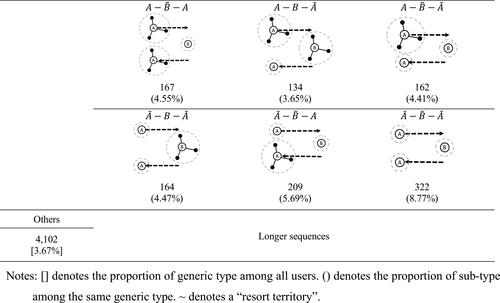
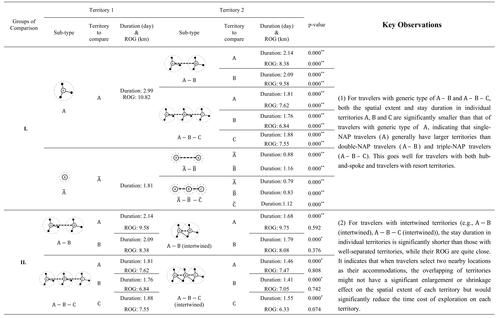
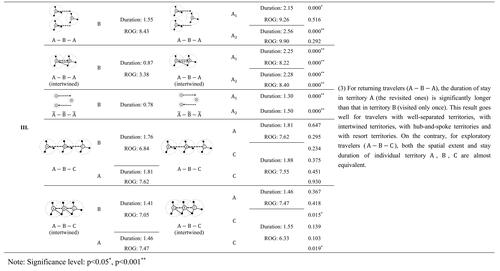
Subtypes of Itineraries and Their Spatiotemporal Characteristics. Associated with such diversities in topological structures and interrelationships between territories, identifying the subtypes of each itinerary type would differentiate travelers’ spatial usage and time budget. By considering the number and order of resort territories and whether the territories are intertwined, the top four most frequent itinerary types are further categorized into a number of subtypes. We propose an intuitive graphical representation to demonstrate the topological structure of different subtypes (see ).
Figure 5. Subtypes of itineraries observed from the mobile phone data set.
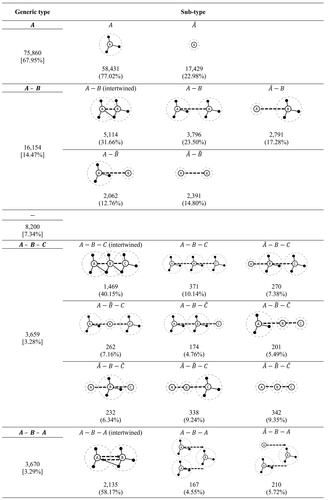
demonstrates each subtype along with its graphical representation, numbers, and proportions. The majority (77.02 percent) of the single-NAP travelers () have hub-and-spoke style territories, and the remaining 22.98 percent of travelers have resort territories (
). Intertwined-territory travelers are frequently observed in most generic itinerary types, except for the single-NAP cases. About one-third of double-NAP travelers (
) contain intertwined territories. Intertwined-territory travelers also dominate the exploratory travelers (
) and returning travelers (
).
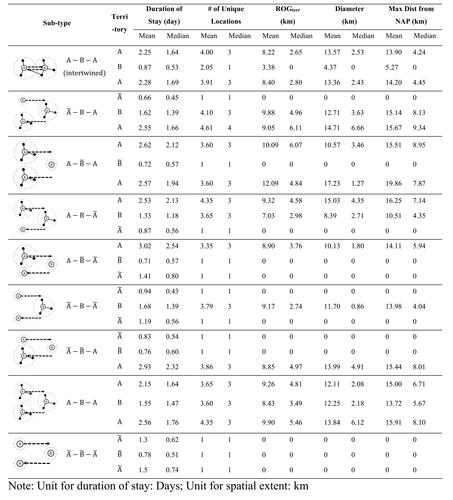
To understand how individual tourists’ activity space varies across different subtypes of itineraries, we quantified the spatiotemporal characteristics of their territories by measuring the duration of stay, number of unique locations, and spatial extent of each individual territory. ROG of territory (ROGterr), diameter, and maximum distance from NAP are calculated to estimate the spatial extent of an individual traveler’s activity space. details the results of the selected indicators of all subtypes in each generic type and
The detailed results of generic type
and
are shown in Appendix and , respectively.
Figure 6. Spatiotemporal characteristics of subtypes: Single-NAP travelers () and double-NAP travelers (
).
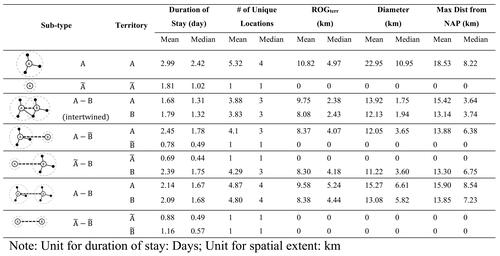
As the most common subtype of itinerary, type with hub-and-spoke territory characterizes over half of the travelers. The spatiotemporal characteristics of this subtype constitute a general portrait of the majority of travelers and form the baseline for comparison for other subtypes. On average, the only hub-and-spoke territory in travelers’ activity space covers 5.32 unique locations, varying in a wide range from two to more than twelve locations. The mean duration of stay is about 2.99 days, fluctuating greatly between half a day and up to one week. As the only agglomeration of the activity space, the average spatial extent of the territory in this subtype is the largest among all subtypes, with an average ROGterr of 10.82 km and a median ROGterr of about 4.97 km. Over 90 percent of the territories are within 10 km in radius. The mean and median diameter are 22.95 and 10.95 km, respectively, about double the ROGterr. Maximum distance from the NAP indicates the ultimate reach of tourists’ territories and the highest traveling cost they are willing to undertake for exploring within the territories. The mean value of the maximum distance from NAP is 18.53 km, and 72.8 percent of the travelers fall within this distance. It indicates that most travelers are not capable of visiting attractions more than 19 km away from the accommodation and returning “home” by the end of the day. This metric provides a reference distance for travelers or itinerary designers when they consider the necessity of changing the accommodation locations. In the case of resort territory
because the NAP is the only location that constitutes the territory, the duration of stay in the territory is much shorter than hub-and-spoke territories. On average, a traveler of this subtype spends 1.81 days staying at the NAP and then leaves the country by a gateway (airport or harbor), suggesting that these travelers might just be transfer or pass-through travelers.
To further understand the spatiotemporal characteristics of different subtypes of activity space, we conducted three groups of comparisons (see ). In the first group, we compare the spatiotemporal indicators of single-NAP travelers () with double-NAP travelers (
) and exploratory travelers (
). For both hub-and-spoke and resort territories, both spatial and temporal indicators of
and
are significantly smaller than for
Second, we compare the well-separated territories with their intertwined counterparts. Third, a comparison of spatiotemporal indicators is conducted between returning travelers (
) and exploratory travelers (
). The comparison results and key observations are demonstrated in .
Figure 7. Comparisons of spatiotemporal indicators among subtypes.
Uniformity of Territories: Exploration Pace
Whereas the proposed representation framework differentiates tourists’ itineraries into numerous types with highly diverse spatiotemporal characteristics, the novel concept territory captures certain uniformity of tourism behavior across different types of itineraries: Individual exploration pace within any single territory highly resembles each other regardless of itinerary types.
To compare the exploration pace of tourists, we computed a series of time evolution curves of the activity space for each traveler to represent the expanding speed of tourists’ activity space (or the dispersal of activity space). The pace of exploration throughout the whole journey is represented by the time evolution of the overall journey ROG (), and the exploration pace in each single territory is represented by the time evolution of the territory ROG (), denoted as ROGterr. For ease of comparison among individuals, the stay duration of the journey and of the territory are normalized for each traveler. Curves are then grouped by the generic itinerary types.
Figure 8. Time evolution of spatial extent of activity space: (A–B) Time evolution of the absolute spatial extent of the whole journey and each territory. (C–D) Time evolution of the normalized spatial extent of the whole journey and each territory.
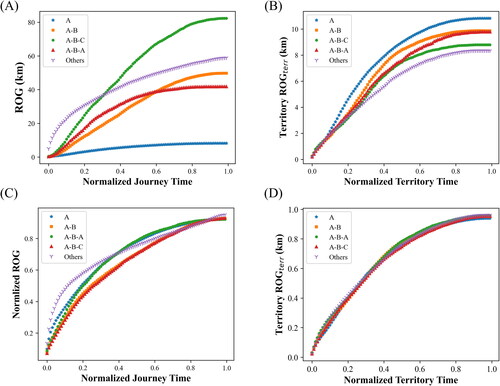
show that the absolute size of activity space saturates after about 80 percent of the stay duration, both for a whole journey and a single territory. For a whole journey (), it aligns with the intuition that travelers with more NAPs have larger overall activity space. The reason is that travelers with more NAPs are more likely to settle down in more far-apart “base camps,” enlarging the overall ROG. For single territories (), the territory ROGterr are of similar spatial scale regardless of itinerary types. The only subtle difference observed among different itinerary types is that the mean value of ROGterr drops slightly as the number of NAPs increases. It is also intuitive that more territories diffuse tourists’ energy for explorations. The comparison of indicates that although the size of activity space of the whole journey might be very diverse, the activity spaces of single territories are of similar spatial scales.
uses the normalized version of ROG and ROGterr as a representation of the relative size of activity space to compare the exploration pace among individuals of different itinerary types. is a normalized version of and is a normalized version of . shows the exploration pace of each individual in his or her whole journey, whereas demonstrates the exploration pace of each individual in each single territory. In , the curves of different groups almost overlap each other, revealing that tourists’ exploration in the territories follows almost the same pace regardless of the itinerary type, whereas the exploration pace of the whole journey does not follow this rule.
This further verifies that the proposed microscale representation, territory, allows parallel comparisons of both the spatial scope and the temporal scale of tourist’s movements in their activity space across different itinerary types. This implies that a multicentric and nested structure might be the better representation of tourist activity space instead of overall representations, providing new insights into the concept of place of tourist travel in tourism geography.
Discussions and Conclusions
Summary
This study proposes a new activity space representation to portray the spatiotemporal organization of individual tourists’ travel and activities, as well as their hierarchies across different geographic scales. By taking accommodation locations as key reference points, a traveler’s activity space is represented by a combination of territory component(s) and transit component(s). Territory components depict a microscale activity space around travelers’ accommodation locations, whereas transit components capture their macroscale movements due to changes of accommodations. Based on these components, we derived four generic itinerary types and further categorized them into a number of subtypes according to the differences in their spatiotemporal characteristics.
Theoretical Implications
Hägerstrand’s (Citation1970) concept of time geography indicates that space and time constrains an individual’s daily activities. The need for sleep and the speed of transportation limits the time available for traveling and marks the boundaries of the territory within which people pursue their daily life paths (Hägerstrand Citation1970; Shoval Citation2012). As tourists change their accommodation locations during their travel, their activities would demonstrate a hierarchical structure in which the daytime activity locations are confined within a certain area from where they live. Activity locations in such areas form a “territory” in this article, usually exhibiting a hub-and-spoke form of structure. The classical time-geography measurements of activity space (e.g., space–time prism, the envelope of the space–time path) usually consider an individual’s itinerary as a whole, thus missing a localized view of activity space. The proposed cross-scale activity space representation, in its essence, is a meaningful segmentation of tourist itineraries that considers both the cross-border characteristics of tourist movement (Stoffelen, Ioannides, and Vanneste Citation2017) and the time budget allocation of tourists (Xu, Xue, et al. Citation2021).
Compared with segmentation methods based on administrative boundaries, for example, the tourist movement models based on the concept of destination, the proposed representation can illustrate the cross-border and cross-scale characteristics of tourist travel. In our data set, among the 149,498 identified territories, 49.5 percent are cross-city territories and 13.0 percent are cross-province territories: During the daytime, these tourists visit locations in cities or provinces that are different from the ones where they take their overnight rest.
Different from segmentation methods based on day and time (Yang et al. Citation2017), the proposed representation can better reveal the hierarchical structure of tourist movement and tourists’ time budget allocation strategy by taking the accommodation locations as the key locations. After segmenting individual tourists’ itineraries according to the hierarchical structure, from the data set, we observe that 67.95 percent of the international travelers visiting South Korea stick to only one accommodation location (e.g., hotel, hostel, etc.) for one to three days and on average visit five unique locations within a 10-km “immediate hinterland” of the accommodation.
Practical Implications at the Individual Level
This empirical study provides practical implications on understanding individual travelers’ movement patterns from massive observations. In the adopted data set, four generic itinerary types capture the topological structure of activity space of 89 percent of the international travelers observed in the mobile phone data set, including single-NAP travelers (), double-NAP travelers (
), exploratory travelers (
) and returning travelers (
). For travelers with the same generic itinerary type, there are large variations in the spatiotemporal characteristics of their activity space. Such variations are mainly caused by differences in microlevel topological structures (hub-and-spoke territories vs. resort territories) and interrelationships between territories (intertwined territories vs. well-separated territories). Based on such differences, the generic itinerary types are further categorized into a number of subtypes. We present the subtypes and their spatiotemporal characteristics using a series of intuitive graphical representations.
Comparing the spatiotemporal characteristics between territories of different subtypes results in three important findings that reveal how tourists consume their space and time in their activity space. First, single-NAP travelers generally have larger territories than double- and triple-NAP travelers. Among the single-NAP travelers, over 77 percent are hub-and-spoke territories, which meets the elaboration of the “base camp” model proposed by Lue, Crompton, and Fesenmaier (Citation1993). Tourists whose itineraries follow such patterns only take one location as the accommodation place and take short day trips to nearby attractions. Second, when travelers select two nearby locations as their accommodations, the overlapping of territories might not have a significant enlargement or shrinkage effect on the spatial extent of each territory. Instead, they would significantly reduce the time cost of exploration on each territory. This can be explained by the distance decay effect in the change of time budget according to the distance from the accommodation location (Shoval et al. Citation2011). It is of high value to study the reason behind their movements between two relatively close accommodation locations that make their territories overlap. For example, some travelers might move for a better dwelling experience, whereas others might move to save time budget (Birinci, Berezina, and Cobanoglu Citation2018; Pérez-Rodríguez and Hernández Citation2022). Understanding the mechanism of tourists’ decision of changing accommodation locations would benefit hotel location selection or recommendation. Third, the duration that tourists stay in the revisited territories (i.e., chosen as the accommodation location for a second time) is significantly longer than that of newly explored territories. According to certain correlations found between tourists’ risk perception, satisfaction level with the destination, and their intention to revisit (Hasan, Ismail, and Islam Citation2017), place A taken as the revisited accommodation place by returning travelers (A – B – A) might indicate a higher level of satisfaction or lower level of risk perception by international tourists.
Practical Implications at the Population Level
At the population level, the proposed model can be applied to uncover both the intradestination and interdestination characteristics of tourist travel. Tourist microscale activity space reflects intradestination level characteristics. The activity space of tourists accommodated in different areas of a destination (e.g., a city) demonstrates different spatiotemporal characteristics that uncover the heterogeneity of the urban tourism environment. For example, areas where the mean number of attractions visited is lower than average and the mean ROG is larger than average indicate lower accessibility to tourist attractions or a lack of tourist resources in these areas. This could provide reference for tourist resource allocation in urban destinations. The macroscale interdestination-level travel characteristics uncover the roles and functions of cities in the tourism system. For destinations with complementary functions, the government, stakeholders, or NGOs could encourage potential cooperation between them, such as route planning for interdestination tourism shuttle buses, itinerary design for package tours (Bowie and Chang Citation2005), and the development of multidestination tourism schemes (e.g., Greater Bay Area multidestination tourism in China, multidestination tourism corridors in Islamic countries).
Methodological Implications
The proposed activity space representation also contributes to the study of tourism geography methodologically. It captures tourist activity space better than spatial indicators such as ROG and two-dimensional ellipses because the proposed representation considers the difference in spatial scales between short-distance travels around single accommodations and long-distance movements between accommodation locations. Different from existing studies using mobile phone data for analyzing tourist movement that focus on quantifying tourist time use (Xu, Li, et al. Citation2021) or deriving overall statistical properties (Xu, Xue, et al. Citation2021), the proposed activity space representation enables a new and efficient way to automatically categorize tourist activity space from massive mobility observations. Given the meaningful location sequences and the correspondence with visiting timestamps, our framework would extract key components, derive the backbones of activity space, and categorize them into certain types. It complements traditional methods like surveys that focus more on group-level statistics and lack perspective from the individual level.
Broad Implications on General Human Mobility Research and Limitations of This Research
Besides, for general human travel outside of a tourism context, Sahasrabuddhe, Lambiotte, and Alessandretti (Citation2021) also indicated the nature of polycentricity of human mobility, which, in our framework, is represented by multiple territories. Therefore, the proposed representation can also be applied or further extended as a generic framework to delineate complex forms and dynamics of human activity space, for example, to depict changes of residential locations and associated activity space (J. Huang et al. Citation2018; Y. Zhou et al. Citation2021), or represent multiday mobility motifs (Yang et al. Citation2017; Cao et al. Citation2021).
The study is subject to some limitations that guide the directions for future work. The detection of activity location involves clustering, which is based on a fixed threshold distance. A spatially adaptive approach considering the spatial heterogeneity of cell tower distribution, however, could lead to activity patterns at finer levels and yield valuable insights for understanding tourists’ spatiotemporal behavior, which could be a possible direction for future work. Subject to the two-week data set, some longer journeys might be recorded incompletely. This might lead to a slight overestimation of the proportion of short-time visitors (e.g., single-NAP travelers), which is the systematic bias of the empirical results. Adopting data sets of longer visitor trajectories would mitigate this problem. Given the nature of positioning data, it is hard to consider contextual determinants of behavior (Spielman and Singleton Citation2022), for instance, implying the reasons behind travelers’ change of accommodation. Coupled with other types of data (e.g., survey data, travel diaries), the proposed presentation can help us better understand the tourists’ decision-making process and behavioral logic of changing accommodation locations. Moreover, further study can be done on the distance distribution between territories, the spatial relationship between territories, and the side trips between territories, which are among the components of the proposed framework not yet discussed by the case study presented in this article. The data set adopted also has spatial limitations. Because the data set only documents tourists’ locations when they are in South Korea, the empirical results are confined by the study area. Actually, the proposed activity space representation framework is capable of segmenting any trajectories according to the topological structure of the trajectory regardless of their actual locations. Given the trajectory of an individual’s complete itinerary, the framework can also automatically generate the cross-scale representation of activity space, which would bring useful knowledge to local tourism. Comparative study across countries is a possible direction for future study.
Disclosure Statement
No potential conflict of interest was reported by the authors.
Additional information
Funding
Notes on contributors
Xinyue Chen
XINYUE CHEN is currently a PhD Student in the Department of Land Surveying and Geo-Informatics at the Hong Kong Polytechnic University, Hung Hom, Kowloon, Hong Kong. E-mail: [email protected]. Her research interests include human mobility and urban informatics.
Yang Xu
YANG XU is an Assistant Professor in the Department of Land Surveying and Geo-Informatics at the Hong Kong Polytechnic University, Hung Hom, Kowloon, Hong Kong. E-mail: [email protected]. His research interests include GIScience, human mobility, and urban informatics.
Sangwon Park
SANGWON PARK is Professor at the College of Hotel and Tourism Management, Kyung Hee University, Seoul, Republic of Korea. E-mail: [email protected]. His research interests include tourism big data, information technology, and travel behavior.
Yimin Chen
YIMIN CHEN is an Associate Professor in the School of Geography and Planning at the Sun Yat-sen University, Guangzhou, China. E-mail: [email protected]. His research interests include urban modeling, urban remote sensing, and machine learning applications.
Xintao Liu
XINTAO LIU is an Associate Professor in the Department of Land Surveying and Geo-Informatics at the Hong Kong Polytechnic University, Hung Hom, Kowloon, Hong Kong. E-mail: [email protected]. His research interests focus on GIS, human mobility, and transport geography, and his research goal is to use state-of-the-art technologies to advance smart cities for a better urban life.
Chengxiang Zhuge
CHENGXIANG ZHUGE is an Assistant Professor in the Department of Land Surveying and Geo-Informatics at the Hong Kong Polytechnic University, Hung Hom, Kowloon, Hong Kong. E-mail: [email protected]. His research interests include smart mobility, urban simulation, and spatial planning.
References
- Barbosa, H., M. Barthelemy, G. Ghoshal, C. R. James, M. Lenormand, T. Louail, R. Menezes, J. J. Ramasco, F. Simini, and M. Tomasini. 2018. Human mobility: Models and applications. Physics Reports 734:1–74. doi: 10.1016/j.physrep.2018.01.001.
- Beritelli, P., S. Reinhold, and C. Laesser. 2020. Visitor flows, trajectories and corridors: Planning and designing places from the traveler’s point of view. Annals of Tourism Research 82:102936. doi: 10.1016/j.annals.2020.102936.
- Birinci, H., K. Berezina, and C. Cobanoglu. 2018. Comparing customer perceptions of hotel and peer-to-peer accommodation advantages and disadvantages. International Journal of Contemporary Hospitality Management 30 (2):1190–1210. doi: 10.1108/IJCHM-09-2016-0506.
- Bowie, D., and J. C. Chang. 2005. Tourist satisfaction: A view from a mixed international guided package tour. Journal of Vacation Marketing 11 (4):303–22. doi: 10.1177/1356766705056628.
- Cao, J., Q. Li, W. Tu, Q. Gao, R. Cao, and C. Zhong. 2021. Resolving urban mobility networks from individual travel graphs using massive-scale mobile phone tracking data. Cities 110:103077. doi: 10.1016/j.cities.2020.103077.
- Chen, G., A. C. Viana, and M. Fiore. 2018. Takeaways in large-scale human mobility data mining. In 2018 IEEE International Symposium on Local and Metropolitan Area Networks (LANMAN), 55–60. Piscataway, NJ: IEEE. doi: 10.1109/LANMAN.2018.8475047.
- Chen, Y.-S., and S.-T. Wu. 2021. An exploration of actor-network theory and social affordance for the development of a tourist attraction: A case study of a jimmy-related theme park, Taiwan. Tourism Management 82:104206. doi: 10.1016/j.tourman.2020.104206.
- Cooper, C. 1981. Spatial and temporal patterns of tourist behaviour. Regional Studies 15 (5):359–71. doi: 10.1080/09595238100185351.
- Diao, M., Y. Zhu, J. Ferreira, Jr., and C. Ratti. 2016. Inferring individual daily activities from mobile phone traces: A Boston example. Environment and Planning B: Planning and Design 43 (5):920–40. doi: 10.1177/0265813515600896.
- Flognfeldt, T., Jr. 1999. Traveler geographic origin and market segmentation: The multi trips destination case. Journal of Travel & Tourism Marketing 8 (1):111–24. doi: 10.1300/J073v08n01_07.
- Golledge, R. G. 1997. Spatial behavior: A geographic perspective. New York: Guilford.
- Golledge, R. G., and R. J. Stimson. 1987. Analytical behavioural geography. London and New York: Routledge & Kegan Paul.
- Gonzalez, M. C., C. A. Hidalgo, and A.-L. Barabasi. 2008. Understanding individual human mobility patterns. Nature 453 (7196):779–82. doi: 10.1038/nature06958.
- Grauwin, S., S. Sobolevsky, S. Moritz, I. Gódor, and C. Ratti. 2015. Towards a comparative science of cities: Using mobile traffic records in New York, London, and Hong Kong. In Computational approaches for urban environments, ed. M. Helbich, J. Jokar Arsanjani, and M. Leitner, 363–87. Berlin: Springer.
- Grinberger, A. Y., N. Shoval, and B. McKercher. 2014. Typologies of tourists’ time–space consumption: A new approach using GPS data and GIS tools. Tourism Geographies 16 (1):105–23. doi: 10.1080/14616688.2013.869249.
- Hägerstrand, T. 1970. What about people in regional science? Papers of the Regional Science Association 24:6–21.
- Harding, C., Z. Patterson, L. F. Miranda-Moreno, and S. Zahabi. 2012. Modeling the effect of land use on activity spaces. Transportation Research Record: Journal of the Transportation Research Board 2323 (1):67–74. doi: 10.3141/2323-08.
- Hardy, A., A. Birenboim, and M. Wells. 2020. Using geoinformatics to assess tourist dispersal at the state level. Annals of Tourism Research 82:102903. doi: 10.1016/j.annals.2020.102903.
- Hasan, M. K., A. R. Ismail, and M. F. Islam. 2017. Tourist risk perceptions and revisit intention: A critical review of literature. Cogent Business & Management 4 (1):1412874. doi: 10.1080/23311975.2017.1412874.
- Heiler, G., T. Reisch, J. Hurt, M. Forghani, A. Omani, A. Hanbury, and F. Karimipour. 2020. Country-wide mobility changes observed using mobile phone data during COVID-19 pandemic. In 2020 IEEE International Conference on Big Data (Big Data), 3123–32. Piscataway, NJ: IEEE. doi: 10.1109/BigData50022.2020.9378374.
- Huang, J., D. Levinson, J. Wang, J. Zhou, and Z.-J. Wang. 2018. Tracking job and housing dynamics with smartcard data. Proceedings of the National Academy of Sciences of the United States of America 115 (50):12710–15. doi: 10.1073/pnas.1815928115.
- Huang, X., M. Li, J. Zhang, L. Zhang, H. Zhang, and S. Yan. 2020. Tourists’ spatial-temporal behavior patterns in theme parks: A case study of Ocean Park Hong Kong. Journal of Destination Marketing & Management 15:100411. doi: 10.1016/j.jdmm.2020.100411.
- Iovan, C., A.-M. Olteanu-Raimond, T. Couronné, and Z. Smoreda. 2013. Moving and calling: Mobile phone data quality measurements and spatiotemporal uncertainty in human mobility studies. In Geographic information science at the heart of Europe, ed. D. Vandenbroucke, B. Bucher, and J. Crompvoets, 247–65. Cham, Switzerland: Springer.
- Kang, C., X. Ma, D. Tong, and Y. Liu. 2012. Intra-urban human mobility patterns: An urban morphology perspective. Physica A: Statistical Mechanics and Its Applications 391 (4):1702–17. doi: 10.1016/j.physa.2011.11.005.
- Koo, T. T., C.-L. Wu, and L. Dwyer. 2010. Transport and regional dispersal of tourists: Is travel modal substitution a source of conflict between low-fare air services and regional dispersal? Journal of Travel Research 49 (1):106–20. doi: 10.1177/0047287509336468.
- Koo, T. T., C.-L. Wu, and L. Dwyer. 2012. Dispersal of visitors within destinations: Descriptive measures and underlying drivers. Tourism Management 33 (5):1209–19. doi: 10.1016/j.tourman.2011.11.010.
- Kou, Z., and H. Cai. 2019. Understanding bike sharing travel patterns: An analysis of trip data from eight cities. Physica A: Statistical Mechanics and Its Applications 515:785–97. doi: 10.1016/j.physa.2018.09.123.
- Lancaster, K. J. 1966. A new approach to consumer theory. Journal of Political Economy 74 (2):132–57. doi: 10.1086/259131.
- Lee, J. H., A. W. Davis, S. Y. Yoon, and K. G. Goulias. 2016. Activity space estimation with longitudinal observations of social media data. Transportation 43 (6):955–77. doi: 10.1007/s11116-016-9719-1.
- Leiper, N. 1989. Main destination ratios: Analyses of tourist flows. Annals of Tourism Research 16 (4):530–41. doi: 10.1016/0160-7383(89)90007-8.
- Lew, A. A., and B. McKercher. 2002. Trip destinations, gateways and itineraries: The example of Hong Kong. Tourism Management 23 (6):609–21. doi: 10.1016/S0261-5177(02)00026-2.
- Lew, A., and B. McKercher. 2006. Modeling tourist movements: A local destination analysis. Annals of Tourism Research 33 (2):403–23. doi: 10.1016/j.annals.2005.12.002.
- Li, M., S. Gao, F. Lu, and H. Zhang. 2019. Reconstruction of human movement trajectories from large-scale low-frequency mobile phone data. Computers, Environment and Urban Systems 77:101346. doi: 10.1016/j.compenvurbsys.2019.101346.
- Lue, C.-C., J. L. Crompton, and D. R. Fesenmaier. 1993. Conceptualization of multi-destination pleasure trips. Annals of Tourism Research 20 (2):289–301. doi: 10.1016/0160-7383(93)90056-9.
- Mazey, M. E. 1981. The effect of a physio-political barrier upon urban activity space. Ohio Journal of Science 81 (5-6):212–17.
- McKercher, B., and G. Lau. 2008. Movement patterns of tourists within a destination. Tourism Geographies 10 (3):355–74. doi: 10.1080/14616680802236352.
- McKercher, B., and J. Zoltan. 2014. Tourist flows and spatial behavior. In The Wiley Blackwell companion to tourism, ed. A. A. Lew, C. M. Hall, and A. M. Williams, 33–44. UK: Wiley.
- Miller, H. J. 2008. Time geography. In Encyclopedia of GIS, ed. S. Shekhar and H. Xiong, 1151–56. Boston: Springer.
- Mings, R. C., and K. E. McHugh. 1992. The spatial configuration of travel to Yellowstone National Park. Journal of Travel Research 30 (4):38–46. doi: 10.1177/004728759203000406.
- Mooses, V., S. Silm, T. Tammaru, and E. Saluveer. 2020. An ethno-linguistic dimension in transnational activity space measured with mobile phone data. Humanities and Social Sciences Communications 7 (1):1–13. doi: 10.1057/s41599-020-00627-3.
- Nicosia, V., J. Tang, C. Mascolo, M. Musolesi, G. Russo, and V. Latora. 2013. Graph metrics for temporal networks. In Temporal networks, ed. P. Holme and J. Saramäki, 15–40. Heidelberg, New York, Dordrecht, and London: Springer.
- Oppermann, M. 1992. Travel dispersal index. Journal of Tourism Studies 3 (1):44–49.
- Oppermann, M. 1995. A model of travel itineraries. Journal of Travel Research 33 (4):57–61. doi: 10.1177/004728759503300409.
- Orellana, D., A. K. Bregt, A. Ligtenberg, and M. Wachowicz. 2012. Exploring visitor movement patterns in natural recreational areas. Tourism Management 33 (3):672–82. doi: 10.1016/j.tourman.2011.07.010.
- Páez, A., R. Gertes Mercado, S. Farber, C. Morency, and M. Roorda. 2010. Relative accessibility deprivation indicators for urban settings: Definitions and application to food deserts in Montreal. Urban Studies 47 (7):1415–38. doi: 10.1177/0042098009353626.
- Pappalardo, L., F. Simini, S. Rinzivillo, D. Pedreschi, F. Giannotti, and A.-L. Barabási. 2015. Returners and explorers dichotomy in human mobility. Nature Communications 6 (1):1–8. doi: 10.1038/ncomms9166.
- Parroco, A. M., F. Vaccina, S. De Cantis, and M. Ferrante. 2012. Multi-destination trips and tourism statistics: Empirical evidences in Sicily. Economics 6 (1):1. doi: 10.5018/economics-ejournal.ja.2012-44.
- Paulino, I., L. Prats, and P. A. Whalley. 2020. Establishing influence areas of attractions in rural destinations. Tourism Planning & Development 17 (6):611–35. doi: 10.1080/21568316.2019.1673811.
- Pearce, D. G., and J. M. C. Elliott. 1983. The trip index. Journal of Travel Research 22 (1):6–9. doi: 10.1177/004728758302200102.
- Pérez-Rodríguez, J. V., and J. M. Hernández. 2022. The effect of type of lodging and professionalism on the efficiency of p2p accommodation. Tourism Economics :135481662211142. doi: 10.1177/13548166221114228.
- Ranjan, G., H. Zang, Z.-L. Zhang, and J. Bolot. 2012. Are call detail records biased for sampling human mobility? ACM SIGMOBILE Mobile Computing and Communications Review 16 (3):33–44. doi: 10.1145/2412096.2412101.
- Raun, J., R. Ahas, and M. Tiru. 2016. Measuring tourism destinations using mobile tracking data. Tourism Management 57:202–12. doi: 10.1016/j.tourman.2016.06.006.
- Raun, J., N. Shoval, and M. Tiru. 2020. Gateways for intra-national tourism flows: Measured using two types of tracking technologies. International Journal of Tourism Cities 6 (2):261–78. doi: 10.1108/IJTC-08-2019-0123.
- Saberi, M., H. S. Mahmassani, D. Brockmann, and A. Hosseini. 2017. A complex network perspective for characterizing urban travel demand patterns: Graph theoretical analysis of large-scale origin–destination demand networks. Transportation 44 (6):1383–1402. doi: 10.1007/s11116-016-9706-6.
- Sahasrabuddhe, R., R. Lambiotte, and L. Alessandretti. 2021. From centre to centres: Polycentric structures in individual mobility. arXiv preprint arXiv:2108.08113. doi: 10.48550/arXiv.2108.08113.
- Schönfelder, S., and K. W. Axhausen. 2003. Activity spaces: Measures of social exclusion? Transport Policy 10 (4):273–86. doi: 10.1016/j.tranpol.2003.07.002.
- Sherman, J. E., J. Spencer, J. S. Preisser, W. M. Gesler, and T. A. Arcury. 2005. A suite of methods for representing activity space in a healthcare accessibility study. International Journal of Health Geographics 4 (1):1–21. doi: 10.1186/1476-072X-4-24.
- Shoval, N. 2012. Time geography and tourism. In The Routledge handbook of tourism geographies, ed. J. Wilson, 189–95. London and New York: Routledge.
- Shoval, N., B. McKercher, E. Ng, and A. Birenboim. 2011. Hotel location and tourist activity in cities. Annals of Tourism Research 38 (4):1594–1612. doi: 10.1016/j.annals.2011.02.007.
- Song, C., T. Koren, P. Wang, and A.-L. Barabási. 2010. Modelling the scaling properties of human mobility. Nature Physics 6 (10):818–23. doi: 10.1038/nphys1760.
- Song, C., Z. Qu, N. Blumm, and A.-L. Barabási. 2010. Limits of predictability in human mobility. Science 327 (5968):1018–21. doi: 10.1126/science.1177170.
- Spielman, S. E., and A. D. Singleton. 2022. A generalized model of activity space. Annals of the American Association of Geographers 112 (8):2212–29. doi: 10.1080/24694452.2022.2077165.
- Stoffelen, A., D. Ioannides, and D. Vanneste. 2017. Obstacles to achieving cross-border tourism governance: A multi-scalar approach focusing on the German-Czech borderlands. Annals of Tourism Research 64:126–38. doi: 10.1016/j.annals.2017.03.003.
- Sugimoto, K., K. Ota, and S. Suzuki. 2019. Visitor mobility and spatial structure in a local urban tourism destination: GPS tracking and network analysis. Sustainability 11 (3):919. doi: 10.3390/su11030919.
- Tussyadiah, I. P., T. Kono, and H. Morisugi. 2006. A model of multidestination travel: Implications for marketing strategies. Journal of Travel Research 44 (4):407–17. doi: 10.1177/0047287505282950.
- UN World Tourism Organization (UNWTO). 2015. Glossary of tourism terms. Accessd October 27, 2021. https://www.unwto.org/glossary-tourism-terms.
- UN World Tourism Organization (UNWTO). 2019. UNWTO world tourism barometer and statistical annex, May 2019. UNWTO World Tourism Barometer (English Version) 17 (2). Annex-5 & Annex-12.
- Wong, D. W., and S.-L. Shaw. 2011. Measuring segregation: An activity space approach. Journal of Geographical Systems 13 (2):127–45. doi: 10.1007/s10109-010-0112-x.
- Xia, J. C., and C. Arrowsmith. 2005. Managing scale issues in spatio-temporal movement of tourists modeling. In Proceedings of the International Congress on Modelling and Simulation, MODSIM, ed. H. R. Arabnia, 162–69. Las Vegas: Citeseer.
- Xu, Y., J. Li, J. Xue, S. Park, and Q. Li. 2021. Tourism geography through the lens of time use: A computational framework using fine-grained mobile phone data. Annals of the American Association of Geographers 111 (5):1420–44. doi: 10.1080/24694452.2020.1812372.
- Xu, Y., S.-L. Shaw, Z. Zhao, L. Yin, Z. Fang, and Q. Li. 2015. Understanding aggregate human mobility patterns using passive mobile phone location data: A home-based approach. Transportation 42 (4):625–46. doi: 10.1007/s11116-015-9597-y.
- Xu, Y., S.-L. Shaw, Z. Zhao, L. Yin, F. Lu, J. Chen, Z. Fang, and Q. Li. 2016. Another tale of two cities: Understanding human activity space using actively tracked cellphone location data. Annals of the American Association of Geographers 106 (2):489–502.
- Xu, Y., J. Xue, S. Park, and Y. Yue. 2021. Towards a multidimensional view of tourist mobility patterns in cities: A mobile phone data perspective. Computers, Environment and Urban Systems 86:101593. doi: 10.1016/j.compenvurbsys.2020.101593.
- Yang, L., L. Wu, Y. Liu, and C. Kang. 2017. Quantifying tourist behavior patterns by travel motifs and geo-tagged photos from Flickr. ISPRS International Journal of Geo-Information 6 (11):345. doi: 10.3390/ijgi6110345.
- Yuan, Y., and X. Wang. 2018. Exploring the effectiveness of location‐based social media in modeling user activity space: A case study of Weibo. Transactions in GIS 22 (4):930–57. doi: 10.1111/tgis.12450.
- Yuan, Y., and Y. Xu. 2022. Modeling activity spaces using big geo-data: Progress and challenges. Geography Compass 16 (11):1. doi: 10.1111/gec3.12663.
- Zhao, P., Z. Ma, J. Chen, R. Law, Y. Zhang, and Y. Liu. 2022. Depicting urban multi-scale tourist activity spaces using digital footprints for smart destinations. Current Issues in Tourism :1–16. doi: 10.1080/13683500.2022.2104696.
- Zhongming, Z., L. Linong, Z. Wangqiang, and L. Wei. 2020. OECD tourism trends and policies 2020. Paris: OECD.
- Zhou, L., and Y. Ji. 2018. Study on job-housing distribution and human activity space based on mobile phone data. In CICTP 2017: Transportation reform and change—Equity, inclusiveness, sharing, and innovation, ed. H. Wang, J. Sun, J. Lu, L. Zhang, Y. Zhang, and S. Fang, 215–25. Reston, VA: American Society of Civil Engineers. doi: 10.1061/9780784480915.022.
- Zhou, Y., J.-C. Thill, Y. Xu, and Z. Fang. 2021. Variability in individual home-work activity patterns. Journal of Transport Geography 90:102901. doi: 10.1016/j.jtrangeo.2020.102901.
Appendix
Figure A.1. Spatial and temporal characteristics of subtypes: Exploratory travelers ().
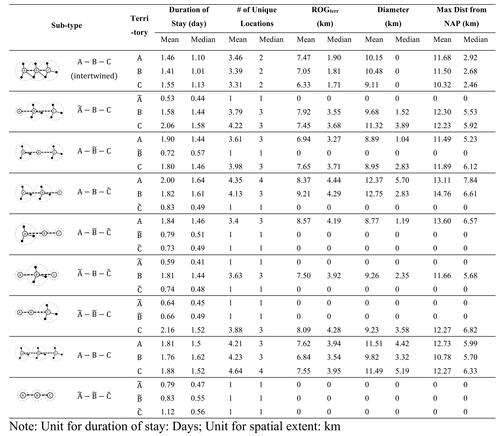
Figure A.2. Spatial and temporal characteristics of subtypes: Returning travelers ()