
Abstract
Travelers’ day-to-day mobility depends on their perceptions, experiences, and personal characteristics. Many accessibility measures overlook perceptual factors and mainly consider space–time limitations of mobility, overestimating travelers’ potential mobility. We introduce a novel inclusive accessibility concept that advances time-geographic accessibility measures in light of travel behavior theories. We conceptualize inclusive accessibility as a subset of the classic space–time prism (STP) that incorporates hard constraints (e.g., limited infrastructure and services and time) and soft constraints (e.g., perceptions of safety and comfort toward the built environment and infrastructure and travel time preferences). We collected survey data on individual-level mobility perceptions and applied machine learning algorithms to predict personalized soft constraints for walking. Considering public transit and walking, we model and compare three network-based STPs: classic STP with hard constraints, inclusive STP with soft spatial constraints, and inclusive STP with soft spatial and temporal constraints. Our method demonstrates heterogeneities in individuals’ mobility perceptions. We illustrate that the individual’s level of accessibility shrinks substantially as we approach more conservative measures that include travel perceptions. Our method highlights the differences between travelers’ physically and psychologically accessible space depending on their travel choices and exposure.
旅行者的日常流动性取决于旅行者的感知、经历和个人特点。许多可及性指标考虑了流动性的时空限制, 但忽略了感知因素, 高估了旅行者的潜在流动性。针对旅行行为理论的时间地理可及性度量, 我们引入了一个新的概念——包容可及性。我们将包容可及性概念化为经典时空棱镜(STP)的子集:硬约束(例如, 有限的基础设施、服务和时间)和软约束(例如, 对建成环境、基础设施和旅行时间偏好的安全感和舒适感)。我们收集了个人流动性感知调查数据, 应用机器学习算法预测了步行的个人软约束。对于公共交通和步行, 我们对三种网络STP进行建模和对比:硬约束的经典STP、软空间约束的包容STP、软空间和时间约束的包容STP。我们的方法证明了个体流动性感知的异质性。采用旅行感知的更保守度量, 大大降低了个人可及性。我们强调了旅行选择和接触所带来的旅行者身体和心理可及空间的差异。
La movilidad cotidiana de los viajeros depende de sus percepciones, experiencias y características personales. Varias medidas de accesibilidad pasan por alto los factores perceptivos y solo prestan atención a las limitaciones espaciotemporales de la movilidad, sobreestimando la movilidad potencial de los viajeros. Presentamos un nuevo concepto de accesibilidad incluyente que extiende las medidas de accesibilidad geográfico-temporales a la luz de las teorías de comportamiento de viaje. Conceptualizamos la accesibilidad incluyente como un subconjunto del clásico prisma espacio–tiempo (STP) que incorpora limitaciones duras (e.g., infraestructura y servicios limitados, y tiempo) y limitaciones blandas (e.g., percepciones de seguridad y comodidad hacia el entorno edificado y las preferencias de infraestructura y tiempo de viaje). Recogimos los datos de encuestas sobre percepciones de movilidad a nivel individual y aplicamos algoritmos de aprendizaje automático para predecir las limitaciones blandas personalizadas de los desplazamientos pedestres. Al considerar el tránsito público y los desplazamientos pedestres, modelamos y comparamos tres STPs basados en redes: el STP clásico con limitaciones duras, el STP incluyente con limitaciones blandas, y el STP incluyente con limitaciones espaciales y temporales blandas. Nuestro método demuestra las heterogeneidades en las percepciones de movilidad de los individuos. Ilustramos que el nivel de accesibilidad del individuo se contrae sustancialmente a medida que nos aproximamos a medidas más conservadoras que incluyen la percepción del viaje. Nuestro método destaca las diferencias entre el espacio física y psicológicamente accesible de los viajeros, dependiendo de sus elecciones y exposición de viaje.
Travel needs, patterns, and experiences within urban settings vary across people of different age, gender, income, and life stage. Factors affecting travel behavior (e.g., attitudes, perceptions, and personal experiences) bridge the connection between these varied travel needs and actual travel (Alfonzo Citation2005; Singleton and Clifton Citation2015; Ma and Cao Citation2019). Depending on their attitudes and perceptions toward the built environment, people could experience different mobility barriers within the same travel environment (e.g., availability of infrastructures and opportunity locations, road surface conditions, safety, and cleanliness; Ma and Cao Citation2019). Individuals’ day-to-day travel is a trade-off between their travel needs and perceptions of mobility constraints.
Over the years, transportation researchers have developed models predicting human travel behavior (Alfonzo Citation2005; Burbidge and Goulias Citation2009; Singleton and Clifton Citation2015). These theories suggest that nonautomobile travel behavior is influenced by not only physical ability, time, and monetary budget (Alfonzo Citation2005; Singleton and Clifton Citation2015), but also mobility perceptions and experiences with the built environment (Handy, Cao, and Mokhtarian Citation2005; Götschi et al. Citation2017). Similarly, transit and active transportation usage is affected by safety perceptions, which vary by age, gender, and personal experiences (Sönmez and Graefe Citation1998; Spears, Houston, and Boarnet Citation2013; Abenoza et al. Citation2018). Addressing these perceptual mobility constraints through built environment changes, such as redesigning road infrastructure and restructuring land-use patterns, could influence individual attitudes toward active and transit travel and reduce car usage (Taylor et al. Citation2009; Tracy et al. Citation2011; Zhang et al. Citation2012; Schoner, Cao, and Levinson Citation2015; Aziz et al. Citation2018; De Vos, Ettema, and Witlox Citation2018; Rahman and Sciara Citation2022). Despite its significance, few studies demonstrate the applications of individual-level behavioral aspects in designing multimodal transportation systems, including transit, biking, and walking. One of the reasons for this limitation is the tedious nature of capturing the intricate details of human travel behavior and its underlying heterogeneity.
Person-based accessibility measures account for the spatiotemporal complexities involved in human mobility (Miller Citation2017); thus, it offers an effective framework to incorporate heterogeneous travel perceptions in accessibility. Person-based accessibility measures quantify a person’s ability to reach essential services and opportunity locations (e.g., jobs, health care, and green space) from key locations (e.g., home, work, or a neighborhood), based on scheduling constraints imposed by required activities that are fixed in space and time (Levinson and Wu Citation2020). Such measures typically adopt the concepts of time geography, including the ability to trade time for space in movement (Hagerstrand Citation1970; Kim and Kwan Citation2003). In other words, time geography assumes that people get longer activity participation time at a location if they travel shorter and vice versa. Person-based accessibility uses this time-geographic concept of space–time budgeting to identify a person’s potential course of action. Past studies have developed extensions of person-based space–time accessibility measures to capture constraints such as network and non-network barriers and costs (Neutens et al. Citation2008; Miller and Bridwell Citation2009; Lee and Miller Citation2019).
Although powerful, the classic person-based accessibility measures are physicalist in nature (Thrift Citation1977) and limited in capturing diverse travel perceptions and their influences on actual travel (van der Vlugt, Curl, and Wittowsky Citation2019; J. Ryan and Pereira Citation2021). Due to this neglect of the implicit barriers or frictions experienced by people with different socioeconomic backgrounds, these measures can overestimate accessibility by preventing the physical accessibility limits expressed by space–time measures from being fully realized. For example, previous research indicates clear gender and age differences in perceived safety and comfort levels in walking and biking through different built environments and street designs (Yavuz and Welch Citation2010; Delbosc and Currie Citation2012; Le et al. Citation2019). This can introduce biases in accessibility measures for some social groups and travel episodes that are overlooked by classic space–time measures (Kwan Citation1999).
This study introduces concepts and measures of inclusive accessibility to address the limitations of classic access. Inclusive accessibility reflects heterogeneous travel perceptions that can vary across individuals and social groups. Inclusive access is an attenuated version of classic access that considers both physical and perceptual travel constraints. Where classic accessibility estimates potential mobility based on physical space–time limits only, inclusive accessibility also incorporates perceptions that can attenuate physical accessibility. The shift from classic to inclusive measures allows planners and policymakers to understand equity and fairness in locating transportation infrastructure and essential services that are likely to vary across different population groups with diverse financial and physical abilities, risk perceptions, and acceptance.
The inclusive accessibility concept categorizes accessibility constraints into hard and soft constraints. Hard constraints capture the physical space–time limitations toward travel (e.g., travel time budget, location of fixed activities, and activity duration), whereas soft constraints are personal perceptions toward the land-use–transportation environment and time. We develop a person-based inclusive accessibility measure that accounts for hard and soft constraints using time-geography concepts and machine learning (ML) techniques. The objectives of this article are first, to formulate an individual-level inclusive accessibility measure integrating both hard and soft constraints, and second, to exemplify the variations in inclusive accessibility across travelers using case studies from a mobility survey. This study focuses on measuring inclusive accessibility considering public transit and walking only, although it applies to other travel modes.
The article makes several contributions. It is the first to develop a person-based accessibility measure that incorporates the perceptions and attitudinal factors as soft constraints, therefore making the prior physicalist measures more realistic. In addition, we curate a novel data collection approach for capturing individual-level mobility perceptions and use ML algorithms to quantify individual-level soft constraints from the data set. Policymakers and practitioners can adopt similar data collection approaches on a larger scale for the real-life implementation of this study.
The rest of the article is structured as follows. The “Background” section summarizes the past literature on travel behavior and accessibility to highlight the research gap and the importance of this study. We then discuss the conceptual framework of inclusive accessibility. The “Data” and “Method” sections describe, respectively, data requirements and model criteria. We then present findings from case studies demonstrating the application of the inclusive accessibility concept in measuring person-based accessibility. In the “Discussion” section, we assess the merits, limitations, and future potentials of our concept, and we conclude the article by outlining future research directions.
Background
In this section, we summarize travel behavior research demonstrating the influences of spatiotemporal, built-environment, and socioeconomic factors on human travel behavior and its variations across social groups. Next, we discuss the criteria and methods used in the past person-based accessibility measures. Finally, we overview the current studies that underscore the differences between accessibility measures with and without considering mobility perceptions.
Social Differences in Travel Behavior and Mode Choices
Travel behavior research underscores the influences of personal behavior (e.g., choice, perception, habit, attitude) and sociodemographics in characterizing human travel and activities (Burbidge and Goulias Citation2009; Van Acker, Van Wee, and Witlox Citation2010; Goulias Citation2018). In particular, this research suggests that personal preferences toward the built environment (e.g., network and land use) play an essential role in travelers’ travel decisions and choices for active transportation (Singleton and Clifton Citation2015; Götschi et al. Citation2017). For instance, people generally prefer walking or biking on complete and connected pedestrian–bike infrastructures (Howard and Burns Citation2001; Khatri et al. Citation2016). In contrast, other street characteristics, including mixed-traffic lanes, higher speed, heavy traffic volume, a higher number of intersections and traffic signals, and on-street parking, are the primary reasons behind the current lack of interest in active travel among people (Sener, Eluru, and Bhat Citation2009; Khatri et al. Citation2016; Le et al. Citation2019).
Safety perception developed through personal sense of places and past travel experiences is another major determinant of travelers’ mode choice decisions. Travelers prefer to walk and bike more in their familiar neighborhoods and routes, considering them safe, walkable, or bike-friendly regardless of their network type and road characteristics (Howard and Burns Citation2001; Voorhees et al. Citation2010). Also, experienced and frequent transit and bike riders are often less concerned about these safety issues than others (Sener, Eluru, and Bhat Citation2009; Delbosc and Currie Citation2012).
Additionally, people’s willingness and time preferences for multimodal travel vary by their trip purposes and overall travel attitudes. As opposed to car travel, transit, biking, and walking are less preferred for work travel as individuals often perceive these modes as time-consuming, stressful, and unsafe (Heinen and Bohte Citation2014; Li, Huang, and Axhausen Citation2020; McKenzie Citation2014; Young, Allen, and Farber Citation2020). In fact, low-income populations often choose car travel over other inexpensive travel options to save travel time and increase activity participation opportunities (Ettema et al. Citation2010; Blumenberg Citation2017).
Finally, travelers tend to make trade-offs between these perceptual factors in their daily mode choice decisions, depending on their age, gender, income levels, life stage, and personal experiences (Alfonzo Citation2005; Singleton and Clifton Citation2015; Ma and Cao Citation2019). For instance, women, children, and older adults are generally more concerned about personal well-being and security related to crime and other harassment during public transit rides or active travel at certain times of the day, such as evening or night hours (Yavuz and Welch Citation2010; Delbosc and Currie Citation2012; Le et al. Citation2019). Choices to ride transit also differ within social groups based on their residential locations in urban and suburban areas and the availability of transit services (Mercado et al. Citation2012; Paez et al. Citation2010). Likewise, older adults, despite being the group most interested in walking, consider themselves more vulnerable than others due to the lack of proper pedestrian facilities and higher risks of crashes and injuries (Lachapelle and Cloutier Citation2017; Arranz-López et al. Citation2019). This study aims to capture these diverse mobility perceptions and their influences on travelers’ potential mobility across individuals and social groups.
Space–Time Accessibility Measures
Accessibility refers to the ability to reach activities and opportunities (Levinson and Wu Citation2020). Accessibility measures are broadly classified into two categories: place-based (or location-based) and person-based (or individual-based; Geurs and Van Wee Citation2004). Place-based measures quantify the proximity of facilities from the origin based on distance or travel time (Levinson and Wu Citation2020). Place-based measures are typically static and generalized concepts and cannot address the dynamic and individualistic nature of human travel behavior and traffic conditions (Miller Citation2005). In contrast, the person-based accessibility measure highlights the time-varying nature of human travel and activity across space. Specifically, these measures represent the opportunities or services accessible by individuals from their origin, considering their personal activity pattern and their scheduling and coordination with the built environment (e.g., land use and transportation; Kwan Citation1998). In addition, person-based accessibility measures can accommodate an individual’s physical, social, and economic constraints to travel. This method is appreciated for its microlevel analytical approach to studying intricate human travel behavior patterns.
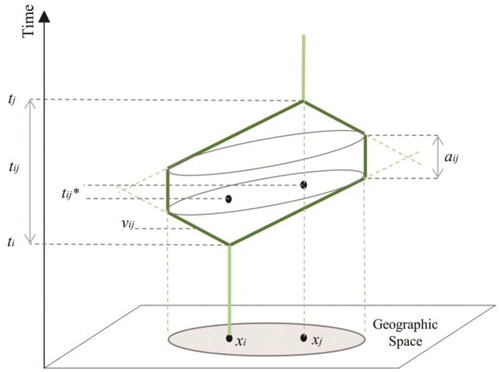
Time geography theory conceptualizes time and space as limited resources and analyzes the space–time allocations of humans to determine their potential course of action within their surrounding physical environment (Hagerstrand Citation1970; Thrift Citation1977). The most common quantification approaches to person-based accessibility are time-geography-based space–time prism (STP) and potential path area (PPA). STP is a three-dimensional construct representing accessibility in geographic space with respect to time, constrained by anchors such as a fixed origin, fixed destination, or a fixed origin–destination pair. Based on these anchor locations and times, a person can participate in activities subject to his or her time budget and other constraints, including the speed limits afforded by different transportation modes (Kim and Kwan Citation2003; Miller Citation2005; Neutens et al. Citation2008). STP contains two parts: forward cones and backward cones. The forward cones identify all space–time locations reachable from the origin within a travel time budget. Conversely, the backward cone captures all space–time locations from where an individual could arrive at the destination within the same travel time budget (Delafontaine, Neutens, and Van de Weghe Citation2011). Finally, the STP measure is a subset of the space–time points in the forward and backward cone where a traveler can start from the origin, reach a flexible activity location, and stay at least for the minimum activity participation time, then arrive at the destination within a time budget.
The PPA is the projection of STP to geographic space. A PPA contains all locations that can be reached between two fixed activity locations and times using a fixed travel time budget and other costs (Kim and Kwan Citation2003; Miller Citation2017). illustrates PPA derived from a general STP. The gray area on the horizontal x-axis presents the PPA between point locations xi and xj, considering the travel time window tij and minimum activity participation time aij (Miller Citation2005).
Figure 1. Space–time prism and associated potential path area. Based on Miller (Citation2005).
Recent decades have seen many extensions and elaborations of the classic STPs. These studies mainly focus on a better representation of the physical travel environment, strategies for dealing with nonuniform time-varying network properties (e.g., travel velocity, traffic volume, and congestion), and consequent travel uncertainties. For instance, the network time prism captures variable travel speeds along static or dynamic transportation networks (Miller Citation2008; Neutens et al. Citation2008). Other network-based STP measures, such as robust prism and reliable STP, are stochastic and quantify uncertainties and travel delays (Chen et al. Citation2013; Song and Miller Citation2014; Song et al. Citation2016; Lee and Miller Citation2020). These network-based STP measures are often presented as a two-dimensional potential network area (PNA), illustrating the network space accessible to a person based on his or her activity locations, time budget, and other network properties (Miller Citation2008).
Other non-network elements of the built and natural environment (e.g., elevation, water bodies, buildings, and restricted areas) often cause similar impedance to movement in accessibility, captured in some STP extensions, namely field-based prism and rough prism (Miller and Bridwell Citation2009; Delafontaine, Neutens, and Van de Weghe Citation2011; Liu, Yan, and Chow Citation2015). As indicated, these past STP measures are mainly physicalist and only consider the spatiotemporal limitations of human travel and activity participation. In most cases, existing accessibility measures overlook perceived constraints that might affect people’s potential to reach their destinations.
Perception-Based Accessibility Measures
Past literature contains very few studies that acknowledge the limitations of physicalist space–time accessibility measures. Most studies follow a qualitative geographic information systems (GIS)-based mixed-method approach initiated by feminist geographers to embed gendered experiences and social and behavioral theories within the positivist and empiricist framework of GIS (Kwan and Knigge Citation2006; Cope and Elwood Citation2009). Some pioneering work includes STP measures by Kwan and Hong (Citation1998), where they overlaid individuals’ PPAs with the opportunities located in their preferred or familiar areas, rated by the participants on a gridded map. In another study, Kwan (Citation1999) underscored the underlying gender biases in STP measures as women participate more in multipurpose travel in their daily life, adding higher levels of space–time constraints in terms of their access to urban opportunities. Other similar studies also analyze qualitative information (e.g., narratives and sketch maps from interviews and focus group discussions) using geospatial tools to explain the impacts of gendered and life experiences of individuals on daily mobility and accessibility (Kwan and Ding Citation2008; Boschmann Citation2011; Mennis, Mason, and Cao Citation2013; Tiznado-Aitken et al. Citation2020). Although effective, the data collection approaches adopted in these studies are quite time-consuming and do not support the quantitative analysis required to integrate travel perceptions into classic STP measures.
A few recent studies have coined the term perceived accessibility, which refers to the apparent ease of reaching opportunity locations using the available urban transportation system (Cheng and Chen Citation2015; Lättman, Olsson, and Friman Citation2016, Citation2018; Ryan et al. Citation2016; van der Vlugt, Curl, and Wittowsky Citation2019; Pot, van Wee, and Tillema Citation2021). These studies categorize accessibility constraints into two parts: objective and subjective measures. The objective measures are the space–time limitations considered in the past accessibility literature. On the other hand, the subjective measures are the perception-based factors that contribute to an individual’s travel decisions and mode choices, such as mode preferences by activity type (Lättman, Olsson, and Friman Citation2016, Citation2018; Ma and Cao Citation2019), perceived ability to reach activities using transit and walking (Cheng and Chen Citation2015; Ryan et al. Citation2016; J. Ryan and Pereira Citation2021), and overall perception of time and built environment as an outcome of human cognitive processes (Ma and Cao Citation2019; Pot, van Wee, and Tillema Citation2021). Regardless of the diverse considerations of subjective measures, these studies underscore that accessibility using objective measures causes overestimation compared to perceived accessibility (Gebel et al. Citation2011; Lättman, Olsson, and Friman Citation2016, Citation2018; Ma and Cao Citation2019; J. Ryan and Pereira Citation2021). These studies also point out the differences in accessibility by age, gender, lifestyle, and residential locations (Cheng and Chen Citation2015; Tiznado-Aitken et al. Citation2020). Most of the past research on perceived access is measured at an aggregate level that might be ineffective in preserving the distinctive nature of travel perceptions.
Conceptual Framework
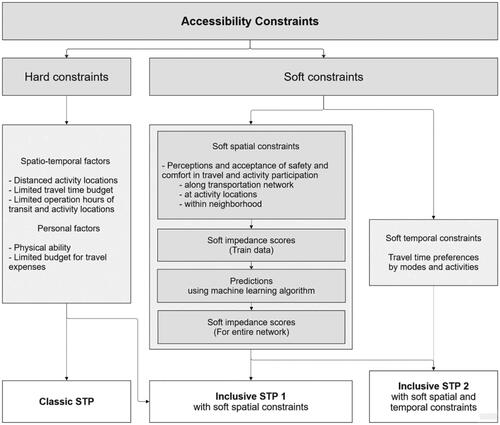
Inclusive accessibility is an STP measure considering a person’s physical and perceptual ability to reach activity locations. The inclusive STP is a modification of classic STP that contextualizes an individual’s space–time limitations of travel along with his or her perceived mobility barriers. To accomplish these properties, the inclusive STP categorizes accessibility constraints into hard and soft constraints. provides a general framework of the inclusive accessibility approach used in this study.
Figure 2. Framework for measuring person-based inclusive accessibility. Note: STP = space–time prism.
Hard and Soft Constraints
Hard constraints refer to the physical and objective constraints that a traveler must fulfill to travel and participate in activities. These constraints are typically explicit, easily quantifiable, out of an individual’s control, and universally applied to everyone. Noncompliance with these constraints could restrict an individual from traveling. These constraints are predominantly spatiotemporal, such as distanced activity locations, limited travel time budget, and limited operation hours of transit and business activities. Personal limitations such as physical disability, limited income, and a fixed budget for travel expenses can also be hard constraints as they sometimes limit people from traveling.
Soft constraints represent the perceptual and subjective factors that individuals negotiate to make a trip viable to them. Compared to hard constraints, soft constraints are implicit and more personally varied, such as travelers’ overall attitude, risk perceptions, and acceptance. Note that soft constraints might reflect travelers’ spatial and temporal perceptions. Soft spatial constraints include travelers’ perceptions and acceptance of safety and comfort for certain travel modes and activities given the surrounding environments (e.g., land use and transportation). The soft spatial constraints are context-dependent and can be measured in any geographic units: along transportation networks, at activity locations, and within neighborhoods.
Classic STP considers travel time budget a hard constraint and estimates it as available time for flexible activities given a traveler’s scheduling of required activities. Available time might be longer than a person’s preferred time to travel by each travel mode and to any destination. Inclusive accessibility treats time as a hard constraint when estimated conventionally and a soft constraint when derived as time preference. Similarly, other hard and soft constraints might not be mutually exclusive and vary from person to person. For instance, personal constraint, such as mobility disabilities, is a soft constraint for a person who can still travel at a slower pace but only to certain areas with wheelchair access. Similarly, safety, both traffic and crime related, might not always be perceptual. People might strictly avoid some crime-prone areas; in this case, it can be a hard constraint.
Measuring accessibility requires extensive data on hard and soft constraints. Data on hard constraints (e.g., transportation infrastructure, mobility services, and activity locations) are easily available from secondary data sources. Data on soft spatial constraints, however, are limited, require time-consuming primary data collection, and do not guarantee extensive data coverage, which is problematic for incorporating soft constraints into accessibility measures.
ML prediction algorithms can help overcome this limitation (). First, we can aggregate multiple soft constraints into a composite soft impedance score. Next, we train an ML algorithm that uses the soft impedance score from primary data as output. The input of this ML model can be any potential determinants of soft impedance score (e.g., characteristics of land use and transportation infrastructure, built and natural environment, and personal attributes). Finally, we predict the soft impedance score of the entire study area using the trained model. The most appropriate choice to construct inclusive STP is to collect data on hard and soft constraints along transportation networks, given that three core elements of an STP construct are anchors, a transportation network, and a velocity to traverse along the network (Miller Citation2017). We can collect sample data and predict soft impedance using ML at any geographic unit (e.g., streets, activity locations, neighborhoods), though, and embed them within the transportation network through spatial operations.
Inclusive Space–Time Prism
Inclusive STP is conceptualized as a subset of the classic STP that (1) is physically realizable (hard constraints), and (2) meets a minimum threshold with respect to individual perceptions and acceptance of safety and comfort. We develop two types of inclusive STPs: The first considers soft spatial constraints only, and the other considers both soft spatial and temporal constraints.
The inclusive STP with soft spatial constraints identifies the geographic coverage that is physically and psychologically accessible to a person from the activity location, considering their soft spatial constraints and other hard constraints specified in the classic STP. Inclusive STP with soft spatial and temporal constraints further considers time preferences with other hard and soft constraints. Thus, each STP construct is a subset of the previous one as they account for more individual-level travel perceptions and are more representative of the day-to-day travel that one might undertake using multiple modes.
Data
Primary Data
We collected primary data on individuals’ daily travel patterns and experiences through a mobility survey. We focus on Columbus, Ohio, neighborhoods with higher percentages of public and active transportation usage both by choice and necessity. We recruited participants via advertisements on social media sites such as Facebook and Nextdoor, neighborhood commission meetings, and local social events.
Our mobility survey includes three steps: baseline, smartphone-based pop-up survey, and end survey. The baseline and end survey have questions on day-to-day travel patterns, preferences toward traveling by specific modes (transit and walking), and demographics. In addition, we display example photos of Columbus roads (captured from Google Street View) to learn about travelers’ perceptions of safety, comfort, and willingness to use multiple modes within those road environments. We chose the sample roads in the baseline and end survey that represent the diverse travel environment of Columbus and allow us to maximize the intrapersonal variability in soft spatial constraints. The pop-up survey involves using the ArcGIS Field maps mobile app to complete surveys and a travel log over a week. During this survey, travelers took photos of some road segments on their routes and filled out similar information on safety, comfort, and willingness to use specific modes.
We have 100 street photos rated by each traveler who completed all survey steps. We use the following statements to rate each street photo using a Likert scale ranging from 1 (strongly disagree) to 5 (strongly agree).
I am willing to walk on this road.
I feel safe from crashes when walking on this road.
The surrounding environment is pleasant.
This article analyzes results from forty travelers with complete survey data sets of 100 data points and trip data to demonstrate and illustrate our method.
Secondary Data
We collected secondary data on the existing road infrastructure and the built environment. provides the data descriptions and their respective sources.
Table 1. Data description of road, sidewalk, and built environment attributes collected from secondary sources
Method
This study demonstrates inclusive accessibility using network-based soft constraints that evaluate an individual’s travel perceptions along Columbus streets and time preferences for walking and transit use. We only consider the forward cones of network-based STP that identify parts of transportation networks reachable from a specific origin considering a traveler’s hard and soft constraints. We present these classic and inclusive STP constructs as two-dimensional PNA measures for effective interpretation. provides a schematic diagram of measuring classic and inclusive access used in this study.
Figure 3. Schematic diagram of measuring classic and inclusive access used in this study. Note: PNA = potential network area.
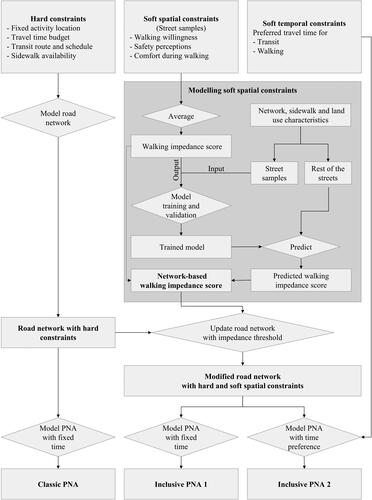
Modeling Hard Constraints
This study considers three indicators to denote hard constraints: a fixed activity location, a fixed travel time budget, and public transit routes and schedules. We find travelers’ fixed activity locations from their trip data. For each traveler, we identify the origin and destination of each trip during the seven-day pop-up survey period. Then, we apply the density-based spatial clustering (DBSCAN) algorithm to locate the most visited areas of the travelers (Sander et al. Citation1998; Campello, Moulavi, and Sander Citation2013). We use a minimum of five points in a cluster and a threshold distance of 400 m. We assume that the top cluster with the highest number of points contains the traveler’s home location and use the centroid of that cluster as the fixed activity location of the respective traveler. We also collect transit route availability and schedules from static General Transit Feed Specification (GTFS) data of 6 December 2021 (GTFS Citation2020).
Modeling Soft Constraints
The middle block in explains the process of modeling soft spatial constraints. In this study, the ratings collected through the street surveys regarding willingness to walk, safety perception, and comfort in traveling within different road environments are considered soft spatial constraints. To simplify our method and calculation, we develop a walking impedance score as a composite indicator of the soft spatial constraints. The walking impedance score represents the mean of walking willingness, safety, and comfort within the surrounding environment for each traveler. The variables used to derive walking impedance scores do not require normalization, as they are all on the same 1-to-5 scale.
Because each traveler rates only a sample of Columbus streets (n = 100), we use their individual survey responses as a training data set and apply ML algorithms to predict the walking impedance scores for the rest of the Columbus network. The output variable for the prediction models is the walking impedance score of each Columbus street, with values ranging from 1 to 5, where 1 represents the highest impedance, and 5 represents the least impedance. We use all variables listed in as input data for predicting walking impedance scores.
We prepare training data sets for each individual by performing one-hot encoding for categorical variables and min-max scaling for continuous variables. Next, we perform cross-validation using repeated k-fold (sevenfold, three repeats) to evaluate model choices. We compare stochastic gradient descent, random forest (RF), multilayer perceptron, and support vector regressor (SVR) and use mean absolute error (MAE) in assessing model performances. Finally, we apply SVR with radial basis function (RBF) kernel and RF for modeling individual-level network-based impedance scores.
Based on our selected model, we use 80 percent of our data set for hyperparameter tuning and model training, the rest for validation, and finally, we predict walking impedance scores for the entire street network of Columbus for each traveler. Using randomized search cross-validation, the model optimizes gamma, C, and epsilon parameters for the SVR models and the number of trees, maximum features, maximum depth, minimum samples split, minimum samples leaf, and bootstrap parameters for the RF models (Smola and Schölkopf Citation2004; Probst, Wright, and Boulesteix Citation2019). Once tuned, we estimate network-based walking impedance scores separately for each traveler.
In addition to the walking impedance score as a soft spatial constraint, we apply travelers’ preferred travel times for public transit use and walking as soft temporal constraints. These variables indicate travelers’ attitudes toward using specific modes regardless of the characteristics of the surrounding travel environment.
Classic PNA Based on Hard Constraints
The assumption for measuring classic PNA is that travelers start their trip at 8.00 a.m. on a regular weekday from an activity location, presumably their home location. We use the sidewalk availability and public transit route and schedule to model the road network with hard constraints. Then we apply a fixed travel time budget of sixty minutes to delineate the road networks that are physically accessible to this person from the activity location (leftmost column in ). We perform this analysis separately for each traveler in our study using an ArcGIS Network Analyst with Python script.
Inclusive PNA with Soft Spatial Constraints (IPNA 1)
The inclusive PNA follows the same procedure stated in the previous section, with additional consideration of walking impedance scores to represent the soft spatial constraints. We convert the classic measure to the inclusive accessibility approach by modifying the network and excluding the streets with a walking impedance score less than or equal to 3 (disagree to neutral). This modified network represents a walking-friendly travel environment based on the traveler’s perceptions. Using this modified road network, we identify parts of road networks that are not only physically accessible but also feel accessible to this person from the fixed activity location using a fixed travel time budget of sixty minutes and public transit schedules (middle column in ).
Inclusive PNA with Soft Spatial and Temporal Constraints (IPNA 2)
In this step, we modify our inclusive PNA modeling criteria and use the travelers’ transit and walking time preferences instead of a fixed travel time budget (the right-most column in ). This inclusive PNA model also uses the modified network that eliminates streets with higher walking impedances. The inclusive PNA developed in this step outlines the road network that is physically and psychologically accessible to this person and fulfills his or her mode-specific travel time preferences.
Estimating the Differences in Classic and Inclusive Accessibility
We estimate the differences in accessibility for each traveler based on the three PNA measures: a classic PNA with hard constraints, an inclusive PNA with soft spatial constraints (IPNA 1), and an inclusive PNA with soft spatial and temporal constraints (IPNA 2). First, we calculate the area accessible by each person using a 50-m buffer along their identified network of PNAs. Then, we calculate the percentage changes in accessible areas for both inclusive PNAs using the accessible area by the classic PNA as a reference. We also replicate this analysis using buffer distances of 75 m and 100 m to examine its sensitivity to buffer distances.
Case Studies
Soft Constraints Model Performance and Selection
summarizes the average MAEs estimated by performing cross-validations using four ML algorithms for each user. Overall, the average MAE values of the user-specific cross-validated SVR and RF models are the lowest, indicating their better performances than the other two models.
Table 2. Average mean absolute errors estimated from user-specific cross-validations for model performance evaluation
Prediction of Network-Based Walking Impedance Scores as Soft Constraints
Considering similar model performances, we predict each user’s walking impedance scores for the entire network using their individual SVR and RF models. In the individual-level RF models, the MAE values in the train data set range from 0.04 to 0.70 with a mean and standard deviation of 0.36 and 0.17, respectively, whereas the MAE values in the test data set range from 0.41 to 1.13 with a mean and standard deviation of 0.71 and 0.18, respectively. In the individual-level SVR models, the MAE values in the train data set range from 0.14 to 0.94 with a mean and standard deviation of 0.46 and 0.18, respectively, and the MAE values in the test data set range from 0.37 to 1.29 with a mean and standard deviation of 0.75 and 0.26, respectively. The tuned hyperparameters and MAE of each traveler’s model are provided in and .
illustrates the user-specific distribution of walking impedance scores predicted from SVR. The boxplots present the travelers’ impedance score distributions in descending order of their mean and standard deviation estimated from the SVR predictions. in the Appendix provides the corresponding distributions estimated from RF models. Whereas the travelers’ mean walking impedance scores are quite similar between SVR and RF, the interquartile ranges of the SVR model predictions are comparatively higher than the RF for most travelers. Especially for a few travelers, the RF model predictions are significantly concentrated around their mean, which is not the case for the SVR predictions of the same travelers. Also, the RF model predictions contain more outliers than SVR. These findings suggest that the SVR models might be more consistent and capture a higher level of variance in the data set. Therefore, we choose the SVR model to predict impedance scores for the entire road network and develop inclusive accessibility.
Figure 4. (A) Distribution of walking impedance scores for each user, including both survey responses and predicted scores from support vector regressor. The red dot in each boxplot represents the mean value. (B) Current walking patterns of travelers for different trip purposes. Each column in both plots corresponds to the same traveler.
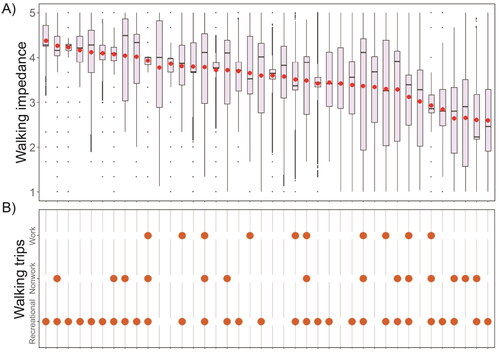
We observe significant differences in walking impedance scores among travelers indicating their varying levels of sensitivity to street characteristics. As we move from the left to the right side of the graph (), travelers become more sensitive to infrastructure and land-use conditions as their mean walking impedance score decreases. Nine travelers from the left are least sensitive, as their mean walking impedance scores are above 4 with comparatively smaller interquartile ranges, reflecting their preference to walk on most Columbus streets. Meanwhile, the mean walking impedance scores are below 3 for the six travelers from the right, indicating their reluctance toward walking. These travelers are perhaps highly sensitive and anticipate higher mobility constraints or unpleasant travel experiences in most parts of Columbus. The mean walking impedance scores of the rest of the travelers fall within—between 3 and 4. These travelers show wide variations in their perceived barriers during walking trips representing their moderate levels of sensitivity toward different travel environments.
illustrates the current walking pattern of these travelers for work, nonwork, and recreational trips, following the same order of travelers illustrated in . For each traveler, a dot in indicates that he or she frequently takes walking trips for daily work commutes (e.g., full- or part-time jobs and schools), or weekly nonwork essential trips (e.g., groceries and health care) and recreational trips (e.g., park, green space, and other entertainment destinations). Apparently, the least sensitive travelers do not walk much except for recreational trips. The highly sensitive travelers mostly walk for nonwork and recreational purposes. Meanwhile, the moderately sensitive travelers who exhibit varied walking preferences based on street characteristics are the experienced pedestrians. They frequently walk for both commuting and noncommuting trips. These travelers’ current transit and car usage are shown in in the Appendix. Most travelers use private vehicles regardless of their trip purpose. Several ride public transit for work trips and very few for nonwork purposes.
Inclusive Accessibility
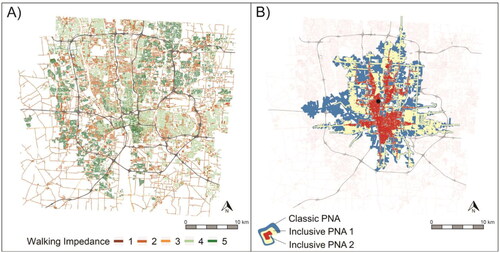
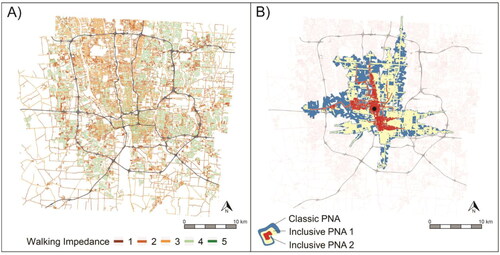
illustrate the differences in walking impedance scores and PNA measures for three representative travelers who are women with different socioeconomic backgrounds. Both Travelers 1 and 2 are White women in their late twenties, where the first person has a full-time job with a moderate income, and the second person has a part-time job with a low income. Traveler 3 is a middle-aged Black woman with a high income and a full-time job. The walking perceptions of these travelers are, respectively, least, moderate, and highly sensitive to street characteristics. The red-to-green color scheme on the left-side figures indicates the Likert scale (disagree to agree) of walking impedance scores of Columbus streets. In , most streets appear in green colors, as this White woman with moderate income perceives no barriers to walking except for a few major arterial roads with higher speeds. In contrast, most streets in are red colored as this middle-aged Black woman finds most streets problematic for walking except those near their fixed activity location. The walking impedance scores from the low-income White woman in , however, display significant variations in their walking preferences. In all cases, the neighborhood streets near their fixed activity locations, presumably their home location, are scored as 5, indicating that they feel comfortable walking around their known neighborhoods.
Figure 5. (A) Predicted walking impedance scores and (B) classic and inclusive potential network area (PNA) for a representative traveler (White woman in late twenties with moderate income and working full time) who is less sensitive to the travel environment.
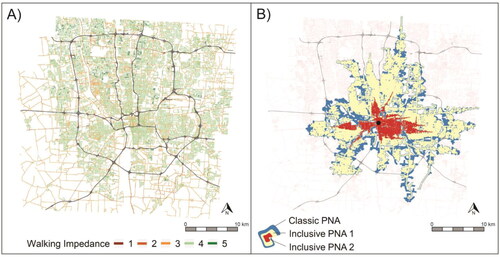
Figure 6. (A) Predicted walking impedance scores and (B) classic and inclusive potential network area (PNA) for a representative traveler (White woman in late twenties with low income and working part time) who is moderately sensitive to the travel environment.
The figures on the right represent their accessibility using classic and inclusive PNA measures. Streets marked in blue, yellow, and red, respectively, outline the classic PNA with hard constraints, inclusive PNA with soft spatial constraints, and inclusive PNA with soft spatial and temporal constraints. For all cases, the area reachable by the traveler shrinks as we approach more conservative measures and include perceptions and time preferences. The deviation between classic PNA and inclusive PNA with walking constraints, however, is minimal for the moderate-income White woman in . In contrast, it makes a significant difference when we also include their travel time preferences for transit and walking. Conversely, we can observe substantial differences in accessible areas delineated by all three PNA measures for travelers in and .
Figure 7. (A) Predicted walking impedance scores and (B) classic and inclusive potential network area (PNA) for a representative traveler (middle-aged Black woman with high income and working full time) who is highly sensitive to the travel environment.
Changes in Accessibility Based on the Considerations of Soft Constraints
shows the areal differences between classic and inclusive PNAs using a 50-m buffer along the network, following the same order of travelers as in . As indicated, the area accessible by inclusive PNAs is smaller compared to the classic PNA for all travelers. When we only consider the soft spatial constraints, however, the percentage decline in IPNA 1 increases with the increase in travelers’ sensitivity to land use and street conditions ().
Figure 8. Percentage decline in area accessible by (A) IPNA 1 and (B) IPNA 2, compared to the classic potential network area (PNA). The accessible area is calculated using a 50-m buffer along the PNA networks.
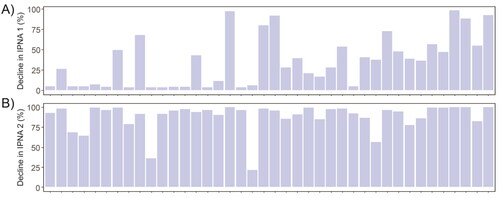
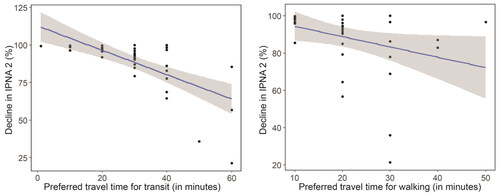
On the other hand, the percentage decline in IPNA 2 is substantial for most travelers, regardless of their sensitivity levels (). In such cases, though, the decline in access negatively correlates with the preferred travel time for transit use and walking (). In other words, regardless of the perceptions of the built environment and safety, the accessible area of travelers decline with their low interest in public transit use and walking. We find similar results from the analysis using 75-m and 100-m buffers, indicating the robustness of this analysis regardless of the buffer distances ( and in the Appendix).
Figure 9. Correlation between mode-specific travel time preferences and the percentage decline in access using inclusive potential network area (PNA) with soft spatial and temporal constraints.
Discussion
Summary of Results
This study conceptualizes an inclusive accessibility measure that integrates physical and perceptual travel barriers as hard and soft constraints. We present a method to measure inclusive accessibility with a mobility survey data set of forty travelers in Columbus, Ohio.
Addressing the heterogeneity in travel perceptions into accessibility measures is a unique contribution of this study. Despite its significance, personal travel perceptions are challenging to capture due to their diverse and distinctive nature. This study overcomes that problem by applying ML algorithms in quantifying individual-level mobility perceptions along the network. This method has the potential for predicting perceptions as impedance or friction parameters in other modeling approaches, such as gravity-based accessibility measures and spatial interaction models.
The study finds that travelers’ perceptions of mobility barriers and accessibility are sensitive to different travel environments where the level of sensitivity varies by their current travel patterns and exposure. On the one hand, travelers who do not walk much at present feel indifferent to street conditions. These travelers perceive Columbus as walkable, perhaps a reflection of their limited exposure to the current walking environment and unawareness of mobility barriers within Columbus. On the other hand, travelers with high sensitivity to street characteristics find Columbus less walkable. These travelers are mainly interested pedestrians but are extremely concerned about the surrounding environments and safety. Their preferred standards for a walking environment are quite high as they occasionally walk, mainly for noncommuting and recreational purposes. The rest of the travelers are mainly frequent pedestrians with a keen interest in active travel with moderate levels of sensitivity to street conditions, consistent with findings from past research (Sener, Eluru, and Bhat Citation2009; Delbosc and Currie Citation2012). They are perhaps aware of the existing sidewalk and pedestrian safety conditions around Columbus, and find it less problematic, especially on frequently visited routes.
Considering travel perceptions and time preferences makes inclusive access more realistic and sensitive to people’s actual travel by eliminating the overestimations of classic measures. For all travelers in this study, this measure is notably smaller than their classic accessibility, indicating overestimation in the latter measure. This finding also resonates with the past accessibility measures using objective (transport infrastructure and built environment) and subjective indicators (mobility perceptions and willingness; Gebel et al. Citation2011; Lättman, Olsson, and Friman Citation2016, Citation2018; Ma and Cao Citation2019; J. Ryan and Pereira Citation2021). Additionally, this study reveals that the magnitude of the decline from classic to inclusive access varies by travelers’ sensitivity to travel environments. This variation dissipates, however, when we consider mode-specific time preferences, and the corresponding inclusive PNA becomes significantly smaller than the classic PNA. This points out overestimations in the fixed travel time budget of sixty minutes assumed in past studies (Ahmed and Stopher Citation2014; Lee and Miller Citation2018, Citation2019; Qin and Liao Citation2021), which we also use to delineate our classic and first inclusive PNA measures. The actual length of transit rides and walking trips that people might prefer to undertake is much shorter than sixty minutes, resulting in substantial differences in classic and the second inclusive PNA measures.
Large-scale application of inclusive access could identify who experiences limited access to where and its socioeconomic differences. For instance, the inclusive accessibility measures for three women illustrate that Black and low-income women are more sensitive to the travel environment and experience higher obstacles than the moderate-income White woman. This finding underscores accessibility inequity for travelers with financial limitations and racially diverse backgrounds. Classic access cannot address such differences due to the assumption of homogenous physical and financial abilities, as well as equal acceptance of risks, standards for comfort, and other constraints. Urban design and infrastructure planning in the United States are historically discriminating, however, leading to substantial differences in ability and perceptions across individuals. Economically and racially disparate communities tend to have lower expectations for comfort as they are already served with poor-quality infrastructure and services and have limited financial ability to spend on travel. Moreover, marginalized populations, as well as women, children, and the elderly, are at a higher risk of physical injuries, assaults, and harassment, making them less acceptant to risks. Our measure accounting for such income, racial, and gendered differences in abilities and perceptions makes it more inclusive to vulnerable communities who are traditionally overlooked by existing accessibility measures.
Limitations and Future Directions
This study has several limitations related to the intensity and representativeness of the data. First, our prediction of walking impedances and accessibility might be more representative of planned travel, such as daily work travel and periodical nonwork travel to essential activities. Second, although we strive to maintain the reliability of survey responses, we cannot verify some of these responses, such as if any travelers’ skewed walking impedance pattern is not an outcome of their inattentive responses. Third, the accuracy of network-level soft constraint measures depends on the sample data size available from each traveler. This study uses a relatively small data set collected from each participant due to time and resource limitations, although a larger data set might have produced better model performances. Finally, the transferability of the person-based models in predicting inclusive access for another traveler of similar characteristics is yet unknown. Specifically, the soft constraints models in this study can predict the mobility perceptions of one individual traveler without providing further guidance on translating these models and findings for another individual outside the sample participants.
Our current application focuses on acceptance and perceptions of safety and comfort along transportation infrastructure because this is a major factor influencing social and gender differences in active travel. This concept and theoretical framework are applicable in other study contexts, however. Future studies could consider other personal hard constraints, as well as activity-related and area-specific soft constraints using the same data collection and modeling mechanism. Future extensions could also update the method of including soft constraints into STP measures and shift from the current deterministic approach to a probabilistic measure with soft constraints integrated as fuzzy logic.
The inclusive accessibility concept recognizes hard and soft constraints as limitations associated with space and time. People also experience certain hard and soft social constraints in travel and activity participation, however. For instance, some social norms and conventions are hard constraints enforcing limited physical access to certain places and activity participation (e.g., age restrictions for visiting bars and social status for accessing certain elite clubs). Again, perceptions of social space (e.g., neighborhood familiarity, sense of belongingness and acceptance, and conformity to other lifestyle choices) are soft constraints that indirectly impede people from traveling to particular destinations. Future studies could consider these social constraints in designing inclusive access.
This research discusses an approach to integrating soft constraints into person-based STP measures. Although effective in exploring the heterogeneities in mobility perceptions, the person-based STP measure has limited capability to generalize the findings to larger populations. As a solution, future research might develop an approach to aggregating person-based inclusive accessibility into a place-based measure that evaluates hard and soft constraints using data from a larger sample of travelers and accounting for their socioeconomic statuses. Building on our findings of accessibility inequity experienced by low-income and racially diverse travelers, future studies with a larger sample size could help quantify the intensity of perceived mobility barriers and limited access among socioeconomically vulnerable communities. Moreover, future research could use the soft constraints and their variations across social groups in demonstrating need-specific transportation network designs with special emphasis on mobility-disadvantaged communities.
Conclusion
This study presents the theoretical background of a novel inclusive accessibility concept and an example method for operationalizing the concept. We develop the person-based inclusive STP that converges space–time limitations as hard constraints and travel perceptions along transportation networks as soft constraints. The results highlight significant variations in the perceived mobility barriers and corresponding inclusive accessibility measures across individuals depending on their current mobility pattern and exposure. The shift from classic to inclusive access lowers potential mobility, identifies a person’s physically and psychologically accessible geographic space, and makes the measure more sensitive to actual travel.
The inclusive accessibility approach might help us locate the inequalities around the urban transportation system from a mobility justice perspective. Researchers and professionals can use this method to understand the spatial differences in perceived mobility barriers and accessibility across socioeconomically diverse communities. Inclusive accessibility could also serve as a performance indicator in evaluating potential transportation investments and identifying their beneficiaries. Thus, inclusive accessibility can facilitate the decision-making process while designing root-level, community-specific transportation plans that aim to replicate personalized and community-specific mobility needs and eliminate their perceived barriers.
Acknowledgments
The study was reviewed and approved by the Institutional Review Board at The Ohio State University (Study title and number: The OSU Inclusive Mobility Study – 2022B0079). The authors contributed to the article as follows: Study conception: Armita Kar, Huyen T. K. Le, and Harvey J. Miller; Design and methods: Armita Kar, Huyen T. K. Le, and Harvey J. Miller; Analysis and software: Armita Kar; Results interpretation: Armita Kar, Huyen T. K. Le, and Harvey J. Miller; Draft manuscript preparation: Armita Kar; Reviewing and editing: Huyen T. K. Le and Harvey J. Miller. All authors reviewed the results and approved the final version of the article.
Disclosure Statement
No potential conflict of interest was reported by the authors.
Correction Statement
This article has been corrected with minor changes. These changes do not impact the academic content of the article.
Additional information
Funding
Notes on contributors
Armita Kar
ARMITA KAR is a PhD Candidate in the Department of Geography and a Research Assistant at the Center for Urban and Regional Analysis, The Ohio State University, Columbus, OH 43210. E-mail: [email protected]. Her research focuses on sustainable transportation, social equity, and spatial analytics.
Huyen T. K. Le
HUYEN T. K. LE is an Assistant Professor in the Department of Geography and a core faculty in the Sustainability Institute at The Ohio State University, Columbus, OH 43210. E-mail: [email protected]. Her research focuses on understanding the environment, health, and equity impacts of urban transportation.
Harvey J. Miller
HARVEY J. MILLER is the Bob and Mary Reusche Chair in Geographic Information Science, Professor in the Department of Geography, and Director of the Center for Urban and Regional Analysis at The Ohio State University, Columbus, OH 43210. E-mail: [email protected]. His research focuses on geospatial and mobility analytics to support sustainable and resilient transportation and cities.
References
- Abenoza, R. F., V. Ceccato, Y. O. Susilo, and O. Cats. 2018. Individual, travel, and bus stop characteristics influencing travelers’ safety perceptions. Transportation Research Record 2672 (8):19–28. doi: 10.1177/0361198118758677.
- Ahmed, A., and P. Stopher. 2014. Seventy minutes plus or minus 10—A review of travel time budget studies. Transport Reviews 34 (5):607–25. doi: 10.1080/01441647.2014.946460.
- Alfonzo, M. A. 2005. To walk or not to walk? The hierarchy of walking needs. Environment and Behavior 37 (6):808–36. doi: 10.1177/0013916504274016.
- Arranz-López, A., J. A. Soria-Lara, F. Witlox, and A. Paez. 2019. Measuring relative non-motorized accessibility to retail activities. International Journal of Sustainable Transportation 13 (9):639–51. doi: 10.1080/15568318.2018.1498563.
- Aziz, H. A., N. N. Nagle, A. M. Morton, M. R. Hilliard, D. A. White, and R. N. Stewart. 2018. Exploring the impact of walk–bike infrastructure, safety perception, and built-environment on active transportation mode choice: A random parameter model using New York City commuter data. Transportation 45 (5):1207–29. doi: 10.1007/s11116-017-9760-8.
- Blumenberg, E. 2017. Social equity and urban transportation. In The geography of urban transportation, 4th ed., ed. G. Giuliano and S. Hanson, 332–58. New York: Guilford.
- Boschmann, E. E. 2011. Job access, location decision, and the working poor: A qualitative study in the Columbus, Ohio metropolitan area. Geoforum 42 (6):671–82. doi: 10.1016/j.geoforum.2011.06.005.
- Burbidge, S., and K. Goulias. 2009. Active travel behavior. Transportation Letters 1 (2):147–67. doi: 10.3328/TL.2009.01.02.147-167.
- Campello, R. J. G. B., D. Moulavi, and J. Sander. 2013. Density-based clustering based on hierarchical density estimates. In Advances in knowledge discovery and data mining, vol. 7819, ed. J. Pei, V. S. Tseng, L. Cao, H. Motoda, and G. Xu,160–72. Berlin: Springer. doi: 10.1007/978-3-642-37456-2_14.
- Chen, B. Y., Q. Li, D. Wang, S. L. Shaw, W. H. K. Lam, H. Yuan, and Z. Fang. 2013. Reliable space–time prisms under travel time uncertainty. Annals of the Association of American Geographers 103 (6):1502–21. doi: 10.1080/00045608.2013.834236.
- Cheng, Y. H., and S. Y. Chen. 2015. Perceived accessibility, mobility, and connectivity of public transportation systems. Transportation Research Part A 77:386–403. doi: 10.1016/j.tra.2015.05.003.
- Cope, M., & Elwood, S., eds. 2009. Qualitative GIS: A mixed methods approach. Newcastle upon Tyne, UK: Sage.
- De Vos, J., D. Ettema, and F. Witlox. 2018. Changing travel behaviour and attitudes following a residential relocation. Journal of Transport Geography 73:131–47. doi: 10.1016/j.jtrangeo.2018.10.013.
- Delafontaine, M., T. Neutens, and N. Van de Weghe. 2011. Modelling potential movement in constrained travel environments using rough space–time prisms. International Journal of Geographical Information Science 25 (9):1389–1411. doi: 10.1080/13658816.2010.518571.
- Delbosc, A., and G. Currie. 2012. Modelling the causes and impacts of personal safety perceptions on public transport ridership. Transport Policy 24:302–09. doi: 10.1016/j.tranpol.2012.09.009.
- Ettema, D., T. Gärling, L. E. Olsson, and M. Friman. 2010. Out-of-home activities, daily travel, and subjective well-being. Transportation Research Part A 44 (9):723–32. doi: 10.1016/j.tra.2010.07.005.
- Gebel, K., A. E. Bauman, T. Sugiyama, and N. Owen. 2011. Mismatch between perceived and objectively assessed neighborhood walkability attributes: Prospective relationships with walking and weight gain. Health & Place 17 (2):519–24. doi: 10.1016/j.healthplace.2010.12.008.
- Geurs, K. T., and B. Van Wee. 2004. Accessibility evaluation of land-use and transport strategies: Review and research directions. Journal of Transport Geography 12 (2):127–40. doi: 10.1016/j.jtrangeo.2003.10.005.
- Götschi, T., A. de Nazelle, C. Brand, and R. Gerike. 2017. Towards a comprehensive conceptual framework of active travel behavior: A review and synthesis of published frameworks. Current Environmental Health Reports 4 (3):286–95. doi: 10.1007/s40572-017-0149-9.
- Goulias, K. G. 2018. Travel behavior models. In Handbook of behavioral and cognitive geography, ed. D. Montello, 56–73. Cheltenham, UK: Edward Elgar. doi: 10.4337/9781784717544.00010.
- General Transit Feed Specification (GTFS). 2020. OpenMobilityData—Public transit feeds from around the world. https://transitfeeds.com/.
- Hagerstrand, T. 1970. What about people in spatial science. Regional Science Association 24:7–21.
- Handy, S., X. Cao, and P. Mokhtarian. 2005. Correlation or causality between the built environment and travel behavior? Evidence from Northern California. Transportation Research Part D 10 (6):427–44. doi: 10.1016/j.trd.2005.05.002.
- Heinen, E., and W. Bohte. 2014. Multimodal commuting to work by public transport and bicycle: Attitudes toward mode choice. Transportation Research Record 2468 (1):111–22. doi: 10.3141/2468-13.
- Howard, C., and E. K. Burns. 2001. Cycling to work in Phoenix: Route choice, travel behavior, and commuter characteristics. Transportation Research Record 1773 (1):39–46. doi: 10.3141/1773-05.
- Khatri, R., C. R. Cherry, S. S. Nambisan, and L. D. Han. 2016. Modeling route choice of utilitarian bikeshare users with GPS data. Transportation Research Record 2587 (1):141–49. doi: 10.3141/2587-17.
- Kim, H. M., and M. P. Kwan. 2003. Space-time accessibility measures: A geocomputational algorithm with a focus on the feasible opportunity set and possible activity duration. Journal of Geographical Systems 5 (1):71–91. doi: 10.1007/s101090300104.
- Kwan, M.-P. 1999. Gender and individual access to urban opportunities: A study using space–time measures. The Professional Geographer 51 (2):211–27. doi: 10.1111/0033-0124.00158.
- Kwan, M. P. 1998. Space–time and integral measures of individual accessibility: A comparative analysis using a point-based framework. Geographical Analysis 30 (3):191–216. doi: 10.1111/j.1538-4632.1998.tb00396.x.
- Kwan, M. P., and G. Ding. 2008. Geo-narrative: Extending geographic information systems for narrative analysis in qualitative and mixed-method research. The Professional Geographer 60 (4):443–65. doi: 10.1080/00330120802211752.
- Kwan, M. P., and X. D. Hong. 1998. Network-based constraints-oriented choice set formation using GIS. Geographical Systems 5:139–62.
- Kwan, M. P., and L. Knigge. 2006. Doing qualitative research using GIS: An oxymoronic endeavor? Environment and Planning A 38 (11):1999–2002. doi: 10.1068/a38462.
- Lachapelle, U., and M. S. Cloutier. 2017. On the complexity of finishing a crossing on time: Elderly pedestrians, timing and cycling infrastructure. Transportation Research Part A 96:54–63. doi: 10.1016/j.tra.2016.12.005.
- Lättman, K., L. E. Olsson, and M. Friman. 2016. Development and test of the Perceived Accessibility Scale (PAC) in public transport. Journal of Transport Geography 54:257–63. doi: 10.1016/j.jtrangeo.2016.06.015.
- Lättman, K., L. E. Olsson, and M. Friman. 2018. A new approach to accessibility—Examining perceived accessibility in contrast to objectively measured accessibility in daily travel. Research in Transportation Economics 69:501–11. doi: 10.1016/j.retrec.2018.06.002.
- Le, H. T., A. West, F. Quinn, and S. Hankey. 2019. Advancing cycling among women: An exploratory study of North American cyclists. Journal of Transport and Land Use 12 (1):1461. doi: 10.5198/jtlu.2019.1461.
- Lee, J., and H. J. Miller. 2018. Measuring the impacts of new public transit services on space–time accessibility: An analysis of transit system redesign and new bus rapid transit in Columbus, Ohio, USA. Applied Geography 93:47–63. doi: 10.1016/j.apgeog.2018.02.012.
- Lee, J., and H. J. Miller. 2019. Analyzing collective accessibility using average space–time prisms. Transportation Research Part D 69:250–64. doi: 10.1016/j.trd.2019.02.004.
- Lee, J., and H. J. Miller. 2020. Robust accessibility: Measuring accessibility based on travelers’ heterogeneous strategies for managing travel time uncertainty. Journal of Transport Geography 86:102747. doi: 10.1016/j.jtrangeo.2020.102747.
- Levinson, D. M., and H. Wu. 2020. Towards a general theory of access. Journal of Transport and Land Use 13 (1):129–58. doi: 10.5198/jtlu.2020.1660.
- Li, A., Y. Huang, and K. W. Axhausen. 2020. An approach to imputing destination activities for inclusion in measures of bicycle accessibility. Journal of Transport Geography 82:102566. doi: 10.1016/j.jtrangeo.2019.102566.
- Liu, X., W. Y. Yan, and J. Y. J. Chow. 2015. Time-geographic relationships between vector fields of activity patterns and transport systems. Journal of Transport Geography 42:22–33. doi: 10.1016/j.jtrangeo.2014.10.005.
- Ma, L., and J. Cao. 2019. How perceptions mediate the effects of the built environment on travel behavior? Transportation 46 (1):175–97. doi: 10.1007/s11116-017-9800-4.
- McKenzie, B. 2014. Modes less traveled—Bicycling and walking to work in the United States: 2008–2012. American Community Survey Reports, 18.
- Mennis, J., M. J. Mason, and Y. Cao. 2013. Qualitative GIS and the visualization of narrative activity space data. International Journal of Geographical Information Science 27 (2):267–91. doi: 10.1080/13658816.2012.678362.
- Mercado, R. G., A. Paez, S. Farber, M. J. Roorda, and C. Morency. 2012. Explaining transport mode use of low-income persons for journey to work in urban areas: A case study of Ontario and Quebec. Transportmetrica 8 (3):157–79. doi: 10.1080/18128602.2010.539413.
- Miller, H. J. 2005. A measurement theory for time geography. Geographical Analysis 37 (1):17–45. doi: 10.1111/j.1538-4632.2005.00575.x.
- Miller, H. J. 2008. Time geography. In Encyclopedia of GIS, ed. S. Shekhar and H. Xiong, 1151–56. Berlin: Springer. doi: 10.1007/978-0-387-35973-1_1383.
- Miller, H. J. 2017. Time geography and space-time prism. In International encyclopedia of geography, ed. D. Richardson, N. Castree, M. F. Goodchild, A. Kobayashi, W. Liu, and R. A. Marston, 1–19. Hoboken, NJ: Wiley. doi: 10.1002/9781118786352.wbieg0431.
- Miller, H. J., and S. A. Bridwell. 2009. A field-based theory for time geography. Annals of the Association of American Geographers 99 (1):49–75. doi: 10.1080/00045600802471049.
- MORPC. 2021. Mid-Ohio open data. Mid-Ohio Open Data. https://public-morpc.hub.arcgis.com/datasets/77fd930263624d339880b6cb0b1da362_0?geometry=-86.331,39.200,-79.393,40.674.
- Neutens, T., N. Van de Weghe, F. Witlox, and P. De Maeyer. 2008. A three-dimensional network-based space–time prism. Journal of Geographical Systems 10 (1):89–107. doi: 10.1007/s10109-007-0057-x.
- Paez, A., R. G. Mercado, S. Farber, C. Morency, and M. Roorda. 2010. Accessibility to health care facilities in Montreal Island: An application of relative accessibility indicators from the perspective of senior and non-senior residents. International Journal of Health Geographics 9 (1):52. doi: 10.1186/1476-072X-9-52.
- Pot, F. J., B. van Wee, and T. Tillema. 2021. Perceived accessibility: What it is and why it differs from calculated accessibility measures based on spatial data. Journal of Transport Geography 94:103090. doi: 10.1016/j.jtrangeo.2021.103090.
- Probst, P., M. N. Wright, and A. Boulesteix. 2019. Hyperparameters and tuning strategies for random forest. WIREs Data Mining and Knowledge Discovery 9 (3):1301. doi: 10.1002/widm.1301.
- Qin, J., and F. Liao. 2021. Space–time prism in multimodal supernetwork–Part 1: Methodology. Communications in Transportation Research 1:100016. doi: 10.1016/j.commtr.2021.100016.
- Rahman, M., and G.-C. Sciara. 2022. Travel attitudes, the built environment and travel behavior relationships: Causal insights from social psychology theories. Transport Policy 123:44–54. doi: 10.1016/j.tranpol.2022.04.012.
- Ryan, J., and R. H. M. Pereira. 2021. What are we missing when we measure accessibility? Comparing calculated and self-reported accounts among older people. Journal of Transport Geography 93:103086. doi: 10.1016/j.jtrangeo.2021.103086.
- Ryan, M., T. G. Lin, J. C. Xia, and T. Robinson. 2016. Comparison of perceived and measured accessibility between different age groups and travel modes at Greenwood Station, Perth, Australia. European Journal of Transport and Infrastructure Research 16 (2). doi: 10.18757/ejtir.2016.16.2.3145.
- Sander, J., M. Ester, H.-P. Kriegel, and X. Xu. 1998. Density-based clustering in spatial databases: The algorithm GDBSCAN and its applications. Data Mining and Knowledge Discovery 2 (2):169–94. doi: 10.1023/A:1009745219419.
- Schoner, J. E., J. Cao, and D. M. Levinson. 2015. Catalysts and magnets: Built environment and bicycle commuting. Journal of Transport Geography 47:100–08. doi: 10.1016/j.jtrangeo.2015.07.007.
- Sener, I. N., N. Eluru, and C. R. Bhat. 2009. An analysis of bicycle route choice preferences in Texas, US. Transportation 36 (5):511–39. doi: 10.1007/s11116-009-9201-4.
- Singleton, P., and K. J. Clifton. 2015. The theory of travel decision-making: A conceptual framework of active travel behavior. Paper presented at the 94th Annual Meeting of the Transportation Research Board, Washington, DC, January 11–15.
- Smola, A. J., and B. Schölkopf. 2004. A tutorial on support vector regression. Statistics and Computing 14 (3):199–222. doi: 10.1023/B:STCO.0000035301.49549.88.
- Song, Y., and H. J. Miller. 2014. Simulating visit probability distributions within planar space-time prisms. International Journal of Geographical Information Science 28 (1):104–25. doi: 10.1080/13658816.2013.830308.
- Song, Y., H. J. Miller, X. Zhou, and D. Proffitt. 2016. Modeling visit probabilities within network-time prisms using Markov techniques: Visit probabilities within network-time prisms. Geographical Analysis 48 (1):18–42. doi: 10.1111/gean.12076.
- Sönmez, S. F., and A. R. Graefe. 1998. Determining future travel behavior from past travel experience and perceptions of risk and safety. Journal of Travel Research 37 (2):171–77. doi: 10.1177/004728759803700209.
- Spears, S., D. Houston, and M. G. Boarnet. 2013. Illuminating the unseen in transit use: A framework for examining the effect of attitudes and perceptions on travel behavior. Transportation Research Part A 58:40–53. doi: 10.1016/j.tra.2013.10.011.
- StreetLight Data, Inc. 2021. StreetLight Data: Transportation analytics on demand. San Francisco: StreetLight Data. https://www.streetlightdata.com/.
- Taylor, B. D., D. Miller, H. Iseki, and C. Fink. 2009. Nature and/or nurture? Analyzing the determinants of transit ridership across US urbanized areas. Transportation Research Part A 43 (1):60–77. doi: 10.1016/j.tra.2008.06.007.
- Thrift, N. J. 1977. An introduction to time-geography. Norwich, UK: Geo Abstracts, University of East Anglia.
- Tiznado-Aitken, I., K. Lucas, J. C. Muñoz, and R. Hurtubia. 2020. Understanding accessibility through public transport users’ experiences: A mixed methods approach. Journal of Transport Geography 88:102857. doi: 10.1016/j.jtrangeo.2020.102857.
- Tracy, A. J., P. Su, A. W. Sadek, and Q. Wang. 2011. Assessing the impact of the built environment on travel behavior: A case study of Buffalo, New York. Transportation 38 (4):663–78. doi: 10.1007/s11116-011-9337-x.
- U.S. Geological Survey. 2021. Landsat 8. https://www.usgs.gov/landsat-missions/landsat-8.
- Van Acker, V., B. Van Wee, and F. Witlox. 2010. When transport geography meets social psychology: Toward a conceptual model of travel behaviour. Transport Reviews 30 (2):219–40. doi: 10.1080/01441640902943453.
- van der Vlugt, A.-L., A. Curl, and D. Wittowsky. 2019. What about the people? Developing measures of perceived accessibility from case studies in Germany and the UK. Applied Mobilities 4 (2):142–62. doi: 10.1080/23800127.2019.1573450.
- Voorhees, C. C., S. Ashwood, K. R. Evenson, J. R. Sirard, A. L. Rung, M. Dowda, and T. L. Mckenzie. 2010. Neighborhood design and perceptions: Relationship with active commuting. Medicine and Science in Sports and Exercise 42 (7):1253–60. doi: 10.1249/MSS.0b013e3181cd5dfd.
- Yavuz, N., and E. W. Welch. 2010. Addressing fear of crime in public space: Gender differences in reaction to safety measures in train transit. Urban Studies 47 (12):2491–2515. doi: 10.1177/0042098009359033.
- Young, M., J. Allen, and S. Farber. 2020. Measuring when Uber behaves as a substitute or supplement to transit: An examination of travel-time differences in Toronto. Journal of Transport Geography 82:102629. doi: 10.1016/j.jtrangeo.2019.102629.
- Zhang, L., A. Nasri, J. H. Hong, and Q. Shen. 2012. How built environment affects travel behavior: A comparative analysis of the connections between land use and vehicle miles traveled in US cities. Journal of Transport and Land Use 5 (3):266. doi: 10.5198/jtlu.v5i3.266.
Appendix
Figure A.1. Distribution of walking impedance scores for each user, including both survey responses and predicted scores from random forest models. The order of travelers follows the same order presented in .
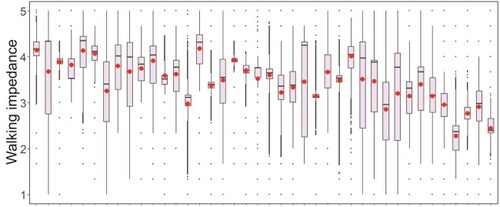
Figure A.2. Transit and car use patterns of travelers for different trip purposes.
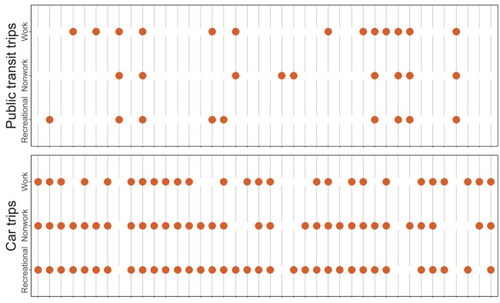
Figure A.3. Percentage decline in area accessible by IPNA 1 and IPNA 2, compared to the classic potential network area (PNA). The accessible area is calculated using a 75-m buffer along the PNAs.
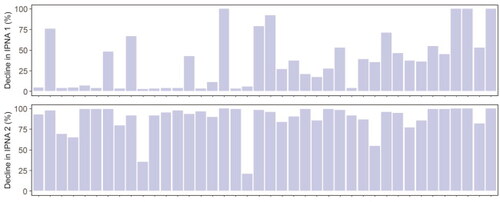
Figure A.4. Percentage decline in area accessible by IPNA 1 and IPNA 2, compared to the classic potential network area (PNA). The accessible area is calculated using a 100-m buffer along the PNAs.
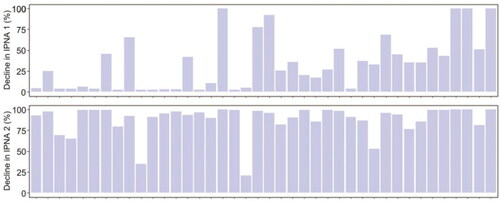
Table A.1. The tuned hyperparameters and mean absolute errors (MAEs) in the train and test set of support vector regressor models
Table A.2. The tuned hyperparameters and mean absolute errors (MAEs) in the train and test set of random forest models.