
Abstract
Community resilience refers to the ability for a geographic area to respond and adapt to acute shocks and long-term stresses. Geography research is well positioned to examine how communities can adapt to the compounding effects of climate change. Our work aims to analyze the factors that influence residential electricity in the context of increasing urban temperatures in Maricopa County, Arizona, coupled with the COVID-19 pandemic. Using census tracts as our basis for analysis, we quantified factors that influence electricity use related to neighborhood characteristics, home structures, social situations, pricing policies, and work-from-home estimates. Our findings suggest that the structure of the home (e.g., number of rooms and house size) influences the variation in residential electricity use, whereas trees and small-area temperatures were not factors. We then compared above-median-income census tracts to those that were below the median income. We found fewer factors influenced electricity use in the lower income census tracts and that they were also related mostly to the home structure. Our analysis did not reveal that working from home was significant, but we did find that the average household size was significant and that the amount of influence increased from 2019 to 2020, suggesting that the stay-at-home policies from the pandemic did affect electricity use. As we consider and implement work-from-home strategies, families need to recognize that the home structure plays a crucial role in determining electricity usage.
社区韧性是一个地区应对和适应突发冲击和长期压力的能力。地理研究能够很好地探讨社区如何适应气候变化带来的复杂影响。在美国亚利桑那州马里科帕县的城市温度升高和新冠肺炎流行的背景下, 本文旨在分析住宅用电的影响因素。以人口普查区为分析基础, 量化了社区特征、房屋结构、社会状况、价格政策和居家工作估计等影响用电的因素。结果表明, 房屋结构(例如, 房间数量和住宅大小)会影响住宅用电的差异, 而树木和小范围温度没有影响。比较了中位数以上收入和中位数以下收入的人口普查区。本文发现, 在低收入人口普查区, 用电的影响因素较少、主要与房屋结构有关。分析并没有表明居家工作的重要性。但是, 平均家庭人口数量很重要, 其影响程度在2019年至2020年有所增加, 这表明疫情期间的居家政策确实影响了用电。在思考和实施居家工作策略时, 家庭需要认识到房屋结构对用电量的重要决定作用。
La resiliencia comunitaria se refiere a la capacidad de un área geográfica para responder a los choques agudos y tensiones de largo alcance, y de adaptarse a los mismos. La investigación geográfica se halla bien posicionada para examinar el modo como las comunidades pueden adaptarse a los efectos agravantes del cambio climático. Nuestro trabajo busca analizar los factores que influyen sobre la electricidad residencial dentro del contexto del aumento de las temperaturas urbanas en el Condado Maricopa, Arizona, en simultánea con la pandemia del COVID-19. Usando los tractos censales como unidades para el análisis, cuantificamos los factores que influyen el uso de la electricidad en relación con las características del vecindario, las estructuras de las viviendas, las instituciones sociales, las políticas de precios y las estimaciones del trabajo desde el hogar. Nuestros hallazgos sugieren que la estructura de la casa (e.g., el número de cuartos y el tamaño de la vivienda) influye sobre la variación en el uso de la electricidad residencial, mientras que los árboles y las temperaturas de áreas pequeñas no fueron factores influyentes. Después, comparamos los tractos censales con ingresos superiores a la media con los que estaban por debajo del ingreso medio. Encontramos que muchos menos factores influyeron el uso de la electricidad en los tractos censales de menores ingreso y que además estaban relacionados principalmente con la estructura de la vivienda. Nuestro análisis no reveló que trabajar desde la casa fuese significativo, aunque sí descubrimos que el tamaño promedio de las viviendas fue significativo y que el grado de tal influencia se incrementó entre 2019 y 2020, lo cual sugeriría que las políticas del tiempo de la pandemia que trataron de inducir el trabajo desde el hogar afectaron el consumo de electricidad. A medida que consideramos e implementamos estrategias de trabajo desde el hogar, las familias deben reconocer que la estructura de la vivienda juega un papel crucial en la determinación del uso de la electricidad.
The United Nations (UN Citation2022) reported that by 2050 there will be 9.7 billion people living on Earth and it is estimated that around 65 percent of that population will be living in urban areas. Urban areas continue to experience social and environmental challenges such as poor air quality, traffic congestion, and extreme poverty (Barthelemy Citation2016; Lemanski Citation2016; Castells-Quintana, Dienesch, and Krause Citation2021). These challenges are amplified by the effects of climate change, which expose urban populations to more frequent and more intense storm events, flooding, and extreme temperatures (Jafino et al. Citation2020; Pour et al. Citation2020). For example, Pour et al. (Citation2020) explored the trade-offs of low-impact development to mitigate the effects of climate-change-induced urban flooding. Furthermore, system-wide shocks rarely act in isolation but rather intersect with preexisting community-wide circumstances including weaknesses in both the physical infrastructure and social systems. For example, one significant impact of global climate change is rising urban temperatures, which have had an amplifying effect on human health, electricity use, food production, human labor, and the economy (Chapman et al. Citation2017; L. Zhao et al. Citation2021). To better understand the effects of urban warming on households and to discover long-term social solutions, we analyze the factors that influence residential electricity usage in the Phoenix metropolitan area in 2019 and 2020. The research engages with geographic research, such as urbanization, climate change, and environmental justice, and features the interrelationships between physical and social systems.
Heat exposure, due to either lack of shelter or the lack of proper indoor cooling, is the primary weather-related cause of death in the United States (Keith, Meerow, and Wagner Citation2019). In the United States, heat-related deaths have been generally on the decline since the 1960s because of the availability of heat-mitigating technologies such as air conditioning and home insulation. Nevertheless risks remain, especially for vulnerable populations, who have greater sensitivity to heat because of the lack of infrastructure like ubiquitous residential air conditioning (Xi et al. Citation2023; Anderson and Bell Citation2011). The problems with heat are compounded when power outages occur during extreme weather events, such as Hurricane Ida in Citation2021. The death toll of Hurricane Ida in the United States reached ninety-one, with 19 percent of those attributed to power outages and high temperatures (Centers for Disease Control Citation2021). This showcases the greater risk of heat to populations who lack mobility or resources to evacuate. Beyond the acute exposure to heat, urban heat is also linked to chronic health concerns such as respiratory disease, allergies due to air quality, growth of mold (tied to respiratory disease), cardiovascular disease, and loss of natural light (psychological effects; Schmeltz and Marcotullio Citation2019; Bobrowska-Korzeniowska et al. Citation2021; Psistaki, Dokas, and Paschalidou Citation2023). Prior studies show that older populations, minority groups, and individuals with chronic health conditions are known to be at high risk for heat-related deaths and illnesses—with some variations depending on the differences in the climate conditions and sociopolitical context (Harlan et al. Citation2013; Hondula et al. Citation2015).
When the COVID-19 pandemic struck, communities were challenged along all fronts of society and these effects were exacerbated in areas with the preexisting negative conditions of climate change and social inequalities. The pandemic mitigated some urban issues (e.g., reduced air pollution, lower urban heat island [UHI]) and exacerbated others (e.g., access to basic needs for vulnerable communities). Ezell et al. (Citation2021) described the combination of social and spatial dynamics that put these challenges into alignment and created deeper patterns of inequality. The pandemic led many to fear the possibility that the way we live and work in our cities, given the stay-at-home orders, would mean higher energy use and costs at home (Ku et al. Citation2022). The pandemic situation, however, offered a natural experiment to compare two time periods and to ask if a massive relocation from office-based work to stay-at-home work could lead to changes in energy consumption.
In this article, our research asks this: What are the physical and social factors that influenced residential electricity consumption in Maricopa County, Arizona, during July 2019 and July 2020? We compare the results of the two summers because the summer of 2019 had typical minimum, maximum, and average temperatures for the area and provides a baseline for understanding the factors related to residential electricity consumption. We then analyzed the influence of these factors for July 2020, when Maricopa County was faced with both COVID-19-related stay-at-home orders and extreme, record-breaking summer temperatures.
Literature Review
The literature relevant for this article includes research on the mitigation and management of urban heat and the relationship of heat to the COVID-19 pandemic. In the first section of the review, we synthesize the literature on the role of electricity consumption for heat-related climate change looking both at strategies for reducing urban heat and social systems to manage heat. The review then turns to the intersection between climate change and the COVID-19 pandemic looking specifically at the interaction between extreme heat and the pandemic.
Mitigating and Managing Heat
Climate change models point to hotter cities, which would exacerbate the already challenging issues on electricity use, human health, and economic prosperity of cities (Patz et al. Citation2005; Santamouris Citation2015). Isaac and Van Vuuren (Citation2009) and Hernández (Citation2013) assessed energy demands in the context of climate change and reported that energy demand for air conditioning alone is projected to increase—driven both by overall income growth and climate change. This will result globally in more greenhouse gas emissions such as CO2, furthering the cycle of climate change and overall risk. Additionally, the Environmental Protection Agency (EPA) and other studies report that the UHI also increases energy costs (Santamouris Citation2015; EPA Citation2022). The UHI is the measurable increase in nighttime temperatures in urban areas due to the physical environment such as pavement and buildings, which absorb and retain heat. Research into the UHI focuses on observations of the UHI, the environmental factors that lead to the UHI, models of the future of the UHI, and the relationship between the UHI and urban features such as water, air quality, poverty, human health, and energy consumption (see Stewart Citation2011; Tzavali et al. Citation2015, for reviews of the UHI literature).
The leading solution to managing hot urban temperatures, including UHI, is heating, ventilation, and air conditioning (HVAC) systems, which remove heat and humidity from inside the home. Although the formula for energy use and costs depends on the external climate (temperature and humidity), as well as internal factors (e.g., thermostat setting, smart sensors, home insulation, home size), other factors that influence electricity use are based on physical characteristics of the urban environment (e.g., outside temperatures, tree shade, building structures), technology-based solutions (e.g., programmable thermostats), and lifestyle and behavioral choices (e.g., adjusting thermostats manually, turning off lights; Kaza Citation2010; Howard et al. Citation2012; Huang Citation2015). Research findings report unequivocally that the size of the home, the housing type, ownership status, and appliance choices drive the levels of energy consumption. Internal factors that affect energy use include energy savings devices (e.g., smart thermostats), the number of people living in the home, the number of children present, the use and availability of room-by-room temperature settings, and home ownership (Kaza Citation2010; Huang Citation2015). Whereas these relationships are known, it is less clear whether neighborhood factors, such as housing density, can uniformly influence energy use (Ewing and Rong Citation2008; Kaza Citation2010). Renewable energy resources are being proposed to mitigate climate change by reducing carbon emissions, but problems emerge such as poor reliability during extreme weather events (Perera et al. Citation2020) and affordability and access to lower income communities (Brown et al. Citation2020; Memmott et al. Citation2021, Citation2023).
Our research builds on prior research in Arizona on heat, public health, and solutions to mitigate risk. Prior research demonstrates the need for improved communication on the risks associated with extreme temperatures, especially for visitors. For example, Iverson et al. (Citation2020) described Maricopa County’s heat-associated mortality surveillance system that describes the circumstances of someone’s death and found that related to heat, more than 50 percent occurred outside, among males, and among people below the age of fifty. Of indoor deaths, the majority were individuals over the age of sixty-five. In a different study on heat in Arizona, Cong et al. (Citation2022) analyzed how households at different income levels respond differently to hotter temperatures finding that the threshold temperature when higher incomes adjust the thermostat is between two and four degrees different, and using this relative metric to categorize energy insecurity reveals that more households are at risk than previously thought.
Although heat in cities is challenging for all residents, there is consensus that lower income neighborhoods, often dominated by minority populations, have higher energy cost burdens, with a larger percentage of income spent on home cooling (Buylova Citation2020; Kontokosta, Reina, and Bonczak Citation2020). This higher cost burden is referred to as energy poverty, which Scheier and Kittner (Citation2022) defined as households that spend 6 percent or more of their income on energy expenditures. For Arizona, Kwon et al. (Citation2023) calculated the additional electricity related to income and outdoor temperatures, showing that households with incomes below $15,000 had higher energy increases compared with higher income households. Energy justice refers to efforts to mitigate energy poverty by making energy accessible and affordable for all, reducing not just costs but lowering the higher numbers of power disconnections (Jenkins et al. Citation2016; Cicala Citation2021; Memmott et al. Citation2023). Jones et al. (Citation2023) suggested that technology considerations are imperative for mitigating the warming climate and addressing energy justice. Cong et al. (Citation2022) expanded on this through a poverty energy metric that includes household behavior (e.g., raising the thermostat to conserve energy), which shows that more households are energy-insecure than an income-only metric shows. Rising heat and rising energy costs are challenges across the board, but adaptation to climate change in cities is particularly burdensome for economically vulnerable households.
Convergence of Crises
Studies on the impacts of COVID-19 in urban areas revealed reduced oil demand, lower traffic congestion, economic strain, schooling outcomes, and increased evictions (Kuzemko et al. Citation2020). For electricity use, the stay-at-home orders coupled with reduced or lost wages meant that families might have opted to keep home thermostats at higher temperatures or delayed making necessary repairs or maintenance to their homes. For example, Memmott et al. (Citation2021) showed that the COVID-19 pandemic increased energy insecurity among households at or below the 200 percent poverty level and that energy insecurity is associated with poor health. Similarly, Lou et al. (Citation2021) reported that in Arizona, energy use in low-income communities increased by 4 to 5 percent during the pandemic.
The pandemic nonetheless provided a natural experiment for researchers around the world to better understand the impacts of human activities on the physical environment, including the UHI effect. There is mounting evidence that the pandemic led to sometimes drastic changes to the UHI in cities around the world including those in India, Iran, Indonesia, China, Australia, Norway, the United States, Japan, Ireland, South Africa, the United Arab Emirates, and many other countries (Alqasemi et al. Citation2021; Parida et al. Citation2021; Shikwambana, Kganyago, and Mhangara Citation2021; Wai et al. Citation2021; Roshan, Sarli, and Fitchett Citation2022; Saputra et al. Citation2022; Weiyu et al. Citation2022). Results show both a smaller spatial extent of the UHI (specially mentioned in Iran) and temperatures reduced by as much as 3 °C. Findings in eight different cities in Spain, for example, show that the stay-at-home order led to a better air quality and lower urban heat, suggesting that local planning can create solutions for areas most vulnerable to climate change (Hidalgo-García and Arco-Díaz Citation2022). This is leading to proposals for new models for sustainable and healthier cities that reduce pollution and negative environmental conditions (Nieuwenhuijsen Citation2021; N. Zhao and You Citation2021). For example, researchers recommend investment in small-area decision-making that considers local meteorological conditions as well as how individual people use public spaces such as parks, transportation hubs, and public buildings (Reinwald et al. Citation2021; Milošević et al. Citation2022). This approach is especially needed in low-income communities where there has been lower investment overall in urban green spaces (Bayulken, Huisingh, and Fisher Citation2021; Bikomeye et al. Citation2021). Nevertheless, there is little understanding of how these urban planning solutions might affect electricity use by individual households.
Our work builds on prior research on pandemic electricity use in Arizona including studies by Ku et al. (Citation2022) and Lou et al. (Citation2021). Both studies show differences in electricity use during the pandemic, and they attribute those differences to stay-at-home orders. Nevertheless, they assume that differences in residential energy use were due to the stay-at-home orders rather than considering the impact of hotter temperatures, which will be the case with the growing impacts of climate change. Understanding this dynamic relationship matters for climate change because remote work might mean a reduction in travel, which decreases CO2 emissions due to fewer home–work–home commutes, but it might also mean increased and perhaps less efficient residential electricity use. We are unable to fully pull apart all factors, such as the use of home-based smart meters, but we can contribute to filling in a gap in this literature by analyzing the factors that influence energy use during a hot summer (2019) with normal work-travel patterns and a hotter summer (2020) with increased amounts of remote work, in the Phoenix, Arizona, metropolitan area.
Study Area
Our study focuses on the factors that influence residential electricity usage in Maricopa County, Arizona (). The total land area of Maricopa County is about 18,710 km2 with an estimated 4.5 million residents in 2019. The selection of Maricopa County for this study was driven in part by the record temperatures in the summer of 2020, the large population affected by these temperatures, and the shifting demographics in the region. Maricopa County continues to rank as one of the fastest growing counties in the United States in both population size and growth in the mix of racial and ethnic diversity. The race and ethnicity of the population is 82.2 percent White, 7.2 percent African American, 2.9 percent Native American, 5.6 percent Asian, and 31.4 percent Hispanic, up from 29.0 percent in 2010.
Figure 1. Maricopa County, Arizona, study area census tracts.
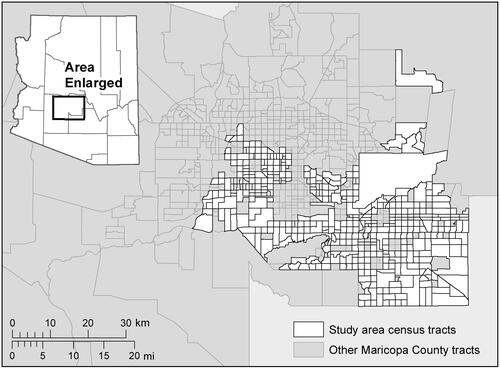
Mild winter temperatures, employment opportunities, and low cost of living are drivers for population growth in the area. During winter months, the annual temperature is around 22 °C, making it a desirable living location. In 2019, the average home cost was $260,200 and the average rent cost was $1,127 (2020 prices). The housing stock of Maricopa County is dominated by single-family detached homes (70.0 percent), followed by 25.4 percent in multifamily complexes ranging from duplexes (two family) to greater than fifty units per structure. Housing pressures persist, but there have been increases to the multiple-family home stock with new duplexes and high-rise home structures, especially focused on downtown Phoenix and the areas surrounding the Phoenix light rail corridors.
The pleasant wintertime temperatures contrast the severe high summertime temperatures, which manifest in both extreme days of exposure and chronic high heat trends. Summer temperatures, which can exceed 48 °C, put individuals at risk for heat illness and death (Chow et al. Citation2012; Fraser et al. Citation2017; C. Wang et al. Citation2022). Utility bills for residents are on average 6 percent higher than the national average with annual income levels that are, on average, 9 percent less than the national average (U.S. Census Citation2023; U.S. Energy Information Administration Citation2023). Summertime temperatures are normally hottest during the months of June, July, and August—with temperatures averaging 28.7 °C, 31.9 °C, and 30.9 °C respectively (National Oceanic and Atmospheric Administration Citation2021). The 2019 minimum, maximum, and mean temperatures were close to normal, but the summer of 2020 broke records, including the maximum temperature recorded to date for the month of July.
For this study, we analyzed residential electricity use across Maricopa County during July 2019 and July 2020. The summer of 2020 was the hottest on record to date, ranking first in the country for the hottest summer. Since then, more records have been broken, establishing a concerning trend. In 2020, there were 144 days that reached 38 °C (100 °F) or higher, compared to an average of 94 days per year based on data from 1896 to 2019. The exceptionally hot summer in 2020 was due in part to the absence of the yearly monsoon, which occurs during July and brings in moisture that provides relief from the hot summer temperatures. In 2020, a high-pressure system was consistently positioned over Southern California or over Arizona, so instead of moist air flowing from the south, resulting in monsoon rains, the flow was dry air from the north or northeast. For the Phoenix metropolitan area, the situation worsened because of the UHI, which continues to drive up nighttime temperatures.
Methods
Data
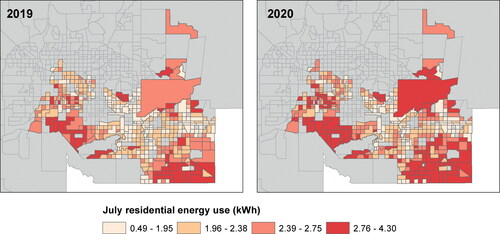
For the dependent variables, we acquired residential electricity use from the Salt River Project (SRP) power company by census tracts for 439 out of the 915 census tracts in Maricopa County. The 439 census tracts in our study are provided residential electricity by SRP, representing 47.8 percent of the county (). The areas within Maricopa County that we did not study are serviced by other power providers and we did not have access to those data. We calculated the average residential household-level electricity consumption by census tract, in mega kilowatt hours (MWh) for the months of July 2019 and 2020. This resulted in two dependent variables. We selected July for the study because this is the hottest month of the summer and was affected by the lack of the monsoon season in 2020.
Figure 2. Average residential electricity usage in 2019 and 2020.
Our independent variables are those variables that the literature reports are factors influencing residential energy use including neighborhood factors, characteristics of the home structure, the social and economic characteristics of residents, and the energy use incentives from SRP (see literature review earlier). Neighborhood factors include features such as overall vegetation coverage, land surface temperature, and density of housing. Housing characteristics focus explicitly on the home structure, namely house size, house age, and the number of rooms. We also examined social structures such as family income, education, and race or ethnicity. We also used the SRP’s policy variables, which are opt-in residential price plans that allow customers to reduce their energy burden by offsetting usage to nonpeak hours. The SRP has eleven different residential plans that differ based on time of use, electric vehicles, residential demand, and on-site power generation (e.g., solar). We used six of these plans in our analysis because some of their plans did not have customers in our study area during this time. The plans we considered are reported in . These plans aim to reduce the cost to customers and are not necessarily intended to reduce overall usage (SRP Citation2022). In addition, we added a work-from-home variable to characterize the number of individuals working at home due to the COVID-19 pandemic in the summer of 2020, estimated based on job classes. lists the variable names and the source of data for those variables.
Table 1. Description of the SRP Residential Price Plans
Table 2. Independent variables, showing data sources and additional notes
Landsat 8 Collection 2 surface temperature products and ASTER surface kinetic temperature products (AST_08) were used to obtain surface temperature measurements for the months of July 2019 and 2020. We created a mean surface temperature image by averaging all the cloud-free images in July, and then calculating mean surface temperature for each census tract.
Land-cover data were obtained from a land-cover map that was published by the Central Arizona–Phoenix Long-Term Ecological Research (Citation2020) at Arizona State University. This map was generated using the 2015 National Agricultural Imagery Program (NAIP) image and an object-based image classification technique. This map has a 1-m resolution with 94 percent overall accuracy and contains eight land-cover classes, including building, impervious surface, bare soil, tree, shrub, grass, water, and cropland. We calculated the percentage of area for each land cover in each census tract, except for cropland.
The number of employees per census tract who worked from home during the summer months of 2020 was estimated from data from the U.S. Census Bureau and the U.S. Bureau of Labor Statistics (BLS) Occupational Employment Statistics and the Standard Occupational Classification (SOC) code from 2020 (BLS Citation2023; U.S. Census Citation2023). The methods we used were described by Baker (Citation2020) and Dingel and Neiman (Citation2020), who developed a way to estimate work from occupations using the six-digit SOC coding. From the analysis, Baker (Citation2020) estimated that 25 percent of the jobs and Dingel and Neiman (Citation2020) estimated 37 percent of U.S. jobs could be shifted to work from home and that the individuals in the remaining 75 percent or 63 percent, respectively, either risked COVID-19 exposure or experienced job loss. For our data set, we estimate that on average 32 percent of workers had the opportunity to work from home but this varied by geographic location.
Analysis
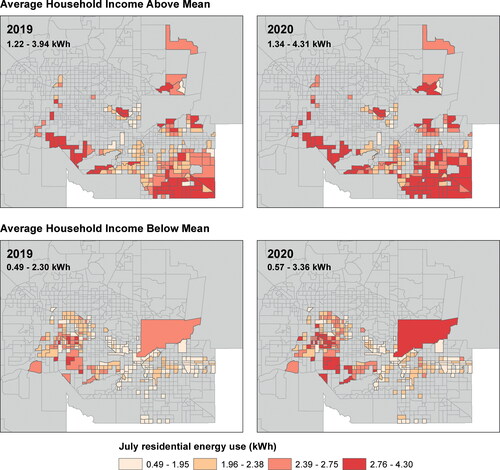
We created stepwise regression models for July 2019 and July 2020. We compared the results of the two models to study the combined effects of the COVID-19 stay-at-home orders and an extremely hot summer in Arizona. Early models did not reveal that household income was a significant determinant in electricity use in either year. We still aimed to understand the impact of high outdoor temperatures on lower income census tracts compared to higher income areas, however. We therefore further divided our data set into those census tracts with a median household income greater than the mean of the county ($68,760 in 2020) and census tracts with a median household income less than the mean of the county. Our divided data set resulted in above median income (n = 188) and below median income (n = 251) census tracts ().
Figure 3. Average residential electricity usage shown by above and below median household income.
Results
Analysis of the Dependent and Independent Variables
Descriptive statistics of our dependent variables—average residential electricity use by census tract for all census tracts (n = 439), above median income (n = 188), and below median income (n = 251)—for July 2019 and 2020 are shown in . We show that the increases in electricity usage from 2019 to 2020 are statistically significant in all census tracts as well as those divided by income. The mean value of July 2020 electricity usage, 2.36 MWh, was significantly higher than that for July 2019, 2.13 MWh, with t(438) = −77.849, p < 0.001. Similarly, mean electricity usage for the higher income census tracts in July 2020 was 2.67 MWh, which is significantly higher than that for July 2019, 2.43 MWh, with t(187) = −58.64, p < 0.001; and electricity use in lower income census tracts in July 2020, 2.12 MWh, was significantly higher than it was in July 2019, 1.91 MWh, with t(250) = −56.45, p < 0.001. Based on the paired-sample t test, we are able to reject the null hypothesis that there is no difference between electricity use between 2019 and 2020 giving us evidence that the difference is significant at the 0.01 confidence level. and illustrate the spatial distribution of our dependent variables by census tract, visually showing the difference between the two years and the striking difference between above median and below median income census tracts.
Table 3. Descriptive statistics for mean residential electricity use in MWh for residential homes by U.S. Census tract for all census tracts in our study (n = 439), those with incomes above the mean (n = 188), and those with incomes below the mean (n = 251)
Our independent variables were selected based on the literature and are divided into variables that describe neighborhood characteristics, house structures, social determinants, price plan policy, and COVID-19 impacts. Descriptive statistics of these variables for all census tracts and the data sets divided by income are reported in the Appendix (). We observed that the average land surface temperature between July 2019 and July 2020 remained the same despite the hotter air temperatures. We also performed a correlation analysis between our dependent and independent variables to examine the bivariate relationships between variables ( in the Appendix). Variable relationships that are statistically significant at the 0.01 level (two-tailed) are highlighted in bold. What is noticeable is that most variable correlations remain statistically significant between the years 2019 and 2020 but that relationship does not hold for all variables in the above or below median income variables. We have a small number of variables that had low correlation but were statistically significant; for example, land surface temperature in 2019, percentage shrub for all tracts, and living density for all tracts and for tracts below the median income.
Based on these findings, we were unable to evaluate the factors that influence residential electricity use in 2019 and 2020 in all our sample census tracts as well as for the census tracts divided by income. We considered a range of variables based on neighborhood characteristics (e.g., land-cover percentages, land surface temperature, percentage of occupied housing), house attributes (e.g., median number of rooms, home age), social and demographic features (e.g., income, race or ethnicity, education levels), residential pricing policies (e.g., six variables based on the percentage of customers enrolled in a specific plan), and COVID-19 effects (percentage who work from home). In all categories we found the expected high levels of correlation between variables. We opted to conduct a stepwise regression model to identify the best variables for our models.
Model Results
The analysis resulted in six regression models, reported in . The equations show the relationship between the dependent variable (ELEC, electricity use in MWh by census tract), in which the dependent variables are:
MUR: Medium number of rooms
MVHU: Medium value of owner-occupied housing units in U.S. dollars
AHS: Average house size in square meters
HISP: Percentage of Hispanic population
AHHS: Average household size
NoVeh: Percentage of occupied housing units with no vehicle
Plan23: SRP Plan 23
Plan26: SRP Plan 26
Plan27: SRP Plan 27
Plan29: SRP Plan 29
Table 4. Regression results for all census tracts, 2019, R2 = 0.905 or 90.5%
ELEC = 0.273 + 0.24 × MUR + 0.000 × MVHU + 0.005 × HISP + 0.154 × AHHS – 1.332 × Plan23 + 12.268 × Plan27
Table 5. Regression results for all census tracts, 2020, R2 = 0.905 or 90.5%
ELEC = 0.214 + 0.262 × MUR + 0.000 × MVHU + 0.001 × AHS + 0.006 × HISP + 0.169 × AHHS – 1.387 × Plan23 + 12.459 × Plan27
Table 6. Regression results for above median income census tracts, 2019, R2 = 0.881 or 88.1%
ELEC = −0.214 + 0.148 × MUR + 0.000 × MVHU + 0.003 × AHS + 0.008 × HISP + 0.259 × AHHS – 0.988 × Plan23 + 1.186
Table 7. Regression results for above median income census tracts, 2020, R2 = 0.882 or 88.2%
ELEC = −0.227 + 0.172 × MUR + 0.000 × MVHU + 0.003 × AHS + 0.009 × HISP + 0.274 × AHHS – 1.126 × Plan23 + 1.153 × Plan26
Table 8. Regression results for below median income census tracts, 2019, R2 = 0.877 or 87.7%
ELEC = 0.610 + 0.237 × MUR + 0.236 × AHHS – 1.545 × Plan23 + 14.849 × Plan27
Table 9. Regression results for below median income census tracts, 2020, R2 = 0.889 or 88.9%
ELEC = 0.246 + 0.256 × MUR + 0.009 × NoVeh + 0.324 × AHHS – 1.387 × Plan23 + 16.968 × Plan27 + 56.466 × Plan29
Three models in 2019 and three in 2020 include all census tracts ( and ), above median income census tracts ( and ), and below median income tracts ( and ). The adjusted R2 across all models ranges from a low of 87.7 percent (July 2020, below median income census tracts) to the highest of 90.5 percent (July 2019 and 2020, all census tracts). In other words, the independent variables explained nearly 90 percent or more of the variation in our dependent variables across all models. Across all six models, the median number of rooms, a housing variable, had the greatest influence in explaining the variation in residential electricity use. The median number of rooms reflects the total number of rooms that would need to be cooled during the hot summer months. Although none of the models included the percentage who worked from home during July 2020, the amount of influence in the model (as represented by the standardized coefficient) in the average household size variable suggests that the number of people living in the home could have affected electricity usage. The variance inflation factor (VIF) collinearity statistic (with a threshold of < 6.0) in our models suggests that the variables are not highly correlated and therefore explain different factors in residential electricity use.
In the model of all census tracts, the variable with the greatest influence on residential electricity use in 2019 is the median number of rooms (housing), followed by the median value of owner-occupied housing and percentage of population that is Hispanic (social). All variables are positively correlated, meaning that as the number of rooms, the home value, and the percentage of the Hispanic population increases, the residential electricity usage increases. This is likely the result of larger houses being more expensive and thus capable of housing larger families and using more electricity. This result is not surprising given the design of the electricity billing system, which is driven by consumption and peak hours. Although not surprising, it provides clarity on what levers can drive changes in electricity use overall. Similarly in 2020, the average house size and average household size (social) are also positively correlated but, as a housing variable, they do not have has much influence as the number of rooms. The only variable with a negative influence is the SRP Plan 23, which is the standard rate plan (policy), but its influence is less than other variables in the model. The SRP Plan 23 is the standard rate plan in which households pay based on use and time of day, when higher rates apply during high-demand hours. More households on this plan, compared to other plans that prioritize higher use during off-peak hours, suggests that special SRP rate plans (see ) do not reduce electricity use overall. They were designed to reduce cost to the customer (giving them lower rates during off-peak hours), however, rather than reducing overall consumption. For example, many residents on special rate plans supercool their homes during off-peak hours (early afternoon, prior to 5:00 p.m.) then stop using the HVAC during peak hours. This has the effect of using more electricity overall but still reducing customer costs.
Many of the relationships observed in the analysis of all census tracts are the same variables in the above median income with more specificity and different relationships in 2019 and 2020. In 2019, the variables with the greatest influence on the dependent variable in the above income census tracts are median value of owner-occupied housing units (housing), average house size (housing), and average household size (social). In 2019, SRP Plan 23 is negatively correlated but the standardized coefficient is lower, which means that households on this plan have decreased electricity use. The variables that were statistically significant stayed the same between 2019 and 2020 but their relative influence shifted slightly: Median number of rooms increased in 2020 and average household size decreased.
In the below median income analysis, none of the neighborhood variables factored into the models. The variables with the greatest influence on the dependent variables in both 2019 and 2020 are the median number of rooms (housing) and average household size (social). The average household size, however, had a greater influence in July 2020 than it did in 2019, which could reflect the number of people at home during the COVID-19 stay-at-home orders. Two variables that did not appear in 2019 that emerged as significant in 2020 are the percentage of occupied housing without a vehicle and the SRP Plan 29, the electric vehicle plan. The only variable to negatively influence the dependent variable is the SRP Plan 23, the standard rate plan. This implies that as the percentage of electricity customers who participated in SRP Plan 23 increased, energy use decreased. All other variables positively influenced electricity use.
Discussion
Urban and rural communities across the globe will be faced with choices on how to mitigate and manage heat related to climate change. The goal of this article is to understand how, when faced with extreme heat, urban areas can manage the associated residential electricity required to keep families comfortable and safe. The common narratives are that trees provide cooling, which will in turn reduce electricity use, and that working from home will increase overall electricity use. Our research, however, does not fully support either of those common assumptions. Simultaneously, our findings confirm that larger homes with more rooms use more electricity, which is supported elsewhere. In this section, we connect our findings and implications for communities like the Phoenix metropolitan area specifically and we suggest what can be translated to other communities.
Drivers of Residential Electricity Use
Decades of research on the UHI effect includes the correlation between land surface temperature and land cover (in Maricopa County and cities around the world, see Gorgani, Panahi, and Rezaie Citation2013; Jenerette et al. Citation2016; Q. Wang et al. Citation2016), and provides insights into the effects of climate change and the UHI (Aflaki et al. Citation2017). As Kwon et al. (Citation2023) showed, higher outdoor temperatures lead to greater energy usage. Nevertheless, when land surface temperatures and vegetation were factored into our models, electricity use increased with higher percentage of vegetation because of the strong correlation between vegetation and high-income neighborhoods as well as larger homes. Overall, environmental variables that might cool or warm an area, such as the vegetation or land surface temperature, played a minor role in explaining electricity use. The factors that were significant were related more to physical structures (living density) and occupancy (percentage occupied housing).
In contrast to the small effect of vegetation in reducing electricity use, the housing industry has made significant progress in energy-efficiency measures such as building codes that specify requirements for double-paned windows, widespread use of insulation, and the introduction and use of smart meters and thermostats. It has meant that houses are more efficient per square foot due to improved materials and stronger building codes. Our results show that electricity use increases with larger house size, whether there was a pool or not, and the number of rooms in the house. Although homes are more energy efficient, they are also larger and therefore require more electricity. The implications locally and for other communities are that building codes need to continue to be responsive toward greater energy efficiency coupled with efforts to stabilize the growing desire for larger homes.
We were able to capture the effects of typical home structures, but we were unable to capture how individual choices inside homes reduce electricity usage, such as upgrades to windows (in older homes), the use of energy-saving devices, and daytime and nighttime thermostat settings. Some individual choices can be captured in aggregate (e.g., choice of energy rate plan, described later), but most of these choices are not tracked. We included the value of owner-occupied housing, which could capture certain upgrades, but it is complex because it includes other factors such as home size, quality of schools (Clark and Herrin Citation2000), and access to a nice view (Benson et al. Citation1998). Furthermore, this variable is positively correlated with household income and education, which were not significant in our models.
Although household income did not factor significantly into our models, we did show that lower income neighborhoods, often dominated by minority populations, have higher energy cost burdens, with a larger percentage of income spent on home cooling (Buylova Citation2020; Kontokosta, Reina, and Bonczak Citation2020). Through a simple Pearson’s correlation analysis, we learned that indoor heat associated death rate (number of deaths/population) in Maricopa County annually from 2016 to 2022, relative to the annual consumer price index for residential electricity costs from BLS, had an R2 = 0.8338, at a statistically significant level (p < 0.05). This means that about 83 percent of the variance in indoor heat-associated deaths is explained by the cost of electricity, meaning people’s ability to pay for utilities is a significant contributor to heat health.
Our work contributes to the energy justice literature by further highlighting how climate change will disproportionally affect communities of color. Even during more typical summers, summertime utility bills for residents are on average 6 percent higher than the national average. This is coupled with annual income levels that are, on average, 9 percent less than the national average (U.S. Census Bureau Citation2023). For Arizona, Hispanic residents bore a larger financial burden due to poor indoor climate control, increased energy use, impacts on acute and chronic health conditions, and exacerbation of the conditions of inequality. Programs such as the Low Income Energy Assistant Program, a federal program that addresses both heating homes during the winter as well as cooling during the summers, will need to be better poised to respond to the threat of increasing heat.
Policies
The most obvious policy lever that can immediately and effectively influence residential electricity use is energy rate plans. Our research supports work by White and Sintov (Citation2018), supported by research by Jones et al. (Citation2023), which recommends that rate plans should be targeted based on demographics, especially vulnerable communities, to avoid amplifying already existing energy justice challenges. In their research on time-of-use plans, they found correlations between vulnerable populations (elderly, minority, disabled), time-of-use electricity bills, and poor health outcomes. The provider studied here similarly offers customers the choice between eleven residential rate plans, which vary based on time of use, prepayment, on-peak, off-peak, and super-off-peak hours and whether the home has on-site power generation (e.g., solar panels; SRP Citation2022; see ). These plans focus on diverting energy usage from on-peak hours to off-peak hours rather than strategies to reduce overall electricity useFootnote1 and are not targeted toward any specific population.
It is important to underscore our finding that although participation in optional SRP rate plans might lead to its intended outcome (reduced costs to consumers), it does not necessarily translate to reduced electricity use. For example, the goal in the off-peak plans is to divert usage from high-demand times to low-demand times rather than reduce overall electricity use. As noted, customers aim to supercool their homes during the off-peak hours then reduce or stop HVAC usage during the peak hours. Although this approach might reduce costs, the super cooling during the middle of the day does not necessarily lead to lower electricity usage. In fact, higher usage is evident in our models because the plans reported higher usage with higher participation in the plans.
In our models, we see that choice of several rate plans is statistically significant, especially for the above mean income census tracts. The SRP 23 rate plan is significant and negative in all the models. For this plan, the rates are highest during the very hot months with rates at 11.57 cents for the first 2,000 kWh (2.00 MWh) and 12.7 cents for energy usage above 2,000 kWh (2.00 MWh) in July and August. This means that as the percentage of customers in the standard rate plan increases, overall electricity usage decreases. This is consistent with our understanding of the rate plans that aim to reduce costs rather than reduce usage.
In addition to various payment plans, SRP also offers numerous energy-saving tips to consumers such as sending customers an Energy ScorecardFootnote2 and promoting energy-efficient products, rebates and discounts, and other upgrades (e.g., window replacement). These incentives were not captured in our models, and they are often restricted to owner-occupied housing and to households who can afford to pay for the repairs and upgrades. Future research could examine these factors as well as the amount of shade, where the thermometer is set, efficiency of the air-cooling unit, use of evaporative cooling, and other factors that could reduce indoor temperatures. For example, A. Zhao, Sailor, and Wentz (Citation2018) examined the effect of tree placement in residential housing and found that microclimates and thermal comfort increased from shade provided by strategically placed trees.
Even though none of the SRP plans were designed explicitly to reduce electricity use overall, the question is whether they should be. Instead, plans should be set up for specific demographics to allow people to use more electricity and alleviate poverty given the right context (Jones et al. Citation2023). For example, Kwon et al. (Citation2023) highlighted that some households in Arizona forgo electricity and air conditioning usage to save money. This means that these households consume more electricity, which can be beneficial to comfort, health, and safety. In other words, households in hot climates like Phoenix actually need additional electricity use—not less. Poverty alleviation is not just about reducing people’s bills, but also about allowing them to be safe and healthy within their homes.
Long-Term Implications
The COVID-19 pandemic is unlikely an isolated event and the effects continue to linger beyond the initial 2020 “work-from-home” period we analyzed. We know that during summer 2020 more individuals and families worked from home and used their own personal resources to cover the costs of electricity, Internet, and water. Prior research showed that Arizona residents used more energy during this time (Ku et al. Citation2022). What prior research did not take into consideration was that the stay-at-home order occurred during the hottest summer on record, further straining the region’s power systems. We conclude that we are unable to completely differentiate electricity use based on the stay-at-home order versus the hot summer. To this day, more people continue to work remotely or have a hybrid work schedule than before the pandemic. For families with work situations that allowed them to stay home during the pandemic or continue to work from home, every summer, record-breaking temperatures can be felt at the household level. Our analysis found that the stay-at-home orders influenced residential electricity use on everyone living in the home rather than just those who worked from home.
The challenge in communities like Maricopa County continues to be the effects of heat. The number of heat-related deaths increased by more than 60 percent from 199 to 323 between the summers of 2019 and 2020 in Maricopa County (Maricopa County Department of Public Health Citation2021). These heat-related deaths were likely preventable and occurred, in part, due to conditions related to responding during the pandemic. They seem to have been exacerbated by the disruption of the pandemic threat, where we suspect that some households must have had more difficulty keeping cool under stay-at-home conditions (Kear et al. Citation2020). During the summer of 2020, the number of facilities participating as cooling centers in Maricopa County dropped from 106 in 2019 to only 19 in 2020, an 82 percent reduction (Guardaro et al. Citation2022), meaning that many housed, vulnerable individuals were not able to seek shelter and water when their shelter failed. Even prior to the pandemic, Eisenman et al. (Citation2016) explored the relationship between social vulnerability and infrastructure and their respective vulnerability to heat mortality, finding that as temperatures increased, census tracts with public cooling centers had reduced levels of heat-related illness. Furthermore, social vulnerability remained a high predictor even after accounting for the accessibility of cooling centers.
Conclusions
The research in this article has advanced our understanding of the complex interactions between climate change and urban environments, with answers that align with conventional wisdom as well as answers that deviate from it. One major finding that aligns with conventional wisdom is that the home structure continues to be the strongest determinant of electricity usage. This finding has implications for development and adaptation policy. For instance, planners and developers could focus efforts on how housing structures can be updated for optimal energy efficiency. Despite trends for larger homes, planners could work with builders to develop strategies to build and market smaller dwelling unit areas. On the other hand, conventional wisdom would suggest that outdoor vegetation, which research shows reduces urban heat, would reduce overall electricity use. Nevertheless, we found that high-density vegetation, which is correlated with higher income areas, appears to be offset by the lifestyle and behavioral impacts of large houses and electricity consumption. Finally, the extreme heat experienced by Maricopa County residents in the summer of 2020 was coupled with stay-at-home orders due to the COVID-19 pandemic. Our expectation was that individuals who normally work in air-conditioned buildings, allowing them to raise the temperature on the thermostat at home, were lowering their at-home thermostat and therefore increasing their electricity consumption and utility bill costs in 2020. As the pandemic has shifted to an endemic, employers and employees are recognizing the flexible and financial benefits of working from home.
Our results indicate that a contextualized study of small-area configurations and landscapes of housing stock plus utility rate plan options will be critical to designing locally relevant adaptation plans, including city-wide heat action plans (Guardaro Citation2023). The results suggest that we do not find reduced electricity use under greater vegetation, but we do need to recognize that shade and green infrastructure are important components of keeping all people cool (Turner, Middel, and Vanos Citation2023). The outcome of this study is an advanced assessment of residential electricity use available to decision-makers (e.g., home builders, power companies, city planners) who can use the results for energy-transition scenarios, critical to what Calvert (2014) described as energy geographies. Our work has brought to bear relevant geospatial data on residential electricity use, highlighting how both the physical factors and social factors can influence effective strategies for climate change adaptation.
Disclosure Statement
No potential conflict of interest was reported by the authors.
Additional information
Notes on contributors
Elizabeth A. Wentz
ELIZABETH A. WENTZ is a Professor in the School of Geographical Sciences and Urban Planning at Arizona State University, Tempe, AZ 85287. E-mail: [email protected]. Her research interests include GIScience, urban adaptation to climate change, and heat resilience.
Patricia Solís
PATRICIA SOLÍS is an Associate Research Professor in the School of Geographical Sciences and Urban Planning at Arizona State University, Tempe AZ 85287. E-mail: [email protected]. Her research interests include community resilience, open data access, and adaptation to climate change.
Chuyuan Wang
CHUYUAN WANG is an Assistant Professor in the Department of Geography and Environmental Planning at Towson University, Towson, MD 21252. E-mail: [email protected]. His research interests include urban climate, urban ecosystems, terrestrial ecosystems, land-cover/land-use change, and agricultural and natural resources using remote sensing, geographical information systems, and spatial modeling techniques.
Carlos Aguiar-Hernandez
CARLOS AGUIAR-HERNANDEZ is an Adjunct Faculty Member at the School of Sustainability, College of Global Futures at Arizona State University, Tempe, AZ 85287. E-mail: [email protected]. His research interests include clean power technologies, energy policy, and sustainability.
Hank Courtright
HANK COURTRIGHT is an Executive Consultant for the Salt River Project, Tempe, AZ 85288. E-mail: [email protected]. His research interests include energy technology innovation, carbon reduction, and sustainability.
Aaron J. Dock
AARON J. DOCK manages Load Research for the Salt River Project, Tempe, AZ 85281. E-mail: [email protected]. His research interests include the roles of pricing and technology on customer energy usage behavior relating to grid sustainability.
Notes
1 The on-peak rates are the most expensive and, in most plans, are applied between 5:00 a.m. and 9:00 a.m. and again from 5:00 p.m. to 9:00 p.m., Monday through Friday, excluding holidays. Super-off-peak applies to plans for charging electric vehicles and customers are changed a lower rate from 11:00 p.m. to 5:00 a.m. for overnight vehicle changing. The exception to the reduced cost plan is the SRP Plan 23, which is the standard rate plan and one not based on optimizing for time of use.
2 SRP sends an Energy Scorecard to about 150,000 customers four times per year. The Scorecard compares that home’s monthly and annual usage to homes of a similar size, pool or no pool, number of stories, and to customers on the same price plan. This information could influence behavioral choices of customers who have this comparative information.
References
- Aflaki, A., M. Mirnezhad, A. Ghaffarianhoseini, A. Ghaffarianhoseini, H. Omrany, Z.-H. Wang, and H. Akbari. 2017. Urban heat island mitigation strategies: A state-of-the-art review on Kuala Lumpur, Singapore and Hong Kong. Cities 62:131–45. doi: 10.1016/j.cities.2016.09.003.
- Alqasemi, A. S., M. E. Hereher, G. Kaplan, A. M. Fadhil Al-Quraishi, and H. Saibi. 2021. Impact of COVID-19 lockdown upon the air quality and surface urban heat island intensity over the United Arab Emirates. The Science of the Total Environment 767:144330. doi: 10.1016/j.scitotenv.2020.144330.
- Anderson, G. B., and M. L. Bell. 2011. Heat waves in the United States: Mortality risk during heat waves and effect modification by heat wave characteristics in 43 US communities. Environmental Health Perspectives 119 (2):210–18. doi: 10.1289/ehp.1002313.
- Baker, M. G. 2020. Characterizing occupations that cannot work from home: A means to identify susceptible worker groups during the COVID-19 pandemic. MedRxiv: 2020-03.
- Barthelemy, M. 2016. A global take on congestion in urban areas. Environment and Planning B: Planning and Design 43 (5):800–804. doi: 10.1177/0265813516649955.
- Bayulken, B., D. Huisingh, and P. M. Fisher. 2021. How are nature based solutions helping in the greening of cities in the context of crises such as climate change and pandemics? A comprehensive review. Journal of Cleaner Production 288:125569. doi: 10.1016/j.jclepro.2020.125569.
- Benson, E. D., J. L. Hansen, A. L. Schwartz, and G. T. Smersh. 1998. Pricing residential amenities: The value of a view. The Journal of Real Estate Finance and Economics 16 (1):55–73. doi: 10.1023/A:1007785315925.
- Bikomeye, J. C., S. Namin, C. Anyanwu, C. S. Rublee, J. Ferschinger, K. Leinbach, P. Lindquist, A. Hoppe, L. Hoffman, J. Hegarty, et al. 2021. Resilience and equity in a time of crises: Investing in public urban greenspace is now more essential than ever in the US and beyond. International Journal of Environmental Research and Public Health 18 (16):8420. doi: 10.3390/ijerph18168420.
- Bobrowska-Korzeniowska, M., J. Jerzyńska, K. Polańska, D. Kaleta, I. Stelmach, A. Kunert, and W. Stelmach. 2021. The effect of air pollution on the respiratory system in preschool children with contribution of urban heat islands and geographic data—The aim of the study and methodological assumptions. International Journal of Occupational Medicine and Environmental Health 34 (4):453–60. doi: 10.13075/ijomeh.1896.01651.
- Brown, M. A., A. Soni, M. V. Lapsa, K. Southworth, and M. Cox. 2020. High energy burden and low-income energy affordability: Conclusions from a literature review. Progress in Energy 2 (4):042003. doi: 10.1088/2516-1083/abb954.
- Bureau of Labor Statistics (BLS). 2023. Home page. https://www.bls.gov/.
- Buylova, A. 2020. Spotlight on energy efficiency in Oregon: Investigating dynamics between energy use and socio-demographic characteristics in spatial modeling of residential energy consumption. Energy Policy 140:111439. doi: 10.1016/j.enpol.2020.111439.
- Calvert, K. 2015. From energy geography to energy geographies perspectives on a fertile academic borderland. Progress in Human Geography 40 (1):105–25. doi: 10.1177/0309132514566343.
- Castells-Quintana, D., E. Dienesch, and M. Krause. 2021. Air pollution in an urban world: A global view on density, cities and emissions. Ecological Economics 189:107153. doi: 10.1016/j.ecolecon.2021.107153.
- Centers for Disease Control. 2021. Hurricane Ida. Accessed April 27, 2023. https://www.cdc.gov/orr/timeline/events/ida.html#:∼:text=On%20August%2029%2C%202021%2C%20Hurricane,along%20the%20U.S.%20Gulf%20Coast.
- Central Arizona–Phoenix Long-Term Ecological Research. 2020. Land-cover mapping of the central Arizona region based on 2015 National Agriculture Imagery Program (NAIP) imagery. https://sustainability-innovation.asu.edu/caplter/data/view/knb-lter-cap.685.1/.
- Chapman, S., J. E. Watson, A. Salazar, M. Thatcher, and C. A. McAlpine. 2017. The impact of urbanization and climate change on urban temperatures: A systematic review. Landscape Ecology 32 (10):1921–35. doi: 10.1007/s10980-017-0561-4.
- Chow, W., T. L. Wen, W. C. Chuang, and P. Gober. 2012. Vulnerability to extreme heat in metropolitan Phoenix: Spatial, temporal, and demographic dimensions. The Professional Geographer 64 (2):286–302. doi: 10.1080/00330124.2011.600225.
- Cicala, S. 2021. The incidence of extreme economic stress: Evidence from utility disconnections. Journal of Public Economics 200:104461. doi: 10.1016/j.jpubeco.2021.104461.
- Clark, D. E., and W. E. Herrin. 2000. The impact of public school attributes on home sale prices in California. Growth and Change 31 (3):385–407. doi: 10.1111/0017-4815.00134.
- Cong, S., D. Nock, Y. L. Qiu, and B. Xing. 2022. Unveiling hidden energy poverty using the energy equity gap. Nature Communications 13 (1):2456. doi: 10.1038/s41467-022-30146-5.
- Dingel, J. I., and B. Neiman. 2020. How many jobs can be done at home? Journal of Public Economics 189:104235. doi: 10.1016/j.jpubeco.2020.104235.
- Eisenman, D. P., H. Wilhalme, C.-H. Tseng, M. Chester, P. English, S. Pincetl, A. Fraser, S. Vangala, and S. K. Dhaliwal. 2016. Heat death associations with the built environment, social vulnerability and their interactions with rising temperature. Health & Place 41:89–99. doi: 10.1016/j.healthplace.2016.08.007.
- Environmental Protection Agency. 2022. Home page. Accessed April 27, 2023. https://www.epa.gov/
- Ewing, R., and F. Rong. 2008. The impact of urban form on US residential energy use. Housing Policy Debate 19 (1):1–30. doi: 10.1080/10511482.2008.9521624.
- Ezell, J. M., D. Griswold, E. C. Chase, and E. Carver. 2021. The blueprint of disaster: COVID-19, the Flint water crisis, and unequal ecological impacts. The Lancet: Planetary Health 5 (5):e309–e315. doi: 10.1016/S2542-5196(21)00076-0.
- Fraser, A. M., M. V. Chester, D. Eisenman, D. M. Hondula, S. S. Pincetl, P. English, and E. Bondank. 2017. Household accessibility to heat refuges: Residential air conditioning, public cooled space, and walkability. Environment and Planning B: Urban Analytics and City Science 44 (6):1036–55. doi: 10.1177/0265813516657342.
- Gorgani, S. A., M. Panahi, and F. Rezaie. 2013. The relationship between NDVI and LST in the urban area of Mashhad, Iran. Paper presented at the International Conference on Civil Engineering Architecture & Urban Sustainable Development, 27–28 November, Tabiz, Iran.
- Guardaro, M. 2023. Strengthening heat action plans in the United States. American Journal of Public Health 113 (5):465–467. doi: 10.2105/AJPH.2023.307260.
- Guardaro, M., D. M. Hondula, J. Ortiz, and C. L. Redman. 2022. Adaptive capacity to extreme urban heat: The dynamics of differing narratives. Climate Risk Management 35:100415. doi: 10.1016/j.crm.2022.100415.
- Harlan, S. L., J. H. Declet-Barreto, W. L. Stefanov, and D. B. Petitti. 2013. Neighborhood effects on heat deaths: Social and environmental predictors of vulnerability in Maricopa County, Arizona. Environmental Health Perspectives 121 (2):197–204. doi: 10.1289/ehp.1104625.
- Hernández, D. 2013. Energy insecurity: A framework for understanding energy, the built environment, and health among vulnerable populations in the context of climate change. American Journal of Public Health 103 (4):e32–e34. doi: 10.2105/AJPH.2012.301179.
- Hidalgo-García, D., and J. Arco-Díaz. 2022. Modeling the surface urban heat island (SUHI) to study of its relationship with variations in the thermal field and with the indices of land use in the metropolitan area of Granada (Spain). Sustainable Cities and Society 87:104166. doi: 10.1016/j.scs.2022.104166.
- Hondula, D. M., R. C. Balling, J. K. Vanos, and M. Georgescu. 2015. Rising temperatures, human health, and the role of adaptation. Current Climate Change Reports 1 (3):144–54. doi: 10.1007/s40641-015-0016-4.
- Howard, B., L. Parshall, J. Thompson, S. Hammer, J. Dickinson, and V. Modi. 2012. Spatial distribution of urban building energy consumption by end use. Energy and Buildings 45:141–51. doi: 10.1016/j.enbuild.2011.10.061.
- Huang, W.-H. 2015. The determinants of household electricity consumption in Taiwan: Evidence from quantile regression. Energy 87:120–33. doi: 10.1016/j.energy.2015.04.101.
- Isaac, M., and D. P. Van Vuuren. 2009. Modeling global residential sector energy demand for heating and air conditioning in the context of climate change. Energy Policy 37 (2):507–21. doi: 10.1016/j.enpol.2008.09.051.
- Iverson, S. A., A. Gettel, C. P. Bezold, K. Goodin, B. McKinney, R. Sunenshine, and V. Berisha. 2020. Heat-associated mortality in a hot climate: Maricopa County, Arizona, 2006-2016. Public Health Reports 135 (5):631–39.
- Jafino, B. A., B. Walsh, J. Rozenberg, and S. Hallegatte. 2020. Revised estimates of the impact of climate change on extreme poverty by 2030. Washington, DC: The World Bank.
- Jenerette, G. D., S. L. Harlan, A. Buyantuev, W. L. Stefanov, J. Declet-Barreto, B. L. Ruddell, S. W. Myint, S. Kaplan, and X. Li. 2016. Micro-scale urban surface temperatures are related to land-cover features and residential heat related health impacts in Phoenix, AZ USA. Landscape Ecology 31 (4):745–60. doi: 10.1007/s10980-015-0284-3.
- Jenkins, K., D. McCauley, R. Heffron, H. Stephan, and R. Rehner. 2016. Energy justice: A conceptual review. Energy Research & Social Science 11:174–82. doi: 10.1016/j.erss.2015.10.004.
- Jones, A., D. Nock, C. Samaras, Y. L. Qiu, and B. Xing. 2023. Climate change impacts on future residential electricity consumption and energy burden: A case study in Phoenix, Arizona. Energy Policy 183:113811. doi: 10.1016/j.enpol.2023.113811.
- Kaza, N. 2010. Understanding the spectrum of residential energy consumption: A quantile regression approach. Energy Policy 38 (11):6574–85. doi: 10.1016/j.enpol.2010.06.028.
- Kear, M., M. Wilder, P. Solis, D. Hondula, and M. Bernstein. 2020. Self-isolating from COVID-19 in a mobile home? That could be deadly in Arizona. Arizona Republic, May 23. https://bit.ly/2WsytKN.
- Keith, L., S. Meerow, and T. Wagner. 2019. Planning for extreme heat: A review. Journal of Extreme Events 6 (03n04):2050003. doi: 10.1142/S2345737620500037.
- Kontokosta, C. E., V. J. Reina, and B. Bonczak. 2020. Energy cost burdens for low-income and minority households: Evidence from energy benchmarking and audit data in five US cities. Journal of the American Planning Association 86 (1):89–105. doi: 10.1080/01944363.2019.1647446.
- Ku, A. L., Y. L. Qiu, J. Lou, D. Nock, and B. Xing. 2022. Changes in hourly electricity consumption under COVID mandates: A glance to future hourly residential power consumption pattern with remote work in Arizona. Applied Energy 310:118539. doi: 10.1016/j.apenergy.2022.118539.
- Kuzemko, C., M. Bradshaw, G. Bridge, A. Goldthau, J. Jewell, I. Overland, D. Scholten, T. Van de Graaf, and K. Westphal. 2020. Covid-19 and the politics of sustainable energy transitions. Energy Research & Social Science 68:101685. doi: 10.1016/j.erss.2020.101685.
- Kwon, M., S. Cong, D. Nock, L. Huang, Y. L. Qiu, and B. Xing. 2023. Forgone summertime comfort as a function of avoided electricity use. Energy Policy 183:113813. doi: 10.1016/j.enpol.2023.113813.
- Lemanski, C. 2016. Poverty: Multiple perspectives and strategies. Geography 101 (1):4–10. doi: 10.1080/00167487.2016.12093977.
- Lou, J., Y. L. Qiu, A. L. Ku, D. Nock, and B. Xing. 2021. Inequitable and heterogeneous impacts on electricity consumption from COVID-19 mitigation measures. iScience 24 (11):103231. doi: 10.1016/j.isci.2021.103231.
- Maricopa County Department of Public Health. 2021. Maricopa County Department of Public Health. Accessed April 27, 2023. https://www.maricopa.gov/5302/Public-Health.
- Memmott, T., S. Carley, M. Graff, and D. M. Konisky. 2021. Sociodemographic disparities in energy insecurity among low-income households before and during the COVID-19 pandemic. Nature Energy 6 (2):186–93. doi: 10.1038/s41560-020-00763-9.
- Memmott, T., S. Carley, M. Graff, and D. M. Konisky. 2023. Utility disconnection protections and the incidence of energy insecurity in the United States. iScience 26 (3):106244. doi: 10.1016/j.isci.2023.106244.
- Milošević, D., A. Middel, S. Savić, J. Dunjić, K. Lau, and R. Stojsavljević. 2022. Mask wearing behavior in hot urban spaces of Novi Sad during the COVID-19 pandemic. The Science of the Total Environment 815:152782. doi: 10.1016/j.scitotenv.2021.152782.
- National Oceanic and Atmospheric Administration. 2021. Home page. Accessed April 27, 2023. https://www.noaa.gov/.
- Nieuwenhuijsen, M. J. 2021. New urban models for more sustainable, liveable and healthier cities post COVID-19; reducing air pollution, noise and heat island effects and increasing green space and physical activity. Environment International 157:106850. doi: 10.1016/j.envint.2021.106850.
- Parida, B. R., S. Bar, D. Kaskaoutis, A. C. Pandey, S. D. Polade, and S. Goswami. 2021. Impact of COVID-19 induced lockdown on land surface temperature, aerosol, and urban heat in Europe and North America. Sustainable Cities and Society 75:103336. doi: 10.1016/j.scs.2021.103336.
- Patz, J. A., D. Campbell-Lendrum, T. Holloway, and J. A. Foley. 2005. Impact of regional climate change on human health. Nature 438 (7066):310–317. doi: 10.1038/nature04188.
- Perera, A. T. D., V. M. Nik, D. Chen, J.-L. Scartezzini, and T. Hong. 2020. Quantifying the impacts of climate change and extreme climate events on energy systems. Nature Energy 5 (2):150–159. doi: 10.1038/s41560-020-0558-0.
- Pour, S. H., A. K. A. Wahab, S. Shahid, M. Asaduzzaman, and A. Dewan. 2020. Low impact development techniques to mitigate the impacts of climate-change-induced urban floods: Current trends, issues and challenges. Sustainable Cities and Society 62:102373. doi: 10.1016/j.scs.2020.102373.
- Psistaki, K., I. M. Dokas, and A. K. Paschalidou. 2023. Analysis of the heat-and cold-related cardiovascular mortality in an urban Mediterranean environment through various thermal indices. Environmental Research 216 (Pt. 4):114831. doi: 10.1016/j.envres.2022.114831.
- Reinwald, F., D. Haluza, U. Pitha, and R. Stangl. 2021. Urban green infrastructure and green open spaces: An issue of social fairness in times of COVID-19 crisis. Sustainability 13 (19):10606. doi: 10.3390/su131910606.
- Roshan, G., R. Sarli, and J. M. Fitchett. 2022. Urban heat island and thermal comfort of Esfahan City (Iran) during COVID-19 lockdown. Journal of Cleaner Production 352:131498. doi: 10.1016/j.jclepro.2022.131498.
- Salt River Project (SRP). 2022. Home page. Accessed April 27, 2023. https://www.srpnet.com/.
- Santamouris, M. 2015. Regulating the damaged thermostat of the cities—Status, impacts and mitigation challenges. Energy and Buildings 91:43–56. doi: 10.1016/j.enbuild.2015.01.027.
- Saputra, A., M. H. Ibrahim, S. Shofirun, A. Saifuddin, and K. Furoida. 2022. Assessing urban heat island in Jakarta, Indonesia during the pandemic of Covid-19. IOP Conference Series: Earth and Environmental Science 986 (1):012069. doi: 10.1088/1755-1315/986/1/012069.
- Scheier, E., and N. Kittner. 2022. A measurement strategy to address disparities across household energy burdens. Nature Communications 13 (1):288. doi: 10.1038/s41467-021-27673-y.
- Schmeltz, M. T., and P. J. Marcotullio. 2019. Examination of human health impacts due to adverse climate events through the use of vulnerability mapping: A scoping review. International Journal of Environmental Research and Public Health 16 (17):3091. doi: 10.3390/ijerph16173091.
- Shikwambana, L., M. Kganyago, and P. Mhangara. 2021. Temporal analysis of changes in anthropogenic emissions and urban heat islands during COVID-19 restrictions in Gauteng Province, South Africa. Aerosol and Air Quality Research 21 (9):200437. doi: 10.4209/aaqr.200437.
- Stewart, I. D. 2011. A systematic review and scientific critique of methodology in modern urban heat island literature. International Journal of Climatology 31 (2):200–17. doi: 10.1002/joc.2141.
- Turner, V. K., A. Middel, and J. K. Vanos. 2023. Shade is an essential solution for hotter cities. Nature 619 (7971):694–97. doi: 10.1038/d41586-023-02311-3.
- Tzavali, A., J. P. Paravantis, G. Mihalakakou, A. Fotiadi, and E. Stigka. 2015. Urban heat island intensity: A literature review. Fresenius Environmental Bulletin 24 (12b):4537–54.
- United Nations (UN). 2022. Home page. Accessed April 27, 2023. https://www.un.org/en/.
- U.S. Census Bureau. 2023. Home page. Accessed May 18, 2023. https://www.census.gov/.
- U.S. Energy Information Administration. 2023. Home page. Accessed May 18, 2023. https://www.eia.gov/.
- Wai, C. Y., N. Muttil, M. A. U. R. Tariq, P. Paresi, R. C. Nnachi, and A. W. Ng. 2021. Investigating the relationship between human activity and the urban heat island effect in Melbourne and four other international cities impacted by COVID-19. Sustainability 14 (1):378. doi: 10.3390/su14010378.
- Wang, C., Z. Li, M. C. Mathews, S. Praharaj, B. Karna, and P. Solís. 2022. The spatial association of social vulnerability with COVID-19 prevalence in the contiguous United States. International Journal of Environmental Health Research 32 (5):1147–54. doi: 10.1080/09603123.2020.1847258.
- Wang, C., P. Solís, L. Villa, N. Khare, E. A. Wentz, and A. Gettel. 2021. Spatial modeling and analysis of heat-related morbidity in Maricopa County, Arizona. Journal of Urban Health: Bulletin of the New York Academy of Medicine 98 (3):344–61. doi: 10.1007/s11524-021-00520-7.
- Wang, Q., S.-D. Wu, Y.-E. Zeng, and B.-W. Wu. 2016. Exploring the relationship between urbanization, energy consumption, and CO2 emissions in different provinces of China. Renewable and Sustainable Energy Reviews 54:1563–79. doi: 10.1016/j.rser.2015.10.090.
- Weiyu, L., X. Yuanyuan, S. Tong, and W. Jifei. 2022. Air quality dynamics and urban heat island effects during Covid-19. In Geospatial Data Analytics and Urban Applications, 33–59.
- White, L. V., and N. D. Sintov. 2018. Inaccurate consumer perceptions of monetary savings in a demand-side response programme predict programme acceptance. Nature Energy 3 (12):1101–1108. doi: 10.1038/s41560-018-0285-y.
- Xi, Z., C. Li, L. Zhou, H. Yang, and R. Burghardt. 2023. Built environment influences on urban climate resilience: Evidence from extreme heat events in Macau. The Science of the Total Environment 859 (Pt. 2):160270. doi: 10.1016/j.scitotenv.2022.160270.
- Zhao, A., D. J. Sailor, and E. A. Wentz. 2018. Impact of tree locations and arrangements on outdoor microclimates and human thermal comfort in an urban residential environment. Urban Forestry & Urban Greening 32:81–91. doi: 10.1016/j.ufug.2018.03.022.
- Zhao, L., K. Oleson, E. Bou-Zeid, E. S. Krayenhoff, A. Bray, Q. Zhu, Z. Zheng, C. Chen, and M. Oppenheimer. 2021. Global multi-model projections of local urban climates. Nature Climate Change 11 (2):152–57. doi: 10.1038/s41558-020-00958-8.
- Zhao, N., and F. You. 2021. New York State’s 100% renewable electricity transition planning under uncertainty using a data-driven multistage adaptive robust optimization approach with machine-learning. Advances in Applied Energy 2:100019. doi: 10.1016/j.adapen.2021.100019.
Appendix
Table A.1. Independent variables descriptive statistics all census tracts.
Table A.2. Independent variables descriptive statistics census tracts with above mean income.
Table A.3. Independent variable descriptive statistics for census tracts with below mean income.
Table A.4. Pearson’s correlation between dependent and independent variables.