
 ?Mathematical formulae have been encoded as MathML and are displayed in this HTML version using MathJax in order to improve their display. Uncheck the box to turn MathJax off. This feature requires Javascript. Click on a formula to zoom.
Abstract
Reliance on digital navigation aids has already shown negative impacts on navigators’ innate spatial abilities. How this happens is still an open research question. We report on an empirical study with twenty-four experienced (male) taxi drivers to evaluate the long-term impacts of in-car navigation system use on the spatial learning ability of these navigation experts. Specifically, we measured cognitive load by means of electroencephalography (EEG) coupled with eye tracking to assess their visuospatial attention allocation during a video-based route-following task while driving through an unknown urban environment. We found that long-term reliance on in-car navigation aids did not affect participants’ visual attention allocation during spatial learning but rather limited their ability to encode viewed geographic information into memory, which, in turn, led to greater cognitive load, especially along route segments between intersections. Participants with greater dependence on in-car navigation aids performed worse on the spatial knowledge tests. Our combined behavioral and neuropsychological findings provide evidence for the impairment of expert navigators’ spatial learning ability when exposed to long-term use of digital in-car navigation aids.
Digital in-car navigation aids and handheld mobile map applications have become ubiquitous in various mobility contexts. Especially in unfamiliar environments, digital navigation aids have become the preferred mode of navigation support for our mobility needs. With their various wayfinding and route-planning functions, in-car navigation aids assist drivers in reaching destinations efficiently and safely. Especially when leveraging auditory assistance, navigation aids also offer the potential to offload drivers’ already taxed visual-cognitive demands while driving (Girardin and Blat Citation2010). Before digital navigation aids were available, abilities to acquire spatial information from the traversed environment and to encode this new information into spatial memory were indispensable for self-localization, staying oriented during movement, and making appropriate navigation decisions (Aporta and Higgs Citation2005). Passively following turn-by-turn instructions provided by a digital navigation system enables navigators to travel successfully with very little knowledge of their surroundings (Ben-Elia Citation2021). Spatial learning, as a fundamental human ability, is therefore increasingly circumvented due to the use of digital navigation devices with detrimental consequences (Ruginski et al. Citation2019). The negative impact of geographical information technology on individuals’ spatial skills has become an interdisciplinary research concern (McKinlay Citation2016; Ruginski et al. Citation2022).
To investigate how long-term dependence on in-car navigation aids impairs expert navigators’ spatial learning ability, we conducted an empirical study with male taxi drivers in Beijing. We recruited mostly male taxi drivers simply because they are largely overrepresented in this profession. According to a recent report on taxis and private hire vehicles (PHVs) in the United Kingdom, most drivers were male (97 percent) in 2022.Footnote1 This proportion has been higher than 90 percent for all of the last ten years. Expert urban navigators, specifically (male) taxi drivers, have already been of great interest to spatial cognition researchers (Maguire et al. Citation2000) who study how humans acquire and use spatial knowledge during navigation and wayfinding and how navigation experience affects these processes (Griesbauer et al. Citation2022). Compared to the general population, licensed male London taxi drivers have been found to have a larger hippocampus, a brain area strongly associated with spatial memory and navigation (Maguire et al. Citation2000). The volume increase is suspected to be a consequence of extensive training for an exam called “The Knowledge,” learning how to navigate in the City of London without any navigation assistance (Maguire et al. Citation2000). This made (male) taxi drivers in Beijing attractive participants for our study, as they have already been using in-car navigation systems extensively (8.17 years on average) and have consistent usage habits (following auditory instructions). Notably, navigation aids in taxi applications have constantly evolved in recent years, making it difficult to systematically track and quantify taxi drivers’ past experiences with in-car navigation aids. Nonetheless, our participants already exhibited significant and distinguishable differences in their dependence on digital in-car navigation assistance within a decade of use. Hence, we aimed to examine how the spatial learning ability of professional taxi drivers is modulated by the degree to which they rely on digital in-car navigation aids.
Inspired by previous research (e.g., Ishikawa Citation2019; Ruginski et al. Citation2019), we first hypothesized that long-term exposure to in-car navigation aids would impair expert navigators’ ability to acquire spatial knowledge (i.e., landmark knowledge, route knowledge, and survey knowledge), which we aimed to assess in a video-based route-following task while driving through an unknown urban environment (Hypothesis 1). We further wished to study navigators’ cognitive processes during spatial learning and how these might be associated with in-car navigation aid dependence. To this end, we focused on two critical indicators of these cognitive processes: visual attention allocation and cognitive load. Visual attention allocation involves searching for and acquiring visual-spatial information from the traversed environment (Kiefer et al. Citation2017; Brügger, Richter, and Fabrikant Citation2019). More visual interaction with the environment during navigation has been shown to facilitate navigators’ spatial learning (Kapaj et al. Citation2023). We thus hypothesized that after long-term exposure to digital navigation aids, expert navigators would show less visual interaction with the environment in our video-based route-following task (Hypothesis 2). Cognitive load is generated during visuo-spatial information processing and encoding (Klimesch Citation1999; Osipova et al. Citation2006) and it is employed to indicate visuo-spatial working memory capacity in spatial navigation (Cheng et al. Citation2022; Cheng et al. Citation2023). We thus hypothesized that individuals with longer past exposure to in-car navigation aids would show greater cognitive load in a video-based route-following task because of the deterioration of visuo-spatial information encoding capacity (Hypothesis 3).
To test these hypotheses, we designed and implemented an in-lab, video-based navigation experiment. To study the cognitive and perceptual processes involved in navigation behavior and spatial learning performance, we employed a mixed-methods approach combining electroencephalogram (EEG) and eye tracking (ET) data collection methodologies with traditional behavioral measurement approaches (e.g., response accuracy). With the acquired EEG data, we could measure human brain electrocortical activity; specifically, we calculated the theta power in the frontal cortex, which has been suggested to be indicative of cognitive load during navigation (Cheng et al. Citation2022; Cheng et al. Citation2023). We also collected ET data to capture participants’ gaze behavior and computed relevant fixation-based and saccade-based metrics to study navigators’ visuo-spatial attention allocation and interaction processes with the traversed environment (Dong et al. Citation2022; Kapaj et al. Citation2023).
Background and Related Work
Spatial Learning Ability and Evaluation Methods
Navigators continuously acquire spatial knowledge when they interact with the surrounding environments (Block Citation1998). They encode spatial knowledge into memory and eventually form cognitive maps (Downs and Stea Citation2011). This process is defined as spatial learning. Spatial learning can occur directly by exploring environments from a first-person perspective or indirectly by learning external representations of the environment (e.g., maps, globes, bird’s-eye views; Zhang, Zherdeva, and Ekstrom Citation2014). In this spatial learning study, we focused on immediate intentional spatial learning during navigation, which is consistent with how people most commonly acquire spatial knowledge in daily situations. With this approach, we could better control for potential confounding effects related to other individual- and group-based abilities (e.g., map reading, etc.). Siegel and White’s (Citation1975) seminal contribution postulates the acquisition of spatial knowledge in three stages: landmark knowledge, route knowledge, and survey knowledge. Landmark knowledge refers to the identification and recall of spatial anchors in the environment (i.e., salient buildings, linear features such as a river, regions including neighborhoods, etc.). Route knowledge refers to the recall of landmark sequences constituting a route, which can facilitate one’s judgment of the connection between landmarks or turning behavior at route intersections. Survey knowledge refers to the configurational understanding of the environment, enabling navigators to self-localize and locate landmarks and routes using a Euclidean frame of reference from an allocentric perspective. Individuals could vary drastically in their ability to acquire these three types of spatial knowledge and to form map-like representations of complex environments in their memory; that is, they differ in their spatial learning ability (Ishikawa and Montello Citation2006; Weisberg and Newcombe Citation2018).
Behavioral methods based on researchers’ observations of participants and data extracted from explicit participant self-reports are the most commonly used approaches for evaluating spatial learning ability (Montello Citation2016). In addition to traditional behavioral methods, physiological measures (i.e., ET, EEG, etc.) have been used to reveal the cognitive mechanisms underlying spatial behavior. During spatial navigation, individuals differ in their ability to search for and selectively acquire geographic information from the environment (e.g., landmarks), which can be measured by tracking people’s eye movements (Kiefer et al. Citation2017). Navigation task-related brain activity data are increasingly leveraged to more deeply investigate spatial abilities and spatial behavior. The well-known London taxi driver studies mentioned earlier, for example, leveraged functional magnetic resonance imaging (fMRI) to evaluate the engagement of navigation-related brain regions when participants performed navigation tasks (e.g., route planning and route recall; Griesbauer et al. Citation2022). More recently, many researchers have preferred to employ the more flexible and mobile EEG data collection method, a noninvasive technique used to measure electrical activity in the human brain. For this approach, electrodes are placed on the surface of the participants’ scalps to measure the activity of cortical areas of interest relevant to the research question at hand. EEG has coarser spatial signal resolution than other neuroimaging approaches, such as fMRI, but it has excellent temporal signal resolution. Scalp-recorded oscillations captured in the frontal cortex in the theta-frequency range (i.e., 4–8 Hz) have long been associated with visual attention and memory-related processes, such as encoding new visual information into working memory and episodic memory, and during memory retrieval processes (Hsieh and Ranganath Citation2014). Increased theta power during information encoding and retrieval has been suggested to reflect greater cognitive demands. It is also associated with elevated task difficulty, which, consequently, could result in degraded task performance (Klimesch Citation1999). Previous studies in the context of cognitive load theory in instructional design and learning (Paas et al. Citation2003) suggest an increase in frontal theta power to serve as an indicator of higher levels of cognitive load of learners (Antonenko et al. Citation2010). Task-related cognitive load might also be affected by an individual’s cognitive capacity in a given task (Xie and Salvendy Citation2000). In their prediction model of mental workload, Xie and Salvendy (Citation2000) suggested that individuals with lower cognitive capacity might experience greater cognitive load in a given task than that imposed by the task itself. Scalp-recorded frontal theta activity has also been found to be sensitive to changes in cognitive demands for various navigation-related tasks (Lin et al. Citation2022; Liu et al. Citation2022). Cheng et al. (Citation2022; Cheng et al. Citation2023) reported an increase in frontal theta power and P300 amplitudes, as a measure of cognitive load during map-assisted navigation in virtual reality (VR), in parallel to an increasing frequency of landmark presentations on a mobile map. Sharma et al. (Citation2017) identified individual differences in navigation skills and spatial learning capacities using EEG activity. Drawing inspiration from these prior related navigation studies, we thus computed cognitive load indicators from frontal theta spectra to capture and study potential differences in participants’ cognitive capacity for encoding geographic information acquired from the environment during a route-following task.
The Influence of Mobile Navigation Aids on Individuals’ Spatial Cognition
Previous empirical map-assisted navigation studies have suggested that navigation aids negatively affect wayfinding performance and spatial knowledge acquisition (i.e., short-term effects). For example, pedestrian navigation studies have shown that mobile map-assisted navigators make more navigation errors and show lower navigation efficiency during wayfinding than when assisted with paper maps or when exploring the environment without any navigation aids (Ishikawa et al. Citation2008; Kuo, Chang, and Chu Citation2022). Other studies have shown that assisted navigators form less accurate cognitive maps (Münzer et al. Citation2006; Parush, Ahuvia, and Erev Citation2007; Willis et al. Citation2009) because they have worse spatial memory of the traversed environment (Brishtel et al. Citation2021; Sugimoto et al. Citation2022). Map-assisted driving studies have obtained consistent results. For example, in driving studies conducted in VR, drivers learned a route with or without an in-car navigation system and were subsequently asked to navigate to a given location by memory. Navigation-assisted driving was associated with worse navigation performance (Seminati et al. Citation2022) and greater cognitive load (Brishtel et al. Citation2021). Ben-Elia (Citation2021) extended driving experiments to a real-world environment and revealed similar degradation in drivers’ spatial learning when they used turn-by-turn route guidance. Several studies suggest that the distracted attention caused by navigation devices and the consequent disengagement from relevant environmental properties are the key reasons for poorer spatial learning in navigators (Leshed et al. Citation2008; Gardony, Brunyé, and Taylor Citation2015). Using ET technology, Hejtmánek et al. (Citation2018) reported a negative correlation between the time participants spent on mobile maps and their spatial learning performance. Another potential reason is that navigation aids make most spatial decisions for navigators, making it less necessary for them to encode, transform, and memorize elaborate spatial information (von Stülpnagel and Steffens Citation2013; Grinschgl, Papenmeier, and Meyerhoff Citation2021).
To date, only a handful of behavioral studies have investigated the long-term cognitive decline caused by prolonged reliance on navigation devices in daily routines (i.e., long-term effects). For example, Ishikawa (Citation2019) and Ruginski et al. (Citation2019) used self-report questionnaires to assess participants’ experience using navigation aids. Structural equation modeling analysis revealed the negative effects of accumulated Global Positioning System (GPS) experience on individuals’ wayfinding performance, spatial orientation, and spatial learning performance in a novel environment. Topete et al. (Citation2024) replicated this result in their investigation using a more comprehensive self-reported GPS dependency scale that differentiated across various navigation scenarios. Furthermore, a longitudinal study by Dahmani and Bohbot (Citation2020) reported that individuals who used navigation aids showed a steeper decline in spatial memory over time. In these studies, the cognitive and perceptual processes that could explain these behavioral outcomes have not been studied in detail. Studying these processes, however, could elucidate how the decline in spatial abilities with increased use of navigation technology could be mitigated.
Methods
Participants
A total of twenty-four male taxi drivers in Beijing participated in the experiment (see for background characteristics). We collected information on participants’ use of in-car navigation aids and other background information through interviews conducted before the video route-following portion of the study. Of the twenty-four participants, two (8 percent) reported that they had never used in-car navigation aids in their daily taxi driving. The other twenty drivers (92 percent) used auditory navigation instructions in different ways. We accordingly grouped participants into two navigation aids groups: low-dependence (LD) and high-dependence (HD). Specifically, the LD group used navigation assistance only when they felt it was necessary; that is, when they were unfamiliar with the environment, and thus felt unable to perform route planning themselves. The two participants who reported that they had never used navigation assistance were included in the LD group. In contrast, the HD group preferred to constantly use navigation devices while driving. Ultimately, eleven and thirteen participants were assigned to the LD and HD groups, respectively. Independent t tests of the two groups regarding the reported hours per day spent using in-car navigation aids also revealed significant differences in their dependence on in-car navigation aids (p < 0.001, Cohen’s d = 2.05). Furthermore, the two groups were balanced concerning a range of individual differences previously shown to influence navigation ability, including spatial ability and spatial anxiety assessed with the Santa Barbara Sense of Direction (SBSOD) Scale and the Spatial Anxiety Scale (Lawton Citation1994; Hegarty et al. Citation2002; Wolbers and Hegarty Citation2010), as well as demographic factors, such as age (Klencklen, Després, and Dufour Citation2012), educational background (Ritchie and Tucker-Drob Citation2018), nationality, culture, language (Coutrot et al. Citation2018), driving experience (Woollett and Maguire Citation2010), and living environment (Farzanfar et al. Citation2023). Following prior related research (i.e., Maguire et al. Citation2000), the two experimental groups were homogenous in terms of gender, a group difference factor that has been shown to influence navigation ability (Nazareth et al. Citation2019).
Table 1. Background characteristics of the two groups of participants
Participants were recruited using online and printed posters. They were required to complete an online questionnaire about their background information and in-car navigation aid usage habits, allowing us to prescreen for suitable participants. All participants had normal or corrected-to-normal vision, and none reported a history of neurological or psychiatric disease. Given the specialized participant group, namely, professional taxi drivers, we implemented an incentive for participation and a reward depending on their experimental performance to boost these expert navigators’ motivation and engagement in the experiment. Specifically, the remuneration they received depended on their accuracy in completing the first two tasks and the number of landmarks they marked on the correct route segment on the sketched map; these values were calculated immediately by the experimenter once participants finished the experiment. Participants were informed of these incentives before the experiment.
Materials and Experimental Design
This study followed a between-participants design. As shown in , participants were asked to watch real-world driving videos of given routes in an urban environment (learning phase) and to subsequently complete tasks, according to which we investigated their spatial knowledge acquisition ability. We designed the tasks by referring to and adapting previously used paradigms, as detailed further in what follows. Participants performed a scene recognition task in which their landmark knowledge was assessed (Wen, Ishikawa, and Sato Citation2014), a route recognition task in which their route knowledge was evaluated (Burte and Montello Citation2017), and a sketch mapping task in which their survey knowledge was examined (Ishikawa and Montello Citation2006). Participants completed all tasks without any time pressure.
Figure 1. Experimental design, procedure, and data analysis. (A) Materials and apparatus used in the experiment. (B) The experimental procedure. (C) The data analysis procedure of this study. Note: SBSOD = Santa Barbara Sense of Direction Scale; EEG = electroencephalography; ICA = independent component analysis; PSD = power spectral density.
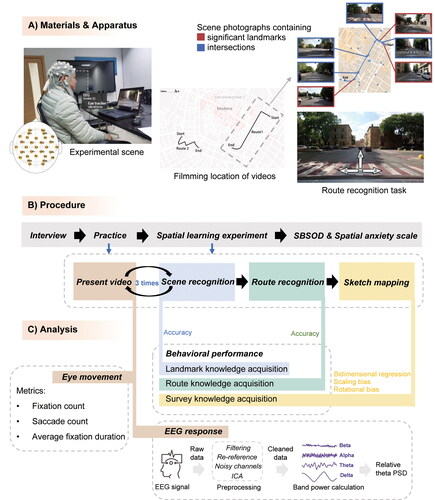
Learning Phase. The videos presented to the participants were obtained from the University of Modena’s public data set of driving scenarios DR(eye)VE (Palazzi et al. Citation2019), which shows driving scenes in Modena, Italy (). The videos were filmed with a wide-angle Garmin camera placed on the car’s roof at 1080 p/25 frames per second (fps). We selected videos filmed during the daytime under good weather conditions and removed scenes with temporary stops. We also slowed the chosen segments down to 75 percent of the original filming speed. After this process, we obtained two two-minute videos following two routes. Route 1 was approximately 1,000 m long and included four intersections; Route 2 was approximately 600 m long and included five intersections. We prepared one additional video with a one-minute and thirty-second duration, which was used as a training video for the practice trial before the actual experiment.
Scene Recognition Task. A set of photographs depicting random scenes from driving videos were presented to the participants. Half of the images came from the video presented in the learning phase and the other half came from other videos in the data set, which were also recorded in Modena but at other locations. The selected photographs contained significant landmarks or were taken at intersections (). Participants were asked to indicate with a yes or no answer whether the photographs came from the environment they had just learned from the driving video. In this task, there were fourteen and sixteen trials for Routes 1 and 2, respectively.
Route Recognition Task. Participants viewed photographs of intersections with superimposed arrows (pointing straight, to the right, or to the left; see for an example). The participants were asked to indicate which driving action matched the driving direction in the viewed video at that intersection.
Sketch Mapping Task. The photographs of scenes from the learned driving route were again presented to the participants in random order. The participants were asked to sketch a map of the driving route and then to mark the viewing positions of the photographs on this map.
Procedure
The Beijing Normal University Ethics Committee reviewed this study before it was conducted, and all participants provided informed consent. An overview of the experimental procedure used in the experiment is illustrated in . We first interviewed the participants for approximately twenty minutes to collect their demographic information (i.e., age, gender, educational background, year in which they started driving taxis, year in which they started using in-car navigation aids while driving, and working hours per day). We also asked them about their in-car navigation assistance systems use (i.e., hours per day using in-car navigation aids, when and how they would use navigation aids, including whether auditory instructions were used). Subsequently, the spatial learning experiment was explained to the participants. The experiment comprised a video-presenting phase, and the three tasks presented earlier were performed sequentially. The video was presented to the participants three times, with each presentation followed by the scene recognition task; that is, participants performed this task three times. After the last video presentation and subsequent scene recognition task, participants were asked to complete the route recognition task and the sketch mapping task. The participants first performed a practice trial, as explained earlier, to get familiar with the experimental procedure. After the practice trial, we connected participants to the eye tracker and the EEG device. Next, the participants completed the actual experiment with the two routes. Finally, they completed the SBSOD Scale and the Spatial Anxiety Scale. The participants took approximately 90 to 120 minutes to complete the entire experiment.
Apparatus
In this study, eye movement data were collected using an SMI RED250 eye tracker with a sampling rate of 120 Hz, sampling accuracy of 0.4°, and a spatial resolution of 0.03°. Participants’ brain activity was simultaneously recorded using a thirty-two-channel EEG device (Enobio 32) with a sampling rate of 500 Hz and a sampling bandwidth between 0 and 125 Hz. The distribution of electrodes is shown in . We ran our study using two laptops that we could easily carry. The reason for this was that data collection happened during the COVID-19 pandemic and our taxi drivers were not allowed to enter any campus facilities. To solve this problem, we ran the study on highly mobile laptops in an off-campus meeting room that we set up every day during data collection, together with recording devices that we transported from the campus research laboratory. One laptop was dedicated to practice trials without any data collection before the actual learning phase and to display stimuli for the sketch mapping task after the learning phase. This laptop featured a 13.3-inch screen with a resolution of 2560 × 1600 pixels. During the actual experiment, we used another laptop that featured a 15.6-inch screen with a screen resolution set to 1920 × 1080 pixels. It was used to simultaneously display the driving video and the photograph stimuli and to record all participant responses. This included gaze behavior, EEG, and behavioral responses for the scene recognition task and the route recognition task.
Data Processing and Analysis
illustrates the analysis framework used in this study, which involved eye movement and EEG response during the spatial learning phase, as well as behavioral performance in the subsequent tasks. In the following sections, we describe the data processing methods and analysis steps in detail.
Behavioral Data Analysis. For the scene recognition task and route recognition task, we used accuracy (calculated as the percentage of correctly answered trials relative to the total number of trials) to indicate participants’ performance. Notably, only the accuracy of participants completing the third scene recognition task was considered when calculating their final performance metrics. In the analysis of the collected sketch maps, we compared participants’ sketch maps with Google Maps of the driven area. The marked viewing positions of the scene photographs were imported as anchor points (instead of the landmarks themselves) into the Gardony Map Drawing Analyzer (GMDA: Gardony, Taylor, and Brunyé Citation2016). As indicators of participants’ sketch mapping accuracy, we applied the GMDA to compute the bidimensional regression index (r2), absolute scaling bias, and absolute rotational bias. To calculate the scaling bias, the interlandmark distances were first scale-equalized by dividing the distance between every two landmarks by the maximum interlandmark distance on the map. The differences between the interlandmark distance ratios of the sketch map and the Google Map were subsequently summed. The rotational bias was calculated in the same way but using the interlandmark direction instead of the interlandmark distance. Therefore, a larger scaling bias and a larger rotational bias, respectively, represented a significant deviation in the distance and direction between anchor points. Hence, all three metrics capture distortions of the sketch map compared to Google Map.
Eye Movement Analysis. Basic fixation-related and saccade-related eye movement metrics can represent participants’ visual attention allocation and visual information acquisition during navigation (Kiefer et al. Citation2017). We calculated participants’ fixation count, saccade count, and average fixation duration during the learning phase. These three eye movement metrics have been meaningfully used in previous research to assess navigators’ visual attention allocation (Brügger, Richter, and Fabrikant Citation2019; Dong et al. Citation2022). Although pupil dilation is also a commonly used indicator—for example, when comparing within-subject differences in cognitive load during static map reading (Kiefer et al. Citation2017)—our study followed a between-subjects design using dynamic videos with changing image characteristics. Therefore, we leveraged EEG methodology to study cognitive load instead. The definitions and meanings of these metrics are interpreted as follows:
Fixation count: A greater fixation count suggests that participants attended to more visual information.
Saccade count: A greater saccade count suggests that participants moved their eyes more, for example, when searching for visual information.
Average fixation duration (in milliseconds): A longer average fixation duration indicates that participants are either more interested in the attended visual information or have greater difficulty understanding this information and thus show less efficiency in interpreting visually attended information.
We excluded participants with sample rates lower than 80 percent, which were calculated by dividing the number of correctly identified ET samples by the number of attempts. This meant that after preprocessing, seventeen participants were included in the data analysis for Route 1 (NLD = 9, NHD = 8), and fifteen participants were included for Route 2 (NLD = 9, NHD = 6).
EEG Analysis. All the raw data were input into EEGLAB v2021.0 (Delorme and Makeig Citation2004) run in MATLAB (version 2018a) for preprocessing. We first applied a high-pass filter with a 0.01-Hz cutoff frequency and a low-pass filter with a 40-Hz cutoff to remove high-frequency artifact and low-frequency drift. Then, all electrodes were referenced to Cz. The Clean_rawdata toolbox in EEGLAB was subsequently used to automatically identify channels containing significant noise. These bad channels were then removed and replaced with interpolated data using spline interpolation. Next, we performed independent component analysis and used the ICLabel toolbox (Pion-Tonachini, Kreutz-Delgado, and Makeig Citation2019) in EEGLAB to identify and label independent components (ICs). ICs with a greater than 80 percent probability of being classified as eye or muscle activity were removed.
We used the mouse click recorded in the ET data to identify the exact start time for presenting each video during the learning phase. Based on this information, we extracted the learning phase as EEG events with a duration of 120 seconds, the same as the video duration. At this stage of data processing, we excluded data from one participant for Route 1 and four participants for Route 2, as we failed to synchronize the mouse click event with the EEG data. Finally, the EEG data of twenty-three participants for Route 1 (NLD = 11, NHD = 12) and twenty participants for Route 2 (NLD = 8, NHD = 12) were left for subsequent analysis.
We then performed a power spectrum analysis on each epoch of the cleaned EEG data using EEGLAB. Given that we were particularly interested in theta power in the frontal cortex, we selected five electrodes—Fz, F3, F4, AF3, and AF4—located in this brain region for analysis (see for the location of the electrodes). We applied the periodogram to compute the power spectral density (PSD) of the specific frequency range. To reduce the impact of individual differences in the absolute PSD on the results of the current between-participants design study, we referred to previous studies using relative power (Bian et al. Citation2014; Cheng et al. Citation2022) and calculated the relative PSD in the theta band using the following equation.
We further analyzed the Fz electrode data to determine changes in the relative PSD over time. We first split the learning phase EEG epoch into five-second time windows with one-second intervals. Subsequently, each EEG video event yielded 115 continuous EEG epochs. We then performed the power spectrum analysis as described earlier on these epochs.
Statistical Analysis. We conducted statistical tests between the LD and HD experimental groups. We applied the Scheirer–Ray–Hare test to analyze the behavioral data. For the continuous psychophysiological variables derived from the background characteristics, eye movement, and EEG data, we conducted independent t tests or Mann–Whitney U tests, depending on whether the data were normally distributed. For the categorical variables, we employed the chi-square test.
Results
In the following sections, we first report on the behavioral performance of the participants in the two experimental groups as a direct indicator of their spatial learning ability modulated by navigation aid use. Then, we present the results of the eye movement and EEG analyses during the spatial learning phase.
Behavioral Performance
shows the summary statistics for participants’ performance in the scene recognition, route recognition, and sketch mapping tasks. The Scheirer–Ray–Hare test revealed that the scene recognition accuracy of the LD group (Mroute1 = 0.77, SDroute1 = 0.13; Mroute2 = 0.90, SDroute2 = 0.07) was significantly better than that of the HD group (Mroute1 = 0.66, SDroute1 = 0.16; Mroute2 = 0.79, SDroute2 = 0.14, H = 5.57, p = 0.02, η2 = 0.13). We also found a main effect of the route in this task (H = 9.79, p = 0.002; η2 = 0.17). Participants performed better on Route 2 than on Route 1.
Figure 2. Comparison of the behavioral performance of the low-dependence (LD) and high-dependence (HD) groups. (A) Accuracy in the scene recognition task. (B) Accuracy in the route recognition task. (C) r2 of the sketch map. (D) Scaling bias of the sketch map. (E) Rotational bias of the sketch map. Note: ns = p > 0.05. *p < 0.05. **p < 0.01.
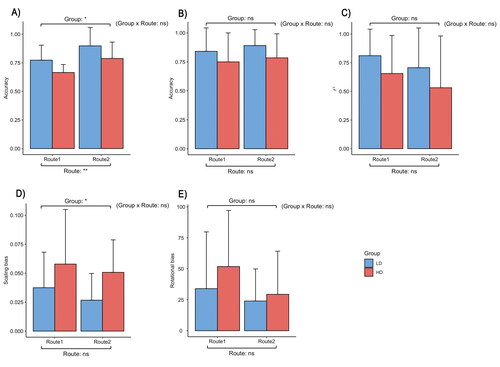
There was no significant difference in accuracy in the route recognition task between the LD (Mroute1 = 0.84, SDroute1 = 0.20; Mroute2 = 0.89, SDroute2 = 0.13) and the HD groups (Mroute1 = 0.75, SDroute1 = 0.25; Mroute2 = 0.78, SDroute2 = 0.21; H = 2.49, p = 0.12, η2 = 0.06). Additionally, for the sketch mapping task, no significant differences in r2 (H = 2.74, p = 0.10, η2 = 0.06) or rotational bias (H = 1.11, p = 0.29, η2 = 0.02) were found across the experimental groups. A significant difference in scaling bias was found, however, between the LD (Mroute1 = 0.04, SDroute1 = 0.03; Mroute2 = 0.03, SDroute2 = 0.02) and the HD groups (Mroute1 = 0.06, SDroute1 = 0.05; Mroute2 = 0.05, SDroute2 = 0.03; H = 4.03, p = 0.045, η2 = 0.10), indicating that participants in the LD group could better estimate the interlandmark distance. For all five indicators, no interaction effects were detected between the experimental group and the experimental route (p > 0.05).
Eye Movement
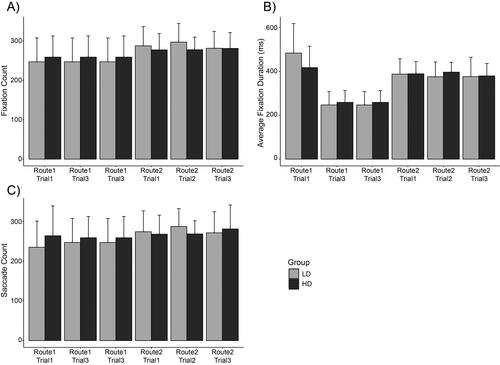
Regarding fixation behavior and saccade behavior, as shown in , we found no statistically significant differences in fixation count, saccade count, or average fixation duration between the LD and the HD groups (p > 0.05) for either route. The eye movement results indicated that participants in the two groups did not differ in the amount of visual information searched or processed during spatial learning or the efficiency of processing visual information.
Figure 3. Results of eye movement metrics. (A) Fixation count. (B) Average fixation duration (ms). (C) Saccade count.
Cognitive Load
We analyzed the relative theta PSD in the selected frontal electrodes (i.e., Fz, F3, F4, AF3, and AF4) while participants watched the driving videos to indicate their cognitive load during the learning phase. The Route 1 results are shown in . Taking Fz as an example, the average relative theta PSD of the LD group was lower than that of the HD group in all three trials, and the difference was significant in the second trial (MLD = 0.07, SDLD = 0.04; MHD = 0.13, SDHD = 0.04, p = 0.03, η2 = 0.41). The statistical analysis results for all trials are shown in and in the Appendix.
Figure 4. Electroencephalography (EEG) results for Route 1. (A) Relative theta power spectral density (PSD) of EEG data from five frontal electrodes (Fz, F3, F4, AF3, and AF4) were significantly different between the low-dependence (LD) group and high-dependence (HD) group in several trials. (B) The relative theta PSD of the Fz electrode is mapped along the navigated route, indicating the spatial context of the recorded cognitive load. The locations of intersections and route segments are also labeled on the map. (C) Statistical analysis of the relative theta PSD for each intersection and route segment. Note: *p < 0.05. **p < 0.01.
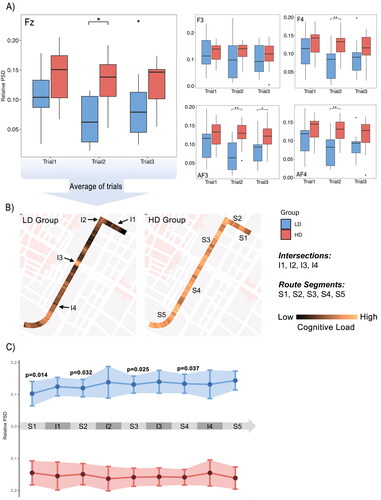
We further visualized the relative PSD of the Fz electrode on the map to indicate the cognitive load of participants according to location; that is, when the car used to record the video traveled to a certain point. To achieve this, we used the driving speed data from the DR(eye)VE data set (twenty-five records per second) to calculate and normalize the driving distance per second. We then averaged the Fz relative PSD over time (as described in the Methods section) in the three trials and matched the outcomes with the preceding distance series. The results were visualized and overlapped with Google Maps as a base map (). We found differences in the spatial distribution of the calculated Fz relative PSD in terms of intersections and route segments separated by intersections across experimental groups. The reason for this difference could be explained by the cognitive load of participants in the LD group, which only sharply increased at intersections. Conversely, participants in the HD group demonstrated high cognitive load throughout the entire route and did not show any significant cognitive load differences between intersections and route segments. Further statistical analysis revealed the cognitive load of the LD group to be significantly lower than that of the HD group for the first four route segments (p < 0.05), with no significant difference between the two groups at intersections (). We observed similar results for Route 2, as shown in in the Appendix.
Discussion
In this research, we compared two groups of Beijing taxi drivers with different levels of dependence on in-car navigation aids in their visual attention and cognitive load during a video-based route-following task and their spatial knowledge acquisition performance. With this experiment, we aimed to address the proposed research question of whether and how in-car navigation aids impair the spatial learning ability of expert navigators. We found that participants with greater dependence on in-car navigation aids had worse performance in the scene recognition task, and there was greater distortion in the interlandmark distance but not in the interlandmark direction in the sketch maps they drew. There were no significant group differences, however, in the route recognition task. Cognitive indicators from the EEG data demonstrated that greater dependence on in-car navigation aids might be linked to greater cognitive load. Eye movement metric results revealed no group differences in either fixation behavior or saccade behavior. Overall, these results support Hypothesis 3 and partly support Hypothesis 1. They also suggest that Hypothesis 2 should be rejected. In the following sections, we discuss the empirical behavioral, visual attention, and brain activity results in detail within the context of the findings of the state-of-the-art literature.
In-Car Navigation Aids Impair Participants’ Ability to Acquire Landmark Knowledge and Survey Knowledge but Not Route Knowledge
According to the behavioral results, the LD group outperformed the HD group in acquiring low-level landmark knowledge and in using high-level survey knowledge to estimate interlandmark distance. These findings support our hypothesis and partly replicate the results of previous research using structural equation modeling (Ruginski et al. Citation2019). Contrary to their findings, though, participants in our experiment showed no significant group difference in estimating the distance between landmarks. This discrepancy could be attributed to the difference in experimental design because participants in their experiment performed distance estimation from an egocentric perspective, whereas in our experiment, they drew sketch maps from an allocentric perspective. Another possibility is that in their investigation of participants’ experiences using navigation aids, they did not distinguish pedestrian navigation aids from in-car navigation aids, whereas we focused on only in-car aids.
Contrary to our expectations, route knowledge acquisition did not differ by group. One possible explanation might be that the route recognition task requires participants to remember a series of consecutive actions, which is exactly what turn-by-turn navigation instructions emphasize (e.g., “Turn left at the next intersection”). To our knowledge, only two previous studies related to turn-by-turn in-car navigation aids have used the same task to assess participants’ performance in acquiring route knowledge. Kelly, Lim, and Carpenter (Citation2022) reported that using turn-by-turn navigation aids did not impair route recognition performance. Ben-Elia (Citation2021) demonstrated that using in-car navigation aids affected route knowledge acquisition less than landmark knowledge acquisition. Furthermore, our findings corroborate the previously proposed idea that the three types of spatial knowledge are acquired independently and simultaneously, without the need to acquire high-level knowledge on the basis of low-level knowledge (Montello Citation1998; Meilinger, Frankenstein, and Bülthoff Citation2013; Kim and Bock Citation2021). Otherwise, we should have observed accordant results in all three tasks.
Additionally, we found a significant main effect of route on landmark knowledge acquisition. Participants showed better spatial knowledge acquisition performance for Route 2 than for Route 1. This difference might be because Route 2 has a more complex structure and scenery, providing participants with more recognizable landmarks. This finding adds to the existing evidence suggesting that the appearance and structure of an environment have an impact on navigators’ perception and cognition of space (Manley, Filomena, and Mavros Citation2021) and their navigational behavior (Yesiltepe et al. Citation2023). In future research, the complexity of the experimental environment and the salience of landmarks presented to participants could be controlled to further investigate this issue. In addition to environmental complexity, individuals’ prior knowledge of a structured environment (e.g., a particular type of city), conceptualized as spatial schemas, might influence their spatial learning in environments resembling familiar environments. Specifically, a spatial schema has been demonstrated to interfere with the acquisition of spatial knowledge from novel environments with schema-incongruent elements but rather facilitates the acquisition of spatial knowledge from similar environments with schema-congruent elements (Farzanfar et al. Citation2023). In this study, we used the city of Modena, which is significantly different from Beijing in terms of structure and cityscape, as our study area. Future investigations should consider spatial schemas and use similar structured environments more familiar to participants.
This Impairment Stems from Cognitive Processes During Spatial Learning: Evidence from Eye Movement and EEG Response Data
As mentioned earlier, we did not observe significant differences between the LD and HD groups in terms of their eye movement behavior according to fixation-related and saccade-related metrics. The recorded EEG data, however, show that the HD group exhibited greater frontal relative theta PSD, which might suggest a greater cognitive load of the HD group during spatial learning compared to the LD group. Taking these findings together, it appears that long-term use of in-car navigation aids does not affect the allocation of visual attention to environmental information but does affect subsequent cognitive mechanisms—in other words, the process of encoding this visuo-spatial information into memory. Theta spectral power in the frontal cortex, as observed in the HD group, could also be explained by a potential increase in cognitive difficulty (Antonenko et al. Citation2010; Maurer et al. Citation2015), thus further implying that task demands exceeded participants’ already limited cognitive resources in the HD group. This has already been shown in related tasks such as spatial learning, driving, and navigation (Young et al. Citation2015; Cheng et al. Citation2022; Cheng et al. Citation2023). A possible explanation for the greater cognitive load of the HD group, therefore, might be that participants in this group encountered more difficulty in both processing the visual information perceived from the environment and encoding it into spatial knowledge. This inference from both the visual attention and EEG data aligns with previous research demonstrating that the accuracy of cognitive maps formed by individuals during environmental exploration is not associated with visual information input but with individuals’ ability to encode such information (Keller and Sutton Citation2022).
There are, however, other possible explanations for the eye movement results considering the participant characteristics, the experimental design, and the experimental environment. As participants’ in-car navigation aid use habits mainly involve following auditory instructions, they do not have to pay attention to the mobile maps visually presented on their devices during daily driving. The division of nonvisual attention by auditory aids (Gardony et al. Citation2013), therefore, could lead to long-term cognitive decline in individuals without affecting gaze behavior. Moreover, the driving videos used as stimuli in our experiment were recorded with a forward-facing fixed-view camera. Therefore, participants mainly observed the presented environmental information ahead of the road. According to previous findings, however, digital navigation aids could also influence the distribution of eye fixations to both sides of (Haupt, van Nes, and Risser Citation2015) and behind (Brügger, Richter, and Fabrikant Citation2018) the body on the ground during navigation, which is not discussed in this article. The videos were presented to participants on a flat, two-dimensional, and nonimmersive laptop screen of arguably small size. In more immersive virtual environment test settings (i.e., stereoscopic VR, etc.), additional sensory inputs such as auditory cues and body-based cues could be included and possibly contribute further to spatial learning (Steel, Robertson, and Taube Citation2021). Although previous studies suggest that the intensity of immersion has little impact overall on spatial learning performance (Zhao et al. Citation2020; Dong et al. Citation2022), greater immersion could lead to distinct changes in visual attention distribution during navigation (Dong et al. Citation2022). Additionally, larger screen sizes and higher display resolutions in virtual environments have been reported to benefit navigators in searching for and navigating to a destination (Ni, Bowman, and Chen Citation2006). In a future study, our findings, especially concerning eye movement behaviors, could be compared to immersive, large-screen, head-mounted VR, or real-world study settings.
A Comparison of Intersections and Route Segments
Previous studies have described the beneficial effect of acquiring spatial information at intersections on understanding the configuration of space, developing an internal representation of the environment, and navigating in that environment (Klippel and Winter Citation2005). In this study, we found that the two experimental groups differed in their spatial distribution pattern of the calculated Fz relative PSD, which might be explained by the distinct increase in cognitive load at intersections for the LD group, compared to the overall high cognitive load throughout the entire route for the HD group. Previous research has shown that theta power increases with increasing use of cognitive resources (Sauseng et al. Citation2010; Puma et al. Citation2018), especially when tasks require sustained concentration (Gevins and Smith Citation2003). Therefore, a possible explanation for our findings might be that the LD group tended to allocate more cognitive resources to processing information at intersections, whereas the HD group used approximately the same cognitive resources along route segments and at intersections. In other words, long-term dependence on in-car navigation aids might affect spatial learning strategies and increase the difficulty of efficiently allocating cognitive resources.
Limitations and Future Work
Based on our experimental design, participants were informed before the experiment that there would be a spatial knowledge test, and that they would receive rewards for better performance. This leads to intentional learning, which, although still controversial, is considered to potentially affect spatial learning performance (Van Asselen, Fritschy, and Postma Citation2006). Future studies could target specifically incidental learning to further assess our findings. Moreover, we focused on turn-by-turn auditory assistance due to the in-car navigation aid use habits of our particular pool of participants. Further empirical studies are needed to examine our findings on navigation aids with various design elements, which have been shown in prior studies to affect spatial learning performance; these include different automatization levels (Brügger, Richter, and Fabrikant Citation2019), different interactions between users and devices (Richter, Dara-Abrams, and Raubal Citation2010), and different methods for presenting spatial information (Ishikawa and Takahashi Citation2014). Follow-up research could also target other cognitive processes of navigation (e.g., route planning). Another limitation of this study is the small participant group due to the difficulty of conducting on-site experiments during the COVID-19 pandemic and recruiting participants from such a specialized professional group of expert navigators. Moreover, because data collection happened in a mobile research lab and we could only use laptops with arguably small display sizes for this reason, future studies could further investigate how display size (beyond traditional laptop screens) and immersiveness (i.e., in VR) might influence the results. It would also be interesting to increase participants’ activity in the experiment, for example, by allowing them to actively explore the environment themselves, which has been shown to lead to different outcomes than those obtained via passive learning settings, as applied in this study (Chrastil and Warren Citation2012). Furthermore, in a between-subjects study, we cannot eliminate the influence of differences in individual characteristics on the experimental results. In future investigations, longitudinal within-subjects experiments could be conducted, and participants’ spatial learning abilities and navigation system use habits could be recorded over time.
Additionally, recent studies have indicated that several specific brain areas, including the hippocampal, parahippocampal, entorhinal, and retrosplenial cortices, play crucial roles in human navigation and cognitive map formation (Epstein et al. Citation2017). The activity of these deep brain structures, however, cannot be detected well by the thirty-two-channel scalp EEG system used in this study, considering the difficulty and inaccuracy of inferring the brain region location according to the neuronal activity measured on the scalp. Therefore, another future research direction is to use neuroimaging techniques with higher spatial resolution, such as fMRI and magnetoencephalography (MEG), to explore the influence of mobile navigation aids on the structure and function of specific brain regions related to spatial information encoding, spatial memory, and spatial decision-making.
Conclusions
Our empirical results for participants’ behavioral performance, eye movement, and EEG activity indicated that long-term dependence on in-car navigation aids can deteriorate expert navigators’ spatial learning ability. Specifically, greater dependence on in-car navigation systems might increase participants’ difficulty in encoding visual-spatial information, leading to a significantly greater cognitive load with the same amount of visual input. We suggest that this is the reason for the behavioral difference we observed in their performance in acquiring landmark knowledge and survey knowledge from the explored environment and might explain how in-car navigation aids lead to cognitive decline in frequent users.
This study contributes to the ongoing debate on the long-term impacts of digital technology on human cognitive ability (Cecutti, Chemero, and Lee Citation2021) by elaborating on the detrimental effects of the enhancement of geographical information technology on individuals’ spatial learning ability. Moreover, by empirically exploring how this navigation-related cognitive decline occurs, our study has implications for the design and development of future navigation systems, which could encourage users to use more of their inherent capacity and acquired spatial knowledge instead of overlying on navigation instructions in the digital era.
Acknowledgments
We thank Yilong Liu for his help with data collection and all the participants who took the time to participate in this experiment. We greatly appreciate the thoughtful and constructive feedback received from the editor and all anonymous reviewers.
Disclosure Statement
No potential conflict of interest was reported by the authors.
Additional information
Funding
Notes on contributors
Qi Ying
QI YING completed her master’s degree at Beijing Normal University where this study was carried out in the context of her thesis project. She is now a PhD Candidate in the Department of Geography, University of Zurich, Winterthurerstr. 190, CH-8057 Zürich, Switzerland. E-mail: [email protected]. Her research interests include map-assisted navigation and spatial cognition.
Weihua Dong
WEIHUA DONG is a Professor in the Faculty of Geographical Science, Beijing Normal University, Beijing 100875, China. E-mail: [email protected]. His research interests include GIScience and spatial cognition.
Sara Irina Fabrikant
SARA IRINA FABRIKANT is a Professor in the Department of Geography, University of Zurich, Winterthurerstr. 190, CH-8057 Zürich, Switzerland. E-mail: [email protected]. Her research interests include geovisual analytics, GIScience and cognition, and dynamic cartography.
Notes
References
- Antonenko, P., F. Paas, R. Grabner, and T. Van Gog. 2010. Using electroencephalography to measure cognitive load. Educational Psychology Review 22 (4):425–38. doi: 10.1007/s10648-010-9130-y.
- Aporta, C., and E. Higgs. 2005. Satellite culture: Global positioning systems, Inuit wayfinding, and the need for a new account of technology. Current Anthropology 46 (5):729–53. doi: 10.1086/432651.
- Ben-Elia, E. 2021. An exploratory real-world wayfinding experiment: A comparison of drivers’ spatial learning with a paper map vs. turn-by-turn audiovisual route guidance. Transportation Research Interdisciplinary Perspectives 9:100280. doi: 10.1016/j.trip.2020.100280.
- Bian, Z., Q. Li, L. Wang, C. Lu, S. Yin, and X. Li. 2014. Relative power and coherence of EEG series are related to amnestic mild cognitive impairment in diabetes. Frontiers in Aging Neuroscience 6:11. doi: 10.3389/fnagi.2014.00011.
- Block, R. A. 1998. Psychological time and the processing of spatial information. New York: Oxford University Press.
- Brishtel, I., T. Schmidt, I. Vozniak, J. R. Rambach, B. Mirbach, and D. Stricker. 2021. To drive or to be driven? The impact of autopilot, navigation system, and printed maps on driver’s cognitive workload and spatial knowledge. ISPRS International Journal of Geo-Information 10 (10):668. doi: 10.3390/ijgi10100668.
- Brügger, A., K.-F. Richter, and S. I. Fabrikant. 2018. Which egocentric direction suffers from visual attention during aided wayfinding? In Eye tracking for spatial research: Proceedings of the 3rd International Workshop, ed. P. Kiefer, I. Giannopoulos, F. Göbel, M. Raubal, and A. T. Duchowski, 22–27. ETH Zurich.
- Brügger, A., K.-F. Richter, and S. I. Fabrikant. 2019. How does navigation system behavior influence human behavior? Cognitive Research: Principles and Implications 4 (1):5. doi: 10.1186/s41235-019-0156-5.
- Burte, H., and D. R. Montello. 2017. How sense-of-direction and learning intentionality relate to spatial knowledge acquisition in the environment. Cognitive Research: Principles and Implications 2 (1):18. doi: 10.1186/s41235-017-0057-4.
- Cecutti, L., A. Chemero, and S. W. Lee. 2021. Technology may change cognition without necessarily harming it. Nature Human Behaviour 5 (8):973–75. doi: 10.1038/s41562-021-01162-0.
- Cheng, B., E. Lin, A. Wunderlich, K. Gramann, and S. I. Fabrikant. 2023. Using spontaneous eye blink-related brain activity to investigate cognitive load during mobile map-assisted navigation. Frontiers in Neuroscience 17:1024583. doi: 10.3389/fnins.2023.1024583.
- Cheng, B., A. Wunderlich, K. Gramann, E. Lin, and S. I. Fabrikant. 2022. The effect of landmark visualization in mobile maps on brain activity during navigation: A virtual reality study. Frontiers in Virtual Reality 3:625. doi: 10.3389/frvir.2022.981625.
- Chrastil, E. R., and W. H. Warren. 2012. Active and passive contributions to spatial learning. Psychonomic Bulletin & Review 19 (1):1–23. doi: 10.3758/s13423-011-0182-x.
- Coutrot, A., R. Silva, E. Manley, W. de Cothi, S. Sami, V. D. Bohbot, J. M. Wiener, C. Hölscher, R. C. Dalton, M. Hornberger, et al. 2018. Global determinants of navigation ability. Current Biology 28 (17):2861–66. doi: 10.1016/j.cub.2018.06.009.
- Dahmani, L., and V. D. Bohbot. 2020. Habitual use of GPS negatively impacts spatial memory during self-guided navigation. Scientific Reports 10 (1):6310. doi: 10.1038/s41598-020-62877-0.
- Delorme, A., and S. Makeig. 2004. EEGLAB: An open source toolbox for analysis of single-trial EEG dynamics including independent component analysis. Journal of Neuroscience Methods 134 (1):9–21. doi: 10.1016/j.jneumeth.2003.10.009.
- Dong, W., T. Qin, T. Yang, H. Liao, B. Liu, L. Meng, and Y. Liu. 2022. Wayfinding behavior and spatial knowledge acquisition: Are they the same in virtual reality and in real-world environments? Annals of the American Association of Geographers 112 (1):226–46. doi: 10.1080/24694452.2021.1894088.
- Downs, R. M., and D. Stea. 2011. Cognitive maps and spatial behaviour: Process and products. In The map reader: Theories of mapping practice and cartographic representation, ed. M. Dodge, R. Kitchin, and C. Perkins, 312–17. New York and London: Taylor & Francis.
- Epstein, R. A., E. Z. Patai, J. B. Julian, and H. J. Spiers. 2017. The cognitive map in humans: Spatial navigation and beyond. Nature Neuroscience 20 (11):1504–13. doi: 10.1038/nn.4656.
- Farzanfar, D., H. J. Spiers, M. Moscovitch, and R. S. Rosenbaum. 2023. From cognitive maps to spatial schemas. Nature Reviews. Neuroscience 24 (2):63–79. doi: 10.1038/s41583-022-00655-9.
- Gardony, A. L., T. T. Brunyé, C. R. Mahoney, and H. A. Taylor. 2013. How navigational aids impair spatial memory: Evidence for divided attention. Spatial Cognition & Computation 13 (4):319–50. doi: 10.1080/13875868.2013.792821.
- Gardony, A. L., T. T. Brunyé, and H. A. Taylor. 2015. Navigational aids and spatial memory impairment: The role of divided attention. Spatial Cognition & Computation 15 (4):246–84. doi: 10.1080/13875868.2015.1059432.
- Gardony, A. L., H. A. Taylor, and T. T. Brunyé. 2016. Gardony map drawing analyzer: Software for quantitative analysis of sketch maps. Behavior Research Methods 48 (1):151–77. doi: 10.3758/s13428-014-0556-x.
- Gevins, A., and M. E. Smith. 2003. Neurophysiological measures of cognitive workload during human–computer interaction. Theoretical Issues in Ergonomics Science 4 (1–2):113–31. doi: 10.1080/14639220210159717.
- Girardin, F., and J. Blat. 2010. The co-evolution of taxi drivers and their in-car navigation systems. Pervasive and Mobile Computing 6 (4):424–34. doi: 10.1016/j.pmcj.2010.03.002.
- Griesbauer, E., E. Manley, J. M. Wiener, and H. J. Spiers. 2022. London taxi drivers: A review of neurocognitive studies and an exploration of how they build their cognitive map of London. Hippocampus 32 (1):3–20. doi: 10.1002/hipo.23395.
- Grinschgl, S., F. Papenmeier, and H. S. Meyerhoff. 2021. Consequences of cognitive offloading: Boosting performance but diminishing memory. Quarterly Journal of Experimental Psychology 74 (9):1477–96. doi: 10.1177/17470218211008060.
- Haupt, J., N. van Nes, and R. Risser. 2015. Look where you have to go! A field study comparing looking behaviour at urban intersections using a navigation system or a printed route instruction. Transportation Research Part F: Traffic Psychology and Behaviour 34:122–40. doi: 10.1016/j.trf.2015.07.018.
- Hegarty, M., A. E. Richardson, D. R. Montello, K. Lovelace, and I. Subbiah. 2002. Development of a self-report measure of environmental spatial ability. Intelligence 30 (5):425–47. doi: 10.1016/S0160-2896(02)00116-2.
- Hejtmánek, L., I. Oravcová, J. Motýl, J. Horáček, and I. Fajnerová. 2018. Spatial knowledge impairment after GPS guided navigation: Eye-tracking study in a virtual town. International Journal of Human–Computer Studies 116:15–24. doi: 10.1016/j.ijhcs.2018.04.006.
- Hsieh, L.-T., and C. Ranganath. 2014. Frontal midline theta oscillations during working memory maintenance and episodic encoding and retrieval. NeuroImage 85 (Pt. 2):721–29. doi: 10.1016/j.neuroimage.2013.08.003.
- Ishikawa, T. 2019. Satellite navigation and geospatial awareness: Long-term effects of using navigation tools on wayfinding and spatial orientation. The Professional Geographer 71 (2):197–209. doi: 10.1080/00330124.2018.1479970.
- Ishikawa, T., H. Fujiwara, O. Imai, and A. Okabe. 2008. Wayfinding with a GPS-based mobile navigation system: A comparison with maps and direct experience. Journal of Environmental Psychology 28 (1):74–82. doi: 10.1016/j.jenvp.2007.09.002.
- Ishikawa, T., and D. R. Montello. 2006. Spatial knowledge acquisition from direct experience in the environment: Individual differences in the development of metric knowledge and the integration of separately learned places. Cognitive Psychology 52 (2):93–129. doi: 10.1016/j.cogpsych.2005.08.003.
- Ishikawa, T., and K. Takahashi. 2014. Relationships between methods for presenting information on navigation tools and users’ wayfinding behavior. Cartographic Perspectives 75:17–28. doi: 10.14714/CP75.82.
- Kapaj, A., S. Lanini-Maggi, C. Hilton, B. Cheng, and S. I. Fabrikant. 2023. How does the design of landmarks on a mobile map influence wayfinding experts’ spatial learning during a real-world navigation task? Cartography and Geographic Information Science 50 (2):197–213. doi: 10.1080/15230406.2023.2183525.
- Keller, M., and J. E. Sutton. 2022. Individual differences in the allocation of visual attention during navigation. Canadian Journal of Experimental Psychology/Revue Canadienne de Psychologie Expérimentale 76 (1):10–21. doi: 10.1037/cep0000247.
- Kelly, J. W., A. F. Lim, and S. K. Carpenter. 2022. Turn-by-turn route guidance does not impair route learning. Journal of Applied Research in Memory and Cognition 11 (1):76–84. doi: 10.1016/j.jarmac.2021.06.001.
- Kiefer, P., I. Giannopoulos, M. Raubal, and A. Duchowski. 2017. Eye tracking for spatial research: Cognition, computation, challenges. Spatial Cognition & Computation 17 (1–2):1–19. doi: 10.1080/13875868.2016.1254634.
- Kim, K., and O. Bock. 2021. Acquisition of landmark, route, and survey knowledge in a wayfinding task: In stages or in parallel? Psychological Research 85 (5):2098–2106. doi: 10.1007/s00426-020-01384-3.
- Klencklen, G., O. Després, and A. Dufour. 2012. What do we know about aging and spatial cognition? Reviews and perspectives. Ageing Research Reviews 11 (1):123–35. doi: 10.1016/j.arr.2011.10.001.
- Klimesch, W. 1999. EEG alpha and theta oscillations reflect cognitive and memory performance: A review and analysis. Brain Research Reviews 29 (2–3):169–95. doi: 10.1016/S0165-0173(98)00056-3.
- Klippel, A., and S. Winter. 2005. Structural salience of landmarks for route directions. In Spatial information theory, Vol. 3693, ed. A. G. Cohn and D. M. Mark, 347–62. Berlin: Springer. doi: 10.1007/11556114_22.
- Kuo, T.-Y., Y.-J. Chang, and H.-K. Chu. 2022. Investigating four navigation aids for supporting navigator performance and independence in virtual reality. International Journal of Human–Computer Interaction 39 (12):2524–41. doi: 10.1080/10447318.2022.2078926.
- Lawton, C. A. 1994. Gender differences in way-finding strategies: Relationship to spatial ability and spatial anxiety. Sex Roles 30 (11–12):765–79. doi: 10.1007/BF01544230.
- Leshed, G., T. Velden, O. Rieger, B. Kot, and P. Sengers. 2008. In-car GPS navigation: Engagement with and disengagement from the environment. In Proceedings of the SIGCHI conference on human factors in computing systems, ed. M. Czerwinski, A. Lund, and D. Tan, 1675–84. New York: Association for Computing Machinery.
- Lin, M.-H., O. Liran, N. Bauer, and T. E. Baker. 2022. Scalp recorded theta activity is modulated by reward, direction, and speed during virtual navigation in freely moving humans. Scientific Reports 12 (1):2041. doi: 10.1038/s41598-022-05955-9.
- Liu, J., A. K. Singh, A. Wunderlich, K. Gramann, and C.-T. Lin. 2022. Redesigning navigational aids using virtual global landmarks to improve spatial knowledge retrieval. NPJ Science of Learning 7 (1):17. doi: 10.1038/s41539-022-00132-z.
- Maguire, E. A., D. G. Gadian, I. S. Johnsrude, C. D. Good, J. Ashburner, R. S. Frackowiak, and C. D. Frith. 2000. Navigation-related structural change in the hippocampi of taxi drivers. Proceedings of the National Academy of Sciences of the United States of America 97 (8):4398–4403. doi: 10.1073/pnas.070039597.
- Manley, E., G. Filomena, and P. Mavros. 2021. A spatial model of cognitive distance in cities. International Journal of Geographical Information Science 35 (11):2316–38. doi: 10.1080/13658816.2021.1887488.
- Maurer, U., S. Brem, M. Liechti, S. Maurizio, L. Michels, and D. Brandeis. 2015. Frontal midline theta reflects individual task performance in a working memory task. Brain Topography 28 (1):127–34. doi: 10.1007/s10548-014-0361-y.
- McKinlay, R. 2016. Technology: Use or lose our navigation skills. Nature 531 (7596):573–75. doi: 10.1038/531573a.
- Meilinger, T., J. Frankenstein, and H. H. Bülthoff. 2013. Learning to navigate: Experience versus maps. Cognition 129 (1):24–30. doi: 10.1016/j.cognition.2013.05.013.
- Montello, D. R. 1998. A new framework for understanding the acquisition of spatial knowledge in large-scale environments. In Spatial and temporal reasoning in geographic information systems, ed. M. Egenhofer and R. G. Golledge, 143–54. New York: Oxford University Press.
- Montello, D. R. 2016. Behavioral methods for spatial cognition research. In Research methods for environmental psychology, ed. R. Gifford, 161–81. Cambridge University Press.
- Münzer, S., H. D. Zimmer, M. Schwalm, J. Baus, and I. Aslan. 2006. Computer-assisted navigation and the acquisition of route and survey knowledge. Journal of Environmental Psychology 26 (4):300–08. doi: 10.1016/j.jenvp.2006.08.001.
- Nazareth, A., X. Huang, D. Voyer, and N. Newcombe. 2019. A meta-analysis of sex differences in human navigation skills. Psychonomic Bulletin & Review 26 (5):1503–28. doi: 10.3758/s13423-019-01633-6.
- Ni, T., D. A. Bowman, and J. Chen. 2006. Increased display size and resolution improve task performance in information-rich virtual environments. In Proceedings of Graphics Interface 2006, ed. C. Gutwin, and S. Mann, 139–46. Canadian Information Processing Society.
- Osipova, D., A. Takashima, R. Oostenveld, G. Fernández, E. Maris, and O. Jensen. 2006. Theta and gamma oscillations predict encoding and retrieval of declarative memory. The Journal of Neuroscience 26 (28):7523–31. doi: 10.1523/JNEUROSCI.1948-06.2006.
- Paas, F., J. E. Tuovinen, H. Tabbers, and P. W. M. Van Gerven. 2003. Cognitive load measurement as a means to advance Cognitive Load Theory. Educational Psychologist 38 (1):63–71. doi: 10.1207/s15326985ep3801_8.
- Palazzi, A., D. Abati, S. Calderara, F. Solera, and R. Cucchiara. 2019. Predicting the driver’s focus of attention: The DR(eye)VE Project. IEEE Transactions on Pattern Analysis and Machine Intelligence 41 (7):1720–33. doi: 10.1109/TPAMI.2018.2845370.
- Parush, A., S. Ahuvia, and I. Erev. 2007. Degradation in spatial knowledge acquisition when using automatic navigation systems. In International conference on spatial information theory, ed. S. Winter, M. Duckham, L. Kulik, and B. Kuipers, 238–54. Berlin, Heidelberg: Springer.
- Pion-Tonachini, L., K. Kreutz-Delgado, and S. Makeig. 2019. ICLabel: An automated electroencephalographic independent component classifier, dataset, and website. NeuroImage 198:181–97. doi: 10.1016/j.neuroimage.2019.05.026.
- Puma, S., N. Matton, P.-V. Paubel, É. Raufaste, and R. El-Yagoubi. 2018. Using theta and alpha band power to assess cognitive workload in multitasking environments. International Journal of Psychophysiology 123:111–20. doi: 10.1016/j.ijpsycho.2017.10.004.
- Richter, K.-F., D. Dara-Abrams, and M. Raubal. 2010. Navigating and learning with location based services: A user-centric design. In Proceedings of the 7th International Symposium on LBS and Telecartography, ed. G. Gartner and Y. Li, 261–76. Guangzhou, China.
- Ritchie, S. J., and E. M. Tucker-Drob. 2018. How much does education improve intelligence? A meta-analysis. Psychological Science 29 (8):1358–69. doi: 10.1177/0956797618774253.
- Ruginski, I. T., S. H. Creem-Regehr, J. K. Stefanucci, and E. Cashdan. 2019. GPS use negatively affects environmental learning through spatial transformation abilities. Journal of Environmental Psychology 64:12–20. doi: 10.1016/j.jenvp.2019.05.001.
- Ruginski, I., N. Giudice, S. Creem-Regehr, and T. Ishikawa. 2022. Designing mobile spatial navigation systems from the user’s perspective: An interdisciplinary review. Spatial Cognition & Computation 22 (1–2):1–29. doi: 10.1080/13875868.2022.2053382.
- Sauseng, P., B. Griesmayr, R. Freunberger, and W. Klimesch. 2010. Control mechanisms in working memory: A possible function of EEG theta oscillations. Neuroscience and Biobehavioral Reviews 34 (7):1015–22. doi: 10.1016/j.neubiorev.2009.12.006.
- Seminati, L., J. Hadnett-Hunter, R. Joiner, and K. Petrini. 2022. Multisensory GPS impact on spatial representation in an immersive virtual reality driving game. Scientific Reports 12 (1):7401. doi: 10.1038/s41598-022-11124-9.
- Sharma, G., K. Gramann, S. Chandra, V. Singh, and A. P. Mittal. 2017. Brain connectivity during encoding and retrieval of spatial information: Individual differences in navigation skills. Brain Informatics 4 (3):207–17. doi: 10.1007/s40708-017-0066-6.
- Siegel, A. W., and S. H. White. 1975. The development of spatial representations of large-scale environments. Advances in Child Development and Behavior 10:9–55. doi: 10.1016/s0065-2407(08)60007-5.
- Steel, A., C. E. Robertson, and J. S. Taube. 2021. Current promises and limitations of combined virtual reality and functional magnetic resonance imaging research in humans: A commentary on Huffman and Ekstrom (2019). Journal of Cognitive Neuroscience 33 (2):159–66. doi: 10.1162/jocn_a_01635.
- Sugimoto, M., T. Kusumi, N. Nagata, and T. Ishikawa. 2022. Online mobile map effect: How smartphone map use impairs spatial memory. Spatial Cognition & Computation 22 (1–2):161–83. doi: 10.1080/13875868.2021.1969401.
- Topete, A., C. He, J. Protzko, J. Schooler, and M. Hegarty. 2024. How is GPS used? Understanding navigation system use and its relation to spatial ability. Cognitive Research: Principles and Implications 9 (1):16. doi: 10.1186/s41235-024-00545-x.
- Van Asselen, M., E. Fritschy, and A. Postma. 2006. The influence of intentional and incidental learning on acquiring spatial knowledge during navigation. Psychological Research 70 (2):151–56. doi: 10.1007/s00426-004-0199-0.
- von Stülpnagel, R., and M. C. Steffens. 2013. Active route learning in virtual environments: Disentangling movement control from intention, instruction specificity, and navigation control. Psychological Research 77 (5):555–74. doi: 10.1007/s00426-012-0451-y.
- Weisberg, S. M., and N. S. Newcombe. 2018. Cognitive maps: Some people make them, some people struggle. Current Directions in Psychological Science 27 (4):220–26. doi: 10.1177/0963721417744521.
- Wen, W., T. Ishikawa, and T. Sato. 2014. Instruction of verbal and spatial strategies for the learning about large-scale spaces. Learning and Individual Differences 35:15–21. doi: 10.1016/j.lindif.2014.06.005.
- Willis, K. S., C. Hölscher, G. Wilbertz, and C. Li. 2009. A comparison of spatial knowledge acquisition with maps and mobile maps. Computers, Environment and Urban Systems 33 (2):100–10. doi: 10.1016/j.compenvurbsys.2009.01.004.
- Wolbers, T., and M. Hegarty. 2010. What determines our navigational abilities? Trends in Cognitive Sciences 14 (3):138–46. doi: 10.1016/j.tics.2010.01.001.
- Woollett, K., and E. A. Maguire. 2010. The effect of navigational expertise on wayfinding in new environments. Journal of Environmental Psychology 30 (4–2):565–73. doi: 10.1016/j.jenvp.2010.03.003.
- Xie, B., and G. Salvendy. 2000. Prediction of mental workload in single and multiple tasks environments. International Journal of Cognitive Ergonomics 4 (3):213–42. doi: 10.1207/S15327566IJCE0403_3.
- Yesiltepe, D., P. F. Velasco, A. Coutrot, A. O. Torun, J. M. Wiener, C. Holscher, M. Hornberger, R. C. Dalton, and H. J. Spiers. 2023. Entropy and a sub-group of geometric measures of paths predict the navigability of an environment. Cognition 236:105443. doi: 10.1016/j.cognition.2023.105443.
- Young, M. S., K. A. Brookhuis, C. D. Wickens, and P. A. Hancock. 2015. State of science: Mental workload in ergonomics. Ergonomics 58 (1):1–17. doi: 10.1080/00140139.2014.956151.
- Zhang, H., K. Zherdeva, and A. D. Ekstrom. 2014. Different “routes” to a cognitive map: Dissociable forms of spatial knowledge derived from route and cartographic map learning. Memory & Cognition 42 (7):1106–17. doi: 10.3758/s13421-014-0418-x.
- Zhao, J., T. Sensibaugh, B. Bodenheimer, T. P. McNamara, A. Nazareth, N. Newcombe, M. Minear, and A. Klippel. 2020. Desktop versus immersive virtual environments: Effects on spatial learning. Spatial Cognition & Computation 20 (4):328–63. doi: 10.1080/13875868.2020.1817925.
Appendix
Figure A.1. Electroencephalography (EEG) results for Route 2. (A) Relative theta power spectral density (PSD) of EEG data from five frontal electrodes (Fz, F3, F4, AF3, and AF4) were significantly different between the low-dependence (LD) group and high-dependence (HD) group in several trials. (B) The relative theta PSD of the Fz electrode is mapped along the navigated route, indicating the spatial context of the recorded cognitive load. The locations of intersections and route segments are also labeled on the map. (C) Statistical analysis of the relative theta PSD for each intersection and route segment. *p < 0.05. **p < 0.01. ***p < 0.001.
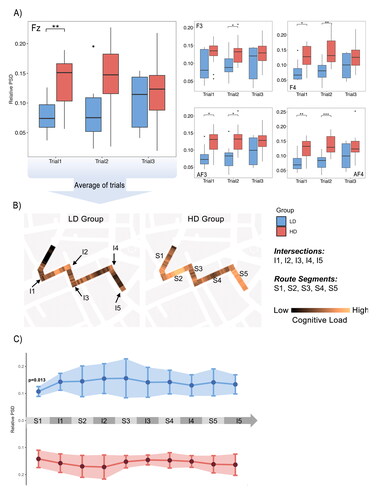
Table A.1. Statistical analysis of the relative theta power spectral density of electroencephalography activity at five frontal electrodes (Fz, F3, F4, AF3, and AF4) for Route 1
Table A.2. Statistical analysis of the relative theta power spectral density of electroencephalography activity at five frontal electrodes (Fz, F3, F4, AF3, and AF4) for Route 2