
Abstract
Non-stress testing (NST) is the primary method of determining fetal condition during the perinatal period, and as such, has high specificity. However, short-term monitoring and visual inspection of the cardiotocogram demonstrates several limitations in understanding fetal status which can be mistaken as predictors of neonatal asphyxia. Fetal electrocardiography (FECG) is a novel, long-term monitoring method which can reflect more objective and accurate fetal information. This article presents experimental results of four fetal heart rate (FHR) acceleration features of 44 fetuses extracted from FECG. The novelty of this approach lies in its combined use of parameters which can express both duration and amplitude of heart rate acceleration. Results demonstrate that most parameters significantly differ between normal fetuses and fetuses with suspected abnormalities. Results are promising for the identification of a set or parameters which may be used as classifiers to improve the success rate when distinguishing between normal and abnormal fetuses.
1. Introduction
Fetal heart activity is typically monitored by cardiotocography (CTG), which estimates the fetal tachogram based on the evaluation of ultrasound pulses reflected from the fetal heart.[Citation1] CTG determines the momentary heart rate with limited accuracy.[Citation2] Conventional CTG is one of the most widely used methods of fetal surveillance worldwide; however, assessment of fetal well-being based on fetal heart rate (FHR) is usually restricted to a visual inspection of the cardiotocogram. The potential of fetal magnetocardiography (FMCG) was initially realized during the 1970s. However, to ensure adequate performance, a biomagnetometer with up to 61 channels was necessary, as well as a shielded room in order to realize data recording.[Citation1] Fetal electrocardiography (FECG) is primarily used for antenatal and intranatal fetal detection. FECG is applied during birth with the use of a scalp electrode which delivers a signal with high temporal resolution. During pregnancy, the practical application of FECG using electrodes on the maternal abdomen has already overcome the disadvantage of its previous poor signal-to-noise characteristics. Today, FECG is widely available for the study and clinical application of FHR. Additionally, computer-aided monitoring systems have been widely applied to improve the objectivity and repeatability of signal interpretation.[Citation3]
FHR acceleration is defined as an occurrence in which FHR suddenly and significantly increases by amplitude which exceeds the FHR baseline by more than 15 bpm, and for duration of no less than 15 s. The constantly changing nature of the FHR baseline is due to the interaction between the sympathetic nerve and the vagus nerve: Excitation of the sympathetic nerve increases heart rate, while excitation of the vagus nerve decreases heart rate. There are several other characteristic patterns based on baseline FHR, in which acceleration and deceleration of heart rate are strictly correlated to the fetal state.[Citation4] Interpretation of FHR variability and acceleration is a basic diagnostic tool in contemporary perinatal medicine.[Citation5]
In this study, three of the analyzed FHR acceleration features demonstrated statistically significant differences. An approach is proposed which analyzes the long-term FHR data obtained by electrocardiography in a population of normal and potentially abnormal fetuses according to the number of grids covered by the acceleration area. This feature, combined with the time duration and amplitude of the acceleration, is a two-dimensional parameter according to which better intrauterine fetal information may be reflected.
2. Methods and materials
2.1. Subjects
Forty-four fetal FECG recordings were obtained during this study from women with uncomplicated, healthy singleton pregnancies. The study method was approved by the Ethics Committee of Peking University Third Hospital. Written informed consent was obtained from all subjects, and no adverse outcomes were reported as a result of this study. Subject information is detailed in .
Table 1. Basic subject information.
2.2. Signal acquisition
The FHR signals were derived from recordings obtained by the Monica AN24 electronic fetal monitor during the third trimester. Subjects were divided into two groups according to non-stress testing (NST), a clinical diagnostic method which observed and recorded fetal heart rate under no contraction, no external load conditions in order to evaluate the fetus’ reserve capacity. According to FHR features, NST could also be divided into three types: reactive, potentially abnormal and no response. The NST information of 18 subjects were reported as positive in the normal group, and the NST information of 26 subjects were reported as negative in the potentially abnormal study group. Basic subject information is listed in , and the mean valid monitoring time exceeded 15 h.
2.3. FHR acceleration analysis
During the antepartum period, FHR baseline values and variations are altered as gestational age (GA) increasing, which reflects the maturation of the fetal central nervous system. Additionally, the acceleration parameter was also obtained from FECG recordings. Heart rate acceleration occurs in response to various stimuli and stresses in healthy fetuses.[Citation6] In the third trimester, the most significant heart rate acceleration occurs simultaneously with fetal movement, indicating the intrauterine fetus is in good condition.
Each recording demonstrated abundant data. For example, 15 h of recorded information contained 216000 FHR values, obtained at a sampling frequency of 4 Hz. In this study, MATLAB software (MathWorks Inc., Natick, MA) was utilized to analyze and process FHR’s signals, and the acceleration parameters were extracted according to the following method:
Acceleration time rate (ATR) is expressed as follows:
(1)
In which N is the number of all accelerations, and T is the valid monitoring time, and Acc(i) represents the length of the ith acceleration.
Unit interval acceleration (UIA) is expressed as follows:
(2)
Where the numerator represents the area of all accelerations and the denominator represents was length of all accelerations during the valid monitoring time.
The number of acceleration area grid (NOAAG) in a unit interval is described as follows:
(3)
In which ΔT is a certain time period (equal to 20 min in this study), ΔS is the area of a grid in printing paper 30 s in length and 10 bpm in height. The NOAAG referenced in this article indicates the average number of grid areas in the acceleration area over the course of 20 min. In addition, the average number of accelerations (NOA) and the average length of acceleration (LOA) in the 20-min intervals have also been taken into consideration.
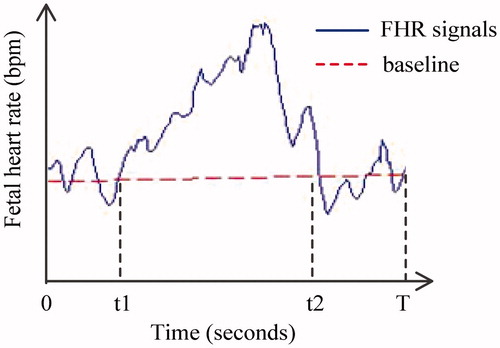
As shown in , the time from 0 to T represents the valid monitoring time, while t1 to t2 represents acceleration. Therefore, the NOA is equal to 1, the LOA is represented by (t2 − t1) and the ATR is determined by (t2 − t1)/T.
Figure 1. The segment from t1 to t2 represents acceleration.
2.4. Statistical analysis
A Gaussian test was performed on test subjects to verify their normal distribution. Independent-sample t-tests were then conducted to compare results from the normal group and the potentially abnormal group, to illustrate significant differences. Finally, a box plot was used to indicate the relationship between the acceleration parameter and GA. All statistical tests were performed using the SPSS 20.0 software package (SPSS Inc., Chicago, IL), and a value of p < .05 was considered to represent statistical significance.
3. Results
The NOA and mean acceleration duration were adopted as usual features. In consideration of clinical applications, the mean number of grids covered by acceleration was also calculated. By comparing the NOA to the mean acceleration duration, it was concluded that the area covered by acceleration was more valuable because it contains both acceleration duration and amplitude.
Independent-sample t-tests were conducted for the four features (ATR, NOA, LOA and NOAAG) to compare results recorded by normal and potentially abnormal fetuses; results are presented in . The normal study group demonstrated higher acceleration features than subjects in the potentially abnormal group, and all features demonstrated statistical difference between the two groups with the exception of NOA. The ATR of the normal fetus group was equal to 40.9% while that of the potentially abnormal fetus group was equal to 37.2%, indicating that normal fetuses demonstrate 3.7% more valid monitoring time than potentially abnormal fetuses. The NOAAG of the normal fetus group was also larger than that of the potentially abnormal fetus group about 6 units, indicating that normal fetuses had more than potentially abnormal ones, 6 grids’ area per 20 min. Results are shown in .
Table 2. Feature result comparison.
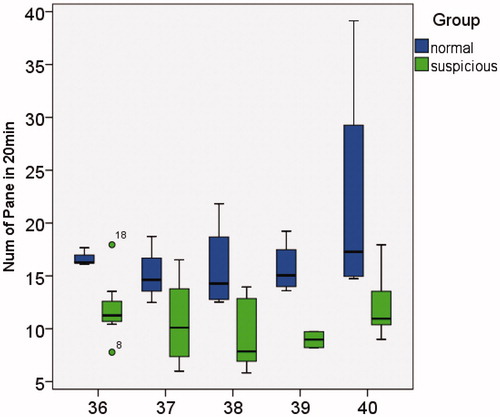
Only the LOA box plot is presented below, as ATR and LOA represent identical information. Comparison of the relationships between NOA, LOA and NOAAG in the normal group and potentially abnormal group is demonstrated in . In , the y-axis represents the NOA which occurred in 20 min, and the x-axis represents the GA from 36 to 40 weeks. The two study groups demonstrated no significant difference in NOA, and no obvious GA change trend. In and , the y-axis represents the LOA time and the number of grids covered by acceleration in 20 min of observation time, respectively. Normal fetuses demonstrated higher LOA and NOAAG values, while no apparent trend was observed with increasing GA.
Figure 2. The number of accelerations in 20 min.
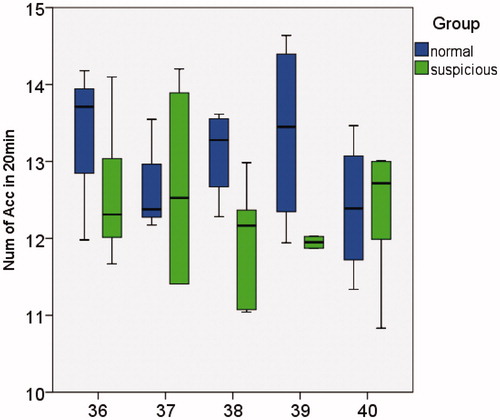
Figure 3. The length of accelerations in 20 min.
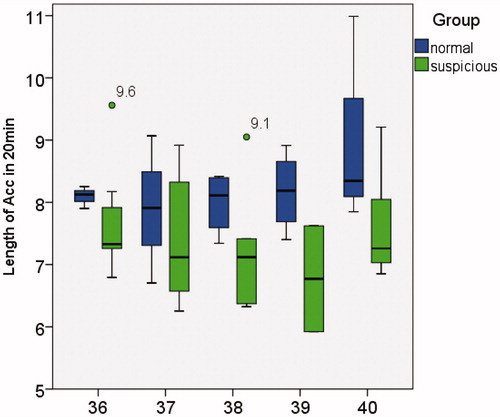
Figure 4. The number of grids covered by acceleration area in 20 min.
4. Discussion
Long-term FECG recordings with duration of more than 15 h were used to ensure the acquisition of more objective and accurate fetal information. Using the features extracted from long-term monitoring may be better for understanding of FHR and addressing disadvantages of CTG.
In this study, all four studied features demonstrated significant differences between the normal and potentially abnormal fetal groups, with the exception of NOA. Evaluation criteria included emphasis on both acceleration frequency and quality. NOAAG was proposed, and it demonstrated the greatest significant difference among features with a p value less than .001. As a two-dimensional parameter, NOAAG takes into account both the duration and amplitude of acceleration.
Additionally, NOAAG accord with clinical observation as the NST always lasts 20 or 40 min and acceleration covered area intuitively reflected in the diagnosing printing paper. Nevertheless, no relationship was observed between NOAAG and GA. Future research will focus on the collection of more data to analyze a potential GA correlation. Additionally, as acceleration becomes closely related to fetal movement during the third trimester, future research would investigate acceleration features associated with fetal movement.
The normal and potentially abnormal groups demonstrated no significant differences in Apgar scores, pH values of the umbilical cord blood, or delivery week. However, the FECG monitoring acceleration features of potentially abnormal subject demonstrated poorer performance than those observed in normal subject. Additionally, fetuses diagnosed as potentially abnormal require repeated prenatal examination, resulting in wasted medical resources. NST is of high specificity, resulting in the incorrect diagnosis of many potentially abnormal fetuses. The identification and correct analysis of differences between the normal group and the potentially abnormal group will help reduce the false positive rate and wasted medical resources.
Traditional CTG recording required an average increase of 40 min of recording time,[Citation7] producing recordings which extend to a maximum of 60 min.[Citation8] The objectivity and accuracy of parameters extracted via short-term monitoring may be weak, but the information extracted in more than 15 h was adequate.
5. Conclusion
In conclusion, acceleration features demonstrated significant differences in the normal and potentially abnormal groups, with the exception of NOA, but no obvious trends were observed between acceleration features and GA. Increasing the number of subjects might help determine an accurate threshold value in order to better distinguish between normal and potentially abnormal fetuses and discover a change trend between acceleration parameters and increasing GA, which is in accordance with fetal brain development.
Disclosure statement
The authors report no conflicts of interest. The authors alone are responsible for the content and writing of this article.
Funding
This research was partially sponsored by the Beijing Natural Science Foundation [grant No. 7132028] and the New Talent Project of Beijing University of Technology [grant No. 015000514115007].
References
- Lange S, Van Leeuwen P, Geue D, et al. Influence of gestational age, heart rate, gender and time of day on fetal heart rate variability. Med Biol Eng Comput. 2005;43:481–486.
- Hirsch M, Karin J, Akselrod S. Heart rate variability: heart rate variability in the fetus. New York: Futura; 1995.
- Jezewski J, Wrobel J, Horoba K, et al. Fetal heart rate variability: clinical experts versus computerized system interpretation. Paper presented at: 24th Annual Conference and the Annual Fall Meeting of the Biomedical Engineering Society EMBS/BMES Conference. 2002 Feb; Houston, TX, USA; p. 1617–1618.
- Jezewski J, Horoba K, Gacek A, et al. Analysis of nonstationarities in fetal heart rate signal: inconsistency measures of baselines using acceleration/deceleration patterns. Paper presented at: IEEE Proceedings of the 7th International Symposium on Signal Processing and its Applications. 2003 Aug; Paris, France; p. 34–38.
- Kupka T, Wrobel J, Jezewski J, et al. Evaluation of fetal heart rate baseline estimation method using testing signals based on a statistical model. Paper presented at: EMBS Annual International Conference; 2006 Aug 30–Sept 3; New York, USA.
- Lee Chang Y, Di Loreto Panfilo C, O’lane John M. A study of fetal heart rate acceleration patterns. Obstet Gynecol. 1975;45:142–146.
- Lucchini M, Signorini MG, Fifer WP, Sahni R. Multi-parametric heart rate analysis in premature babies exposed to sudden infant death syndrome. Paper presented at: 36th Annual International Conference of the IEEE Engineering in Medicine and Biology Society. 2014 Aug 26–30; Chicago, USA.
- Serra V, Bellver J, Moulden M, Redman CWG. Computerized analysis of normal fetal heart rate pattern throughout gestation. Ultrasound Obstet Gynecol. 2009;34:74–79.