
Abstract
Background: Finger blood volume pulse (F-BVP) contains abundant human cardiovascular system information, including information regarding circulation in the heart, blood vessel function, and the microcirculation system. Pulse waveform analysis is a method for analyzing F-BVP.
Methods and results: A new parameter of F-BVP, called waveform index (WI), was extracted, defined, subsequently compared between groups of different cardiovascular function, and compared with age and systolic blood pressure. WI values of the negative and positive groups were 0.209 ± 0.066 (p < .001) and 0.305 ± 0.066 (p < .001), respectively. The classification threshold value of WI was 0.24, revealing a sensitivity of 77%, a specificity of 68% and a classification accuracy of 73%. The odds ratio (OR) was 7.164, indicating that subjects with WI >0.24 had a 7.164 times greater risk of suffering from cardiovascular disease than of not suffering from cardiovascular disease. Age and systolic blood pressure had consistent correlation with WI, in addition, WI had the same trend with age and systolic blood pressure.
Conclusion: Because WI of F-BVP was determined according to only F-BVP waveform and increases in age and systolic blood pressure, different values of WI represent different cardiovascular physiological conditions. To a certain extent, the changes of WI reflect the changes of human cardiovascular function. Therefore, WI has the potential to be widely used in disease screening and clinical practice.
1. Introduction
Blood volume pulse (BVP) contains abundant cardiovascular physiological and pathological information. The characteristics of pulse wave, such as waveform, amplitude, velocity and periodicity, are closely related to cardiovascular disease.[Citation1]
Finger blood volume pulse (F-BVP) can be obtained by using a non-invasive optical technique known as photoelectric plethysmography (PPG) in which light from a near-infrared light emitting diode is shone at the tissue and the amount of transmitted light is measured using a photodiode detector. The resulting output signal is related to the blood volume changes in the micro-vascular bed. Microcirculation system is a part of the circulatory system. The physiological or pathological changes in microcirculation reflect the cardiovascular system changes to some extent. Therefore, F-BVP can evaluate the microcirculation system and the cardiovascular function.
Previous research on analyzing pulse waveform focused on the estimate of cardiovascular physiological characteristics and physical property, such as arterial stiffness,[Citation2,Citation3] cardiac output,[Citation4,Citation5] blood pressure [Citation6] and so on. Other researches focus on putting forward the new pulse wave analysis approach.[Citation7,Citation8] Recently, researchers are paying attention to estimate the cardiovascular disease based on the pulse waveform characteristics,[Citation9–11] however, these researches were analyzed with the radial pulse, aorta pulse and the brachial–ankle pulse. These signals have the same problem of difficulty to detect compared to the F-BVP, and the operator needs be professionally trained. The aims of this study were to extract new parameter named waveform index (WI) based on the F-BVP, thereafter, to compare it between groups of different cardiovascular function and compare it with age and systolic blood pressure. F-BVP waveform was recorded in subjects of different cardiovascular function, and WI was extracted and analyzed with age and systolic blood pressure comparatively. We conclude that WI can be applied to obtain information about changes of cardiovascular function.
2. Method
2.1. Characteristic parameters of F-BVP
K value is a traditional parameter of pulse waveform analysis,[Citation12] and it was been defined as:
(1)
Where Qmax and Qmin are the maximum and the minimum values of F-BVP waveform, respectively. Qm is the mean value of F-BVP waveform, and it was defined as:
The F-BVP waveform was divided into two parts by the maximum point (), and the new characteristic parameters of F-BVP were proposed.
Figure 1. F-BVP divided by the maximum point. The abscissa is time; the ordinate is the amplitude of F-BVP. Q(t) indicates F-BVP waveform; T indicates full cardiac cycle time; Tm indicates the time of the maximum point of F-BVP waveform; Qmax, Qmin, and Qm indicate the maximum, minimum, and the mean values of the F-BVP waveform, respectively; Qm1 and Qm2 are the mean value of the F-BVP waveform before and after the maximum point, respectively; S1 and S2 represent the areas under the two parts of the waveform divided by the maximum point.
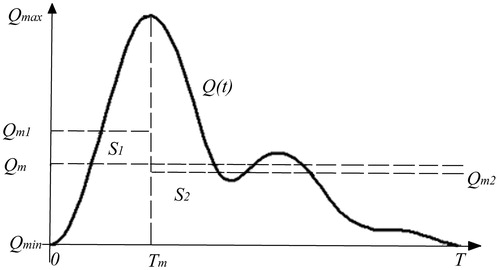
Referring to EquationEquation (1)(1) , the characteristic parameters K1 and K2 of F-BVP were defined as:
(2)
(3)
Where Qm1 was the mean value of F-BVP waveform before maximum point, and was defined as:
Qm2 was the mean value of F-BVP waveform after maximum point, and was defined as:
Since,
i.e.
(4)
EquationEquations (1)(1) , Equation(2)
(2) and Equation(3)
(3) were substituted into EquationEquation (4)
(4) , and then:
i.e.
(5)
The characteristic parameter K of F-BVP represented the area (S) under the waveform (), and the characteristic parameters K1 and K2 of F-BVP represented the areas S1 and S2, respectively.
Characteristic parameters, called waveform indices (WIs), were expressed as division of part areas (S1) to the whole area (S), which was defined as:
(6)
2.2. Experiment description
Investigators at the College of Life Science & Bioengineering (Beijing University of Technology) and at Beijing Anzhen Hospital (Capital University of Medical Sciences) participated in the research of the new characteristic parameter of F-BVP. Research included non-invasive F-BVP hemodynamic detection in the conventional outpatient department.
In this study, 930 subjects underwent the F-BVP waveform test. Subjects included 445 women and 485 men, and the median age was 31 years, which ranged from 10 to 81 years. Among them, 475 patients had hypertension or coronary artery disease and 455 had no definite cardiovascular disease by clinical diagnosis. In order to prevent the cardiovascular state of the subject was different between on the medical record and during the experiment, all the subjects were chosen based on the following conditions: (1) subject has no surgical history and (2) subject has not taken cardiovascular medicine 2 h before the detection.
The hardware used in this research was F-BVP hemodynamic detecting equipment (TP-CBS-III, Bio-Medical and Instrument Lab, Beijing University of Technology, China). The software of the F-BVP hemodynamic detecting system was the offline version of TP-CBS-III, called sGuideN.exe (Bio-Medical and Instrument Lab, Beijing University of Technology, China). The software automatically recorded all of the operation and F-BVP waveform data related to the research. Pulse waveform data sampled by F-BVP hemodynamic detecting equipment started from one full cardiac cycle and was continued for as many cardiac cycles until at least 6 s had passed.
Each subject was placed in supine position. A finger transducer was clamped on the middle finger of the subject’s left hand, and F-BVP hemodynamic detecting equipment was used to acquire the data. The F-BVP signal entered the computer through detection amplification and filter circuits.
Systolic blood pressure was compared with WI values. A cuff was placed on each subject’s left brachial artery, and blood pressure was detected by a sphygmomanometer 2 min before the detection of F-BVP. Age and medical diagnosis were recorded subsequently. When F-BVP hemodynamic detection began, subjects were told to refrain from speaking and physical movement. After that, WI values were computed by the F-BVP hemodynamic detecting equipment and automatically saved into the software database.
2.3. Statistical analysis
Statistical analysis was performed with SPSS version 13.0 (SPSS Inc., Chicago, IL). Covariance analysis for continuous variables is given by mean ± standard error of mean. Data were compared by a paired two-tailed test. A p value of less than .05 was considered statistically significant. The odds ratio (OR) for risk factor was computed with a standard four-fold table method with test-based 95% confidence intervals.
3. Results
The data of all subjects were divided into two groups. One was the negative group, in which all subjects had no definite cardiovascular disease, the other was the positive group, in which subjects had hypertension or coronary heart disease certified by clinical diagnosis. There were 455 and 475 patients in the negative and positive, respectively. illustrates the basic characteristics in both two groups. By the reason that the average age and blood pressure were higher in the positive group than the negative group, covariance analysis was performed to eliminate the influence of these two characteristics on the result. There are no interaction effects found either in the age and the group or the blood pressure and the group, which satisfied the basic rules of the covariance analysis.
Table 1. The basic characteristics of the subjects.
The results reveal that WI was 0.209 ± 0.066 in the negative group (p = .01), and 0.305 ± 0.066 in the positive group (p = .01), which were statistically significant after eliminating the influence of the concomitant variable.
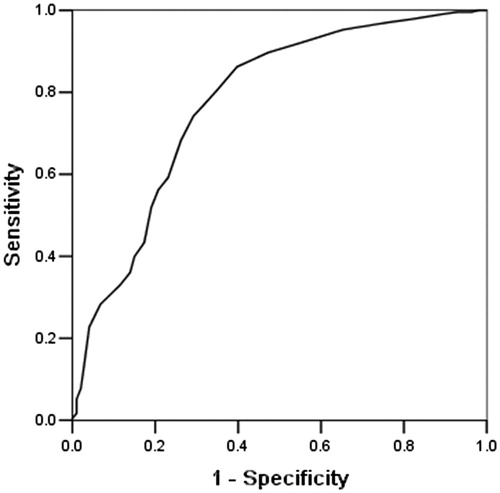
shows the receiver operating characteristic curve (ROC curve) of the WI after covariance analysis. The point of the ROC curve closest to the upper-left corner, which gave a classification threshold value of WI = 0.24, had a sensitivity of 365 (77%) of 475 patients and a specificity of 311 (68%) of 455 patients. The classification accuracy, which was the ratio of the sum of true positive and true negative to total number, was 676 (73%) of 930 patients.
Figure 2. Receiver operating characteristic (ROC) curve of waveform index (WI).
The OR is commonly used to analyze the risk of illness. In this study, OR = 7.164. The parameters were statistically significant, and subjects with WI >0.24 had a 7.164 times greater risk of suffering from cardiovascular disease than the risk of not suffering from cardiovascular disease.
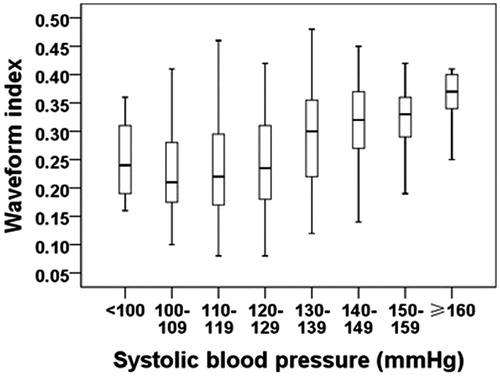
The correlation between WI and age was r = .614 (p < .01), and the correlation between WI and systolic blood pressure was r = .357 (p < .01). Consequently, both of the correlation analyses were of statistical significance. WI increased gradually with increasing age and systolic blood pressure ( and ). Comparative analysis revealed that age and systolic blood pressure were associated with the development of WI.
Figure 3. Box-plot figure of waveform index (WI) with the increase of age.
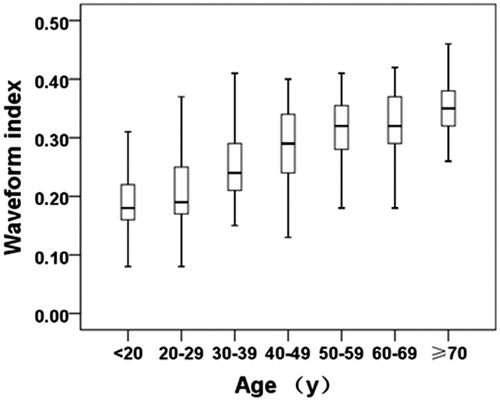
Figure 4. Box-plot figure of waveform index (WI) with the increase of systolic blood pressure.
4. Conclusion and future work
This study divided the F-BVP waveform into two parts by the maximum point, and then defined the WI of F-BVP accordingly. Statistical analysis was then performed to study the difference and the relationship of WI values between groups of different cardiovascular function. WI values of the negative group and positive group were 0.209 ± 0.066 (p = .01) and 0.305 ± 0.066 (p = .01), respectively.
An ROC curve was used to give the classification threshold value of WI between groups of different cardiovascular function. The classification threshold value of WI was 0.24, which has a sensitivity of 77%, a specificity of 68% and a classification accuracy of 73%. An OR was used to analyze the risk of cardiovascular disease. An OR = 7.164 revealed that subjects whose WI >0.24 had 7.164 times greater risk of suffering from cardiovascular disease than the risk of not suffering from cardiovascular disease.
Age and systolic blood pressure were selected for correlation analysis and trend analysis of the WI values of all the subjects. The results showed that both age and systolic blood pressure had a consistent correlation with WI. Moreover, WI exhibited the same trend with age and systolic blood pressure.
With increasing age and systolic blood pressure, cardiovascular function gradually deteriorated, blood vessels gradually hardened, and F-BVP waveforms became much smoother. Therefore, the location of the maximum point moved backward, and the area under F-BVP waveform before the maximum point increased gradually, which caused the growth of the WI values ( and ).
As the WI of F-BVP was only determined by F-BVP waveform and increases in age and blood pressure, different values of WI represent different cardiovascular physiological conditions. To a certain extent, the changes of WI reflect the changes of human cardiovascular function. WI of F-BVP has a wide range of applications in disease screening and clinical practice.
However, this study still needs to improve in some details. First, we have no idea about the physiological significance the WI represents for, and even no research have discussed about dividing the F-BVP by the maximum point. In the future study, we will investigate in this part for more physiological property about WI. Second, it is noted that the arterial stiffness of a subject increase with age and cardiovascular disease.[Citation13] Although the arterial stiffness is only one factor to cause the cardiovascular disease, we still should try to estimate the cardiovascular disease by the parameter associated with arterial stiffness in the future study, and compare the result with WI, which will help us to modify the WI for more accuracy and effect.
Acknowledgments
We would like to thank Dr. Changyan Lin and Dr. Ya Yang from Beijing Anzhen Hospital for their support and help in the study.
Disclosure statement
The authors report no conflicts of interest. The authors alone are responsible for the content and writing of this article.
Funding
Their grant for the study in Beijing Anzhen Hospital is gratefully acknowledged.
References
- Mukkamala R, Reisner AT, Hojman HM, et al. Continuous cardiac output monitoring by peripheral blood pressure waveform analysis. IEEE Trans Biomed Eng. 2006;53:459–467.
- Pilt K, Meigas K, Ferenets R, et al. Photoplethysmographic signal waveform index for detection of increased arterial stiffness. Physiol Meas. 2014;35:2027–2036.
- Pilt K, Ferenets R, Meigas K, et al. New photoplethysmographic signal analysis algorithm for arterial stiffness estimation. Scientific World J. 2013;2013:1063–1068.
- Pitt MS, Marshall P, Diesch JP, et al. Cardiac output by Portapres (R). Clin Sci. 2004;106:407–412.
- Li J, Yang L, Zhang S, et al. Computation of cardiac output by pulse wave contour. Paper presented at: 1st IEEE International Conference on Bioinformatics and Biomedical Engineering. 2007 July 6–8; Wuhan, China.
- Li Y, Wang Z, Zhang L, et al. Characters available in photoplethysmogram for blood pressure estimation: beyond the pulse transit time. Australas Phys Eng Sci. 2014;37:367–376.
- Gbaoui L, Kaniusas E. Arterial pulse wave decomposition by independent component analysis. Paper presented at: IEEE International Workshop on Medical Measurements and Applications. 2009 May 29–30; Cetraro, Italy; p. 111–115.
- Gu G, Yang L, Liu C, et al. Age and blood pressure associated changes in the Gaussian modelling characteristics of the photoplethysmographic pulse. Exp Clin Cardiol. 2014;20:4943–4951.
- Ninomiya T, Kojima I, Doi Y, et al. Brachial-ankle pulse wave velocity predicts the development of cardiovascular disease in a general Japanese population: the Hisayama Study. J Hypertens. 2013;31:477–483.
- Mansour AS, Yannoutsos A, Majahalme N, et al. Aortic stiffness and cardiovascular risk in type 2 diabetes. J Hypertens. 2013;31:1584–1592.
- Avolio AP, Butlin M, Walsh A. Arterial blood pressure measurement and pulse wave analysis – their role in enhancing cardiovascular assessment. Physiol Meas. 2010;31:R1–R47.
- Song J, Zhang S, Qiao Y, et al. Predicting pregnancy-induced hypertension with dynamic hemodynamics. Eur J Obstet Gynaecol Reprod Biol. 2004;117:162–168.
- Lee S, Park S. Arterial ageing. Korean Circ J. 2013;43:73–79.