
Abstract
The thickness of nuchal translucency (NT) is one of the most important parameters to be detected in prenatal screening during the first trimester of pregnancy. In this paper, an automatic method is proposed for the localization of the volume of interest (VOI) of NT in three-dimensional (3D) ultrasound data. With the size and position of the fetal head and the equation of the sagittal plane in the 3D ultrasound data as the prior knowledge, the method can be divided into three steps. First, a Hessian-based plate filter is proposed to enhance the possible plates in the volume. Second, several VOIs with large filter responses are selected as candidates. Those VOIs consisting of several connected planes are segmented according to the prior knowledge of the sagittal plane. Third, a set of shape features is proposed to select the NT VOI with the maximum probability. Automatic fetal head localization and sagittal plane detection can be achieved using our previously proposed methodology, which means fully automatic NT volume detection could be reached by using our method. The proposed method produces 86.36% localization accuracy with the manual selection as the ground truth.
1. Introduction
Nowadays, ultrasonography is widely used in prenatal screening because of its safety, low cost, noninvasive nature and real-time display. 3D ultrasound imaging is introduced into prenatal screening as it can provide more information. During the first trimester of pregnancy, nuchal translucency (NT) is one of the most important parameters to be detected. Researches show that increased NT is related to higher incidences of trisomy 13, 18 and 21, congenital heart disease and other genetic syndromes.[Citation1–3] As it is noninvasive, first trimester ultrasound screening of NT thickness is one of the most effective ways in early screening for trisomy 21, 18 and 13.[Citation4,Citation5] In clinic, the NT thickness is manually measured on the sagittal plane by experienced doctors. On the sagittal plane, the doctors first locate the NT ROI region, and then measure the maximum distance between the upper and lower edge boundaries of the NT region. The NT measurement results are operator-dependent. Inexperienced doctors may under- or overestimate the NT thickness, leading to a wrong patient-specific risk assessment.[Citation6–8]
In recent years, some automatic methods for NT measurement have been proposed, mostly focusing on the detection of the NT boundaries based on the manually chosen region of interest (ROI) in the standard sagittal plane.[Citation9–12] The localization of NT region is the prior step for those methods. Wee et al. [Citation13] trained an artificial neural network to locate the NT region automatically. However, it is a learning-based method and depends on the training data. Deng et al. [Citation14] proposed a hierarchical model to locate the NT region, using the spatial constraints among the NT, the head and the torso of fetuses. These two methods are implemented on the two-dimensional (2D) ultrasound images. A new 3D technology called Volume NT© is introduced in recent years. The Volume NT technique may reduce the operator bias, providing a more reproducible NT measurement compared to the traditional 2D measurement.[Citation15,Citation16] Compared with the NT thickness obtained from 2D ultrasound images, volume of NT from 3D data undoubtedly contains more information about the fetal development.
In this paper, an automatic method for NT VOI localization in the 3D ultrasound data is proposed. The method requires the prior knowledge of the standard sagittal plane, and the size and position of the fetal head, which can be obtained using our previous work.[Citation17,Citation18] The remainder of this paper is organized as follows. Section 2 describes the automatic method in detail. Section 3 gives the experiments and discussions. The conclusions are drawn in Section 4.
2. Methods
The method can be divided into three steps. First, the entire 3D data are reduced using the position and size of the fetal head.
(1)
where I is the original 3D data, Ir is the reduced block, (x0, y0, z0) and r is the position and size of the fetal head, respectively. Because the target NT VOI is roughly a dark plane, a Hessian-based plate filter is applied in the reduced block to enhance the dark plane. Second, candidate VOIs are selected from the filtered block according to the filter responses. Some of them may consist of several connected planes and should be split. As the intersecting part of the NT VOI and the sagittal plane is a line-like structure, several lines can be extracted from the intersecting part, and the VOI can be split according to these lines. Third, shape features are extracted from the candidate VOI, and a joint probability is constructed based on those features. The VOI with the maximum probability is chosen as the result NT VOI.
2.1 Hessian plate filter
The NT is the accumulation of fluid in the nuchal region, and is roughly a dark plane in the 3D ultrasound data. Therefore, a plate filter is designed to enhance the dark plane. Frangi et al. [Citation19] designed a vessel enhancement filter using the eigenvalues of the Hessian matrix and the Hessian-based plate filter is similar to it. The Taylor expansion of image I in the neighborhood of a point x0 is
(2)
The Hessian matrix provides the second order information of an image,
(3)
A second-order ellipsoid can be constructed using the eigenvalue decompositions of Hessian matrix, with the axes along the directions given by the eigenvectors and the corresponding axes’ semi-lengths are the magnitudes of the respective eigenvalues. The second-order ellipsoid can be used for geometric similarity measurements. Let λk denote the eigenvalue with the k-th smallest magnitude (|λ1| ≤ |λ2| ≤ |λ3|). shows the relationship between the eigenvalues of Hessian and different structures.
Table 1. The relationship between structure patterns and the eigenvalues (H = high, L = low, N = noisy, usually small, ± indicates the sign of the eigenvalue).
In this particular case, for the pixels belonging to a dark plate, λ1 and λ2 should be small and λ3 should have a large magnitude with a positive sign,
(4)
(5)
To construct a plate filter, the plate-like pattern should be separated from the blob-like pattern and the tubular-like pattern. The ratio Rb can distinguish a blob-like pattern from the other two patterns,
(6)
This ratio is large for a blob-like structure, but it is zero for the plate-like pattern and tubular-like pattern. On the other hand, the ratio Ra can distinguish between plate-like and tubular-like patterns,
(7)
it is zero only for a plate-like pattern. To distinguish the background and the structure, second-order structure S is defined as
(8)
where D is the dimension of the image and S will be low in the background.
Therefore, a function for plate enhancement is proposed by combining the above components,
(9)
where a, b, c are the thresholds controlling the sensitivity of the filter. At pixels belonging to a dark plate, V(s) will have a high response. Therefore, the dark plane in the data space is detected and enhanced. Taking the spatial constraint of the fetal head and the NT region into account, the pixels inside the fetal head sphere can be cleaned up as the NT will not appear in that region,
(10)
where If is the filtered 3D data and Ifc is the cleaned-up filtered data.
2.2 Candidate VOI extraction and segmentation
Denote Ifc as the cleaned-up filtered 3D data, in which the dark plate structure is enhanced. Several light volumes in the Ifc indicate several dark plate structures in the origin 3D data. Convert Ifc into binary ones and choose N0 connected volumes with the largest responses, the NT volume should be in one of these volumes. As there are many complex structures in the fetuses, there are usually many other plate-like structures near the NT structure. In particular, those disturbing plate-like structures near the NT structure may be connected with it. In these cases, directly computing the shape feature of the VOI will lead to error in the following step. Therefore, the roughly chosen VOI should be split in these cases.
As the NT volume is a plane-like structure which is approximately perpendicular to the sagittal plane, the intersecting part of the NT volume and the sagittal plane is a line-like structure. Using this characteristic, the NT VOI can be separated from the disturbing VOI. The steps of segmentation are as follows:
Compute the intersecting part of the candidate volume and the sagittal plane.
Use Hough transformation to detect line-like structures from the intersecting part.
For each line, construct a plane perpendicular to the sagittal plane that passes through this line. In the remainder of the article, we will call this plane the ‘NT’ plane.
Segment the large VOI into several small VOIs according to the pixels distance to each plane.
Apply the segmentation steps to each VOI. For VOI that only contains the NT VOI, there is only one intersecting line and it will not be segmented. For VOI that only contains disturbing VOI, the VOI may not be a plane structure perpendicular to the sagittal plane. In these cases, the segmentation may be implemented, but it does not affect the target NT volume.
After the volume segmentations, the N0 candidate volumes will be split into N1 candidate volumes
2.3 Feature extraction and VOI selection
From the N1 candidate VOIs, the target NT VOI needs to be selected. Several shape features are proposed for the selection.
To simplify the computation, the origin coordinate system can be rotated to a new coordinate system. Denote the normal vector of the sagittal plane as Vsagittal, the direction vector of the intersection line-like structure as Vline, and compute
(11)
where Vn is the normal vector of the ‘NT’ plane. Use Vsagittal as x-axis, Vline as y-axis and Vn as z-axis for the new coordinate system. In the new coordinate system, the projection of the VOI on the yz-plane is the projection on the sagittal plane and the projection on the xy-plane is the projection on the ‘NT’ plane. The shape features used in this article are shown in .
Table 2. The shape features used for VOI selection.
Ssag is the area of the intersecting part of the VOI and the sagittal plane. The intersecting part of the NT volume and the sagittal plane is a line-like structure with a certain width, so the area should not be too small. The relation between the Ssag and the probability of the VOI as NT VOI can be described as
(12)
The NT VOI is approximately a plane with certain width perpendicular to the sagittal plane, so that the projection on the sagittal plane should also be a line-like structure with a certain width. The ratio of the long axis and short axis of the projection on the sagittal plane ratiosag should be in a certain interval and the length of the long axis lsag should not be too small while the length of the short axis wsag should not be too large. The relation between the ratiosag, lsag and wsag and the probability of the VOI as NT VOI can be described as
(13)
As for the projection on the NT plane, the ratio of the long axis and short axis ratioNT also should be in a certain interval, as the width of the projection could be no larger than the size of the fetal body. The relation between the ratioNT and the probability of the VOI as NT VOI can be described as
(14)
As the NT VOI is a plane-like structure, the distance between the pixels belonging to the NT VOI and the ‘NT’ plane should be small. The mean and variance of the distance between the pixels and the ‘NT’ plane should both be small. The relation between dvoi and σvoi and the probability of the VOI as NT VOI can be described as
(15)
Considering the spatial relationship between the fetal head and the NT, the relative distance dheadcen – the ratio of the distance between the center of the fetal head and the ‘NT’ plane and the size of the fetal head – should be in a certain interval. The relation between dheadcen and the probability of the volume as a NT volume can be described as
(16)
Combining all these features, a joint probability is proposed as
(17)
The VOI with the maximum PNT is chosen as the target NT volume.
3. Experiments and discussions
The experiments are implemented on a dataset composed of 22 clinic 3D ultrasound images of fetuses at 11–14 weeks collected using a Philips iU22 Ultrasound System with a V6-2 probe in Shanghai First Maternity and Infant Hospital, China.
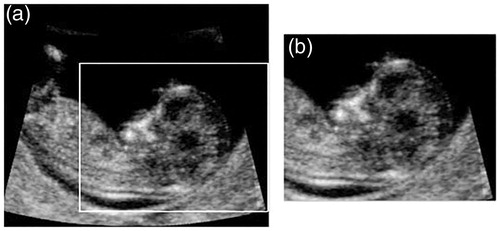
The 3D ultrasound image is first reduced to a block according to the size and position of the fetal head, shown in . shows the xy-plane of the original 3D data, and the frame is drawn according to EquationEquation (1)(1) . Reducing the data space can greatly reduce the computational work.
Figure 1. An example of the data reduced according to the size and position of the fetal head. (a) The xy-plane of the original 3D data. (b) The xy-plane of the reduced 3D data.
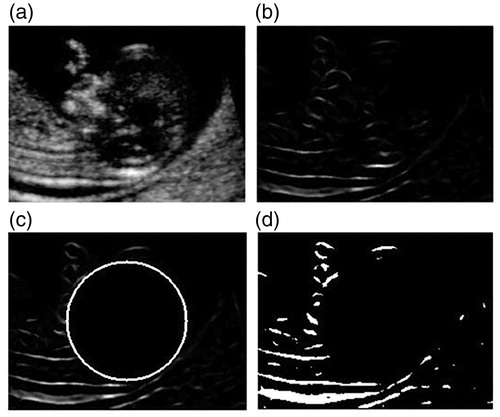
The Hessian-based plate filter is then applied to the reduced 3D data. The structures similar to dark planes are enhanced and the other structures are weakened. The results of the plate filter are shown in . shows the sagittal plane of the original 3D data. The intersecting part of the NT VOI and the sagittal plane is a dark line. shows the sagittal plane of the filtered data. It can be seen that the dark line of the NT is enhanced as a light line on the sagittal plane, which is corresponding to a light plane in the 3D data. shows the sagittal view of the result of the cleaned up filtered data. In the fetal head region, the filtered data is cleaned up, as the NT will definitely not show up in that region. By cleaning up, some of the disturbing light structures in the filtered data are removed. shows the binary filtered data, in which the candidate’s connected VOIs are selected.
Figure 2. The results of the Hessian-based plate filter. (a) The sagittal plane of the original 3D data. (b) The sagittal plane of the filtered data. (c) The filtered data cleaned up according to the spatial constraints of the fetal head and the NT region. (d) The binary cleaned filtered data.
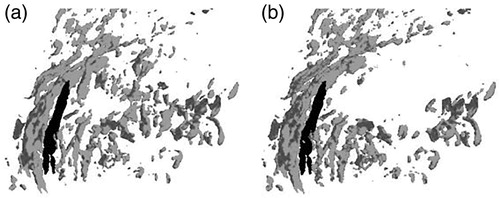
The 3D view of the filtered data is shown in . shows the filtered data and shows the cleaned-up filtered data. In the 3D view, it can be seen more clearly that some of the disturbing VOIs are removed. The darker part in is the NT VOI, and it is a plane-like structure.
Figure 3. The 3D view of the filtered data. (a) The filtered data. (b) The cleaned up filtered data.
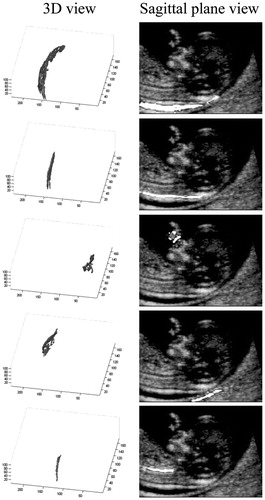
The candidate VOIs are chosen from the binary filtered data while each VOI is a connected region with large filter response. shows some of the examples of the candidate VOI in one clinic data. The first column shows the VOI in 3D view and the second column shows the intersecting part of each VOI and the sagittal plane, while the bright part is the intersecting part.
Figure 4. The 3D view and sagittal plane view of some of the candidate VOI.
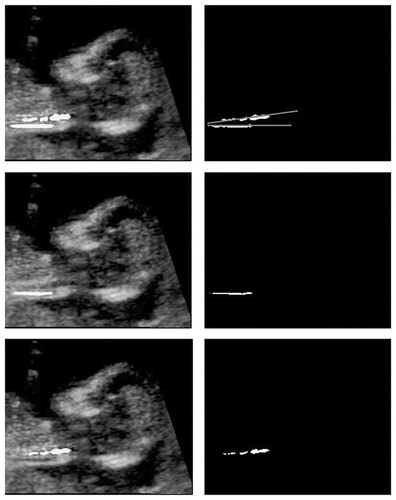
In some cases, the target NT VOI may be connected with some nearby regions. shows an example. The 3D view and sagittal view of a connected VOI is shown in respectively. In these cases, directly extracting the shape features will definitely lead to wrong results, and the candidate VOI needs to be split into several parts. As the intersecting part of NT VOI and the sagittal plane is a line-like structure, Hough transformation is used to detect lines on the sagittal view of the NT VOI. The results of the separation are shown in . The first row is the sagittal view of the NT VOI, the lines are detected by the Hough transformation, and the separation is based on these two lines. The second and third rows are the sagittal view of the separated VOIs. It is shown that the NT VOI can be separated perfectly.
Figure 5. The 3D view and sagittal plane view of a candidate VOI connected by several nearby planes.
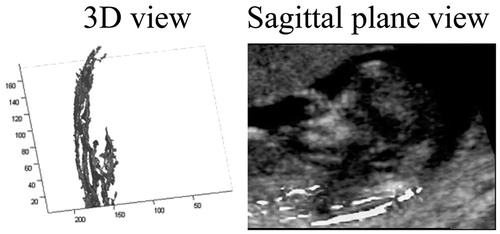
Figure 6. The separated results of a connected VOI.
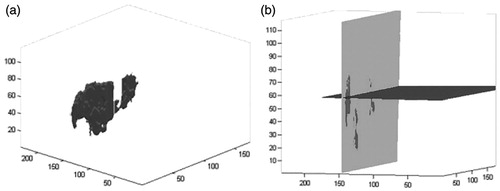
To compute the shape features, the VOI is rotated to a new coordinate system corresponding to the sagittal plane and the ‘NT’ plane. The spatial relation of the NT VOI, the sagittal plane and the ‘NT’ plane is shown in . is an NT VOI, it is a plane-like structure. shows the sagittal plane and the ‘NT’ plane at the same time. The brighter plane is the ‘NT’ plane and the darker plane is the sagittal plane. The ‘NT’ plane and the sagittal plane are orthogonal while the NT VOI is approximately parallel to the ‘NT’ plane.
Figure 7. The spatial relation of the NT VOI, the sagittal plane and the ‘NT’ plane. (a) NT VOI. (b) NT VOI, the sagittal plane (darker) and the ‘NT’ plane (brighter).
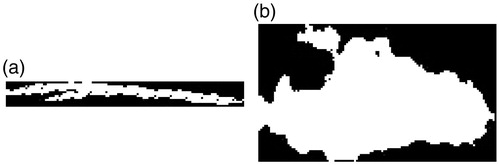
shows the projection of the NT VOI on the sagittal plane and NT plane. shows the projection of the VOI on the sagittal plane, which is a line-like structure. shows the projection of the VOI on the ‘NT’ plane, the length and width are limited.
Figure 8. The projection of the NT VOI on the sagittal plane and NT plane. (a) The projection on the sagittal plane. (b) The projection on the sagittal plane.
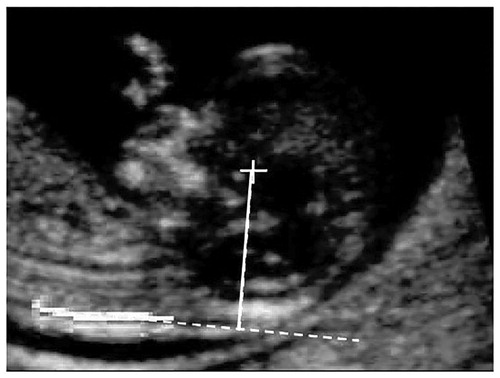
The distance between the center of the fetal head and the ‘NT’ plane is shown in . The bright part is the intersecting part of the NT VOI and the sagittal plane, the dashed line is the line detected by the Hough transformation, the cross is the center of the fetal head and the length of the solid line is the distance dheadcen.
Figure 9. The distance between the center of the fetal head and the ‘NT’ plane.
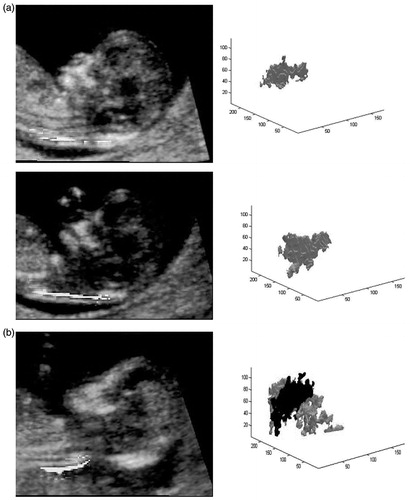
Some of the final results are shown in . The first column shows the result VOI on the sagittal plane while the second column shows the corresponding 3D view. shows some of the correctly detected cases. In the total 22 clinic 3D ultrasound data, the target NT VOI of 19 of them is correctly detected, with an accuracy of 86.36%. shows an example of the incorrectly detected cases. The darker part is the real NT VOI and the brighter part is the result VOI. In the incorrectly detected cases, the result VOIs are dark planes similar to the NT VOI. So, the shape features are also similar to those of the NT VOI, causing confusion over the computation of the probability. More features need to be extracted in the future work for the VOI selection.
Figure 10. The sagittal view of the final results of the NT VOI detection. (a) Examples of the correctly detected cases. (b) An example of the incorrectly detected cases. The darker part is the real NT VOI and the brighter part is the result VOI. (a) Examples of the correctly detected cases. (b) An example of the incorrectly detected cases.
4. Conclusions
In this article, a method for automatically locating the NT VOI is proposed. The method combines a Hessian-based plate filter and shape features to locate the NT VOI. First, a Hessian-based plate filter is used to enhance the dark planes. Then, the candidate VOIs are selected based on the filter response and separated according to the intersecting lines on the sagittal plane. Finally, a joint probability is constructed according to the shape features. The VOI with the largest probability is chosen as the final NT VOI. The method shows good performance with an accuracy of 86.36% in a dataset consisting of 22 clinic 3D ultrasound data. In the future work, the method needs to be applied to a larger dataset. The resulted NT VOI may also provide the prior knowledge for the NT volume detection.
Disclosure statement
The authors report no conflicts of interest. The authors alone are responsible for the content and writing of this article.
Funding
This work is supported by the National Basic Research Program of China (2015CB755500), National Natural Science Foundation of China (61471125 and 61571131).
References
- Hyett JA. Nuchal translucency—state-of-the-art. Ultrasound Med Biol. 2003;29:S4.
- Nicolaides KH. Nuchal translucency and other first-trimester sonographic markers of chromosomal abnormalities. Am J Obstet Gynecol. 2004;191:45–67.
- Ma JY. The prenatal diagnosis of microdeletion/microduplication syndromes in increased nuchal translucency with normal karyotype: unselected Korean populations. Ultrasound Med Biol. 2015;41:S136.
- Nicholas JW, Howard SC, James WD, et al. Maternal serum screening for down syndrome in early pregnancy. Br Med J. 1988;297:883–887.
- Abuhamad A. Technical aspects of nuchal translucency measurement. Semin Perinatol. 2006;29:376–379.
- Pandya PP, Brizot ML, Kuhn P, et al. First-trimester fetal nuchal translucency thickness and risk for trisomies. Obstet Gynecol. 1994;84:420–423.
- Pajkrt E, Mol BW, Boer K, et al. Intra- and interoperator repeatability of the nuchal translucency measurement. Ultrasound Obstet Gynecol. 2000;15:297–301.
- Braithwaite JM, Kadir RA, Pepera TA, et al. Nuchal translucency measurement: training of potential examiners. Ultrasound Obstet Gynecol. 1996;8:192–195.
- Bernardino F, Cardoso R, Montenegro N, et al. Semiautomated ultrasonographic measurement of fetal nuchal translucency using a computer software tool. Ultrasound Med Biol. 1998;24:51–54.
- Catanzariti E, Fusco G, Isgrò F, et al. A semi-automated method for the measurement of the fetal nuchal translucency in ultrasound images. Paper presented at: International Conference on Image Analysis and Processing; 2009 Sep 8–11; Vietri sul Mare, Italy.
- Lee YB, Kim MJ, Kim MH. Robust border enhancement and detection for measurement of fetal nuchal translucency in ultrasound images. Med Biol Eng Comput. 2007;45:1143–1152.
- Nirmala S, Palanisamy V, Measurement of nuchal translucency thickness in first trimester ultrasound fetal images for detection of chromosomal abnormalities. Paper presented at: Control, Automation, Communication and Energy Conservation, 2009, Jun 4–6; Washington DC, USA.
- Wee LK, Min TY, Arooj A, et al. Nuchal translucency marker detection based on artificial neural network and measurement via 14 bidirectional iteration forward propagation. WSEAS Trans Inf Sci Appl. 2010;7:1025–1036.
- Deng Y, Wang Y, Chen P, et al. A hierarchical model for automatic nuchal translucency detection from ultrasound images. Comput Biol Med. 2012;42:706–713.
- Cho H, Kwon J, Kim Y, et al. Comparison of nuchal translucency measurements obtained using Volume NT TM, two- and three-dimensional ultrasound. Ultrasound Obstet Gynecol. 2012;39:175–180.
- Van Keirsbilck J, Dewulf V, Van Calsteren K, et al. Comparison and reproducibility of nuchal translucency measurements using two-dimensional and volume nuchal translucency ultrasound: a prospective Study. Fetal Diagn Ther. 2013;34:103–109.
- Nie S, Yu J, Chen P, et al. A novel method with a deep network and directional edges for automatic detection of a fetal head. Paper presented at: Signal Processing Conference (EUSIPCO), 2015 23rd European; 2015, Aug 31–Sep 4; Nice, France.
- Chen P, Nie S, Deng Y, et al. A hierarchical model for automated standard sagittal-view detection from 3D ultrasound data in 11–14 weeks. Biomed Signal Proces. 2015;19:96–101.
- Frangi AF, Niessen WJ, Vincken KL, et al. Multiscale vessel enhancement filtering. Paper presented at: International Conference on Medical Image Computing and Computer-Assisted Intervention; 1998, Oct 11–13; Cambridge, MA, USA.