
Abstract
Purpose: The anterior pelvic plane (APP) is commonly used as a reference plane to assess acetabular orientation. However, conventional methods for determining the APP may not be accurate and are prone to user variability. To overcome these issues, we developed a robust method to accurately extract the APP independent of pelvic pose using three-dimensional pelvic computed tomography (CT).
Materials and methods: Twenty-eight studies for suspected nonmusculoskeletal conditions were obtained. The APP was determined by four landmarks that were automatically extracted from user-defined regions of interest (ROIs) with compensation of pelvic pose. The APP defined from these landmarks was quantitatively compared to the APPs determined by an expert and an unskilled. Intraobserver reliability was measured to evaluate the time-interval variability. Finally, we evaluate the robustness of this method to patient posture using an arbitrarily rotated volume. The intraclass correlation coefficients (ICCs) were calculated to determine the interobserver and intraobserver reliabilities.
Results: The ICC values for the four landmarks and the APP were similar between the semiautomated method and expert determination (ICC >0.937). The ICC values for intraobserver reliability over time for our method were all 1, demonstrating high reliability. Furthermore, agreement between the parameters determined from the original volume and the rotated volume was nearly perfect.
Conclusions: Our method is a useful measurement tool for the APP as it is robust, and the results were similar to an experienced surgeon’s determination. Furthermore, it was independent to the direction of the CT slice and more robust than a measurement by an unskilled.
Introduction
Analysis of the orientation and morphology of the hip is important in both the medical and the research communities. In particular, determining acetabular orientation is a key aspect of pelvic studies in orthopedic surgery. Conventionally, acetabular orientation has been evaluated by measuring the included angle between two lines on a pelvic X-ray image; one is the line connecting the left and right pelvic tear drops, and the other is the line connecting the rim points of the acetabulum. Unfortunately, angles on 2D X-ray images might not be reliable because projected lines can change along the pose of the pelvis relative to the X-ray generator in the same patient. This can cause inaccurate results when time-term studies are performed [Citation1–5].
As alternatives to the 2D method, various 3D methods have been developed based on measurement of the included angle between a reference plane and the acetabular rim plane in three-dimensional computed tomography (CT) slices. In general, three reference planes have been utilized to measure acetabular orientation: the plane recommended by the Standardization and Terminology Committee of the International Society of Biomechanics (STC plane) [Citation6]; the plane established using the sacral base (SB) [Citation7]; and the anterior pelvic plane (APP) [Citation8]. The STC plane is part of the joint coordinate system and is the reference for reporting hip joint motion. The SB plane is interpolated from the mesh points on the surface of the sacral base. Although accurate segmentation of the SB is crucial, it remains challenging because of the difficulty in classifying voxels with ambiguity around the edges [Citation9]. The APP was described by Lewinnek [Citation8] as a commonly used reference plane for the assessment of acetabular cup orientation after total hip arthroplasty (THA). The APP is defined as the tangential plane of the pelvis determined by four pelvic landmarks: the right and left anterior superior iliac spines (R- and L-ASIS) and the right and left pubic tubercles.
Methods to automatically or manually determine the APP have been developed. Fieten et al. [Citation10] proposed an iterative method based on the approximate symmetry of the pelvic bone. However, the human pelvis is not perfectly symmetric, so these authors performed their computations based on approximated symmetry. In addition, they did not compare their results to those obtained by a highly experienced surgeon. Lobovsky et al. [Citation11] manually selected landmarks to derive the APP. This method is commonly applied but is tedious and time-consuming. Furthermore, manual selection methods can be inaccurate if not performed by a well-trained user. The variability of landmark selection can affect APP determination, resulting in incorrect hip joint kinematics, operative evaluation, and/or misalignment of acetabular cup insertion during THA.
We developed a method in which landmarks are automatically extracted by iterative compensation of the pelvic pose after manually defining regions of interest (ROIs) in 3D models extracted from CT volume. To verify the robustness of our method, the resulting landmarks and APP were quantitatively compared to those determined by an expert and an unskilled. Finally, intraobserver reliability was evaluated for different pelvic poses in the same CT volume [Citation12,13].
The main objectives of this paper are to (1) present a robust method for extracting the APP from a three-dimensional pelvic CT volume that is independent of pelvic pose and (2) to statistically quantify the reliability and accuracy of this method.
Materials and methods
Materials
The institutional review board of our institution approved this study. Twenty-eight pelvic CT studies for individuals imaged for suspected nonmusculoskeletal conditions were obtained from our institution’s database. CT images were acquired using a 16-row multiple detector CT (MDCT) scanner (Somatom Sensation 16, Siemens Medical Solutions, Erlangen, Germany) or a 64-row MDCT scanner (Brilliance 64-channel, Philips, Netherland) using a standard protocol with settings of 120 kVp, 170 mAs and collimation of 16 × 0.75 mm. Transaxial CT images were transferred to a workstation.
The 28 CT pelvic scans (14 men and 14 women) had a mean age of 51 years (ranging from 14 to 75 years), no apparent hip pathology and no previous hip joint surgery. Image files standardized to the Digital Imaging and Communications in Medicine (DICOM) system for each patient were used for further analysis.
APP extraction using a semiautomated method
Four anatomical points were used as landmarks for determining the APP: the right and left anterior superior iliac spines (R- and L-ASIS), and the right and left pubic tubercles. We developed software using Microsoft Visual Studio 2012 to manage the DICOM files and implement our algorithm. The Visualization Tool Kit (VTK) library [Citation14] was used for data visualization. Several processing techniques were implemented across two phases to generate the APP.
In the first phase, for each CT volume, the pelvic bone was obtained using denoising and segmentation techniques. To reduce noise without loss of detail from the CT volume, Gaussian filtering was applied [Citation15]. The pelvic bone was then segmented by the technique called ‘Otsu’s thresholding’, which is a probabilistic method for optimal segmentation that uses the variance of the voxel intensities [Citation16].
To robustly compute landmarks and extract the APP in the second phase, we had to define the positions of the four landmarks. In the actual computation, however, since the true APP is not known, we used an iterative method (). This method consists of six steps: (Step 1) define the regions of interest (ROIs); four ROIs for each landmark are defined by the user. (Step 2) define the pseudolandmarks: the most anterior points are specified as pseudo landmarks, not true landmarks. (Step 3) estimate the APP: a plane fitting the pseudolandmarks is generated by the least-squares method. This is the estimated APP, not the true APP. (Step 4) rotate the pelvis so that the estimated APP is aligned parallel to the anterior plane. The ROIs are also moved in this step. (Step 5) repeat steps 2–4; once the pelvis is rotated, the most anterior points in the ROIs can be changed. Pseudolandmarks are automatically defined, and the pelvis is rotated iteratively through steps 2–4. The iteration is stopped when the angle difference between the estimated APP of the current iteration and that of the previous iteration is less than one degree (<1°). Step 6 defines the true landmarks and the APP; the pseudolandmarks from the last iteration are defined as the true landmarks, and the APP fitting them is defined as the true APP.
Figure 1. Iterative method for determining the APP consisting of the following six steps: (Step 1) Manually specify four ROIs (4 red boxes) for each landmark. (Step 2) Define the pseudolandmarks: the most ventral points (red point) in each ROI (red box) are defined as the pseudo landmarks, not true landmarks. (Step 3) Estimate the APP (blue plane) using the least squares method. (Step 4) Rotate the pelvis so that the estimated APP is aligned parallel to the anterior plane (green plane). (Step 5) Repeat steps 2 to 4 until the angle difference between the estimated APPs of the current and previous iteration is less than one degree. (Step 6) Define the true landmarks and the APP: the pseudo landmarks from the last iteration are defined as the true landmarks, and the APP fitting them (green plane) is defined as the true APP.
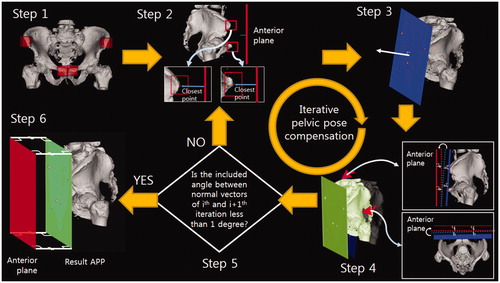
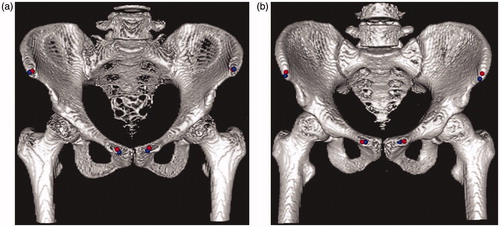
Figure 2. Examples of selected landmarks. The blue points were selected manually by an orthopedist; the red points were calculated using our method.
Statistical methods to assess reliability
To quantify the accuracy and robustness of our method, we analyzed the agreement between the findings of a clinical expert and our method, the results obtained by our method at different times, and the robustness of the estimated APP to difference pelvic poses in the same CT volume.
To quantify agreement between our results and those of a clinical expert, we used the intraclass correlation coefficient (ICC). An ICC value close to 1 indicates excellent agreement when comparing two methods. In contrast, an ICC value close to 0 indicates poor agreement between two methods [Citation17]. We used SPSS software (version 21.0, IBM Inc., Chicago, IL) to calculate the ICC, and the equation can be found in [Citation18]. To calculate the ICC for the landmark, 3D coordinates (x, y and z) from the CT volume for two sets of landmarks determined by our method and experts were extracted. ICCs between two normal vector sets from the two APP sets were calculated to verify the degree of agreement for APP orientation. Moreover, we also calculated errors to measure the differences between our method and the expert determinations. The means and standard deviations of the absolute differences between the extracted landmark point sets and the absolute angle differences between the normal vectors were calculated. For reference, the expert and unskilled began with the initial DICOM images and performed preprocessing to obtain the 3D pelvic model, and each landmark was selected manually on the 3D pelvic model. The ICCs and errors between our method and the unskilled were calculated as well.
To measure and compare the robustness of our results between the trials held at different times at least 4 weeks apart, APPs from 28 CT pelvic scans were extracted on two occasions using our method. Each trial was performed independently. Two data sets (3D coordinates of the landmarks and the normal vector of the APP) were compared between the trials by calculating the ICCs. As a reference, the two data sets obtained from the unskilled were obtained for the two different points and analyzed as described earlier.
Finally, to evaluate the robustness of our method to patient posture, two APP sets were extracted. One was from the original CT volume, and the other was from a CT volume arbitrarily rotated on an arbitrary axis by an angle between 15° and 30°. The ICC values for the two normal vector sets from each volume were calculated to determine the extent of agreement.
Results
The agreement between our method and the expert’s determination was nearly perfect for the two sets of landmarks that were compared (i.e. ICC = 1) (). The ICC values for the unskilled were relatively lower; the differences between the x and z components were especially large. These results indicate that the surgeon’s determinations were more similar to our method than those of the unskilled. The results for the x and y components of the right pubic tubercle for the unskilled trial showed similar errors, even though the ICCs were different. The angle errors of the normal vector also showed that the expert’s results and those obtained using our method were similar.
Table 1. Agreement in coordinates obtained using our method and those determined by experts and unskilled.
Example landmarks for the APP are shown in . The blue points were selected manually by an expert orthopedist, and the red points were calculated based on our algorithm. As is clear from this image, the semiautomated method produced results similar to those of the expert.
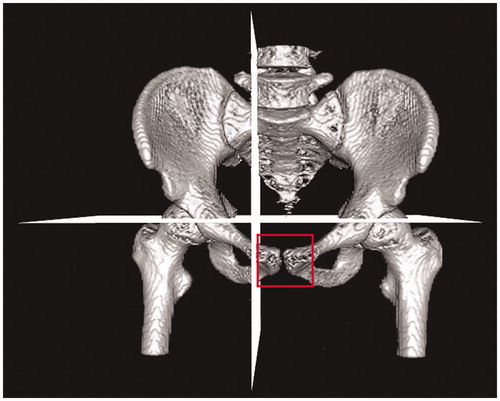
Figure 3. ROI for the CT volume specified by quadrant (the APP might be based on fewer than four landmarks in some cases).
The ICC values for each method from two trials conducted at least 4 weeks apart are presented in . Our landmarks and APP estimates did not differ with the time of trial (the values are all 1s). However, the results of the unskilled were dependent on the time of the trial (0.795–1). This result indicates that our semiautomated method yielded more robust APPs than when an unskilled operator specified the ROIs.
Table 2. Intraobserver ICC valuesTable Footnotea for the determination of landmarks and the APP on two separate occasions (n= 28).
Agreement between the two landmark sets was very high when our method was used for different volumes from the same patient (0.964–1) (). The agreement in parameter estimates between the original volume and the arbitrarily rotated volume was almost perfect.
Table 3. ICC values for measuring agreement between original volume and rotated volume (n = 28).
Discussion
We developed a robust method to determine the APP as a reference plane for evaluating acetabular parameters. The method was applied using ROI to extract four landmarks. Using this methodology, the APP was determined from 28 CT pelvic scans without apparent hip pathology. Our method was independent of pelvic pose and yielded similar results to those obtained by an experienced surgeon. This method for determining the APP could be used as a stable reference for evaluating the orientation of the acetabulum.
Generally, the APP is determined using two ASISs and two pubic tubercles as anatomical reference points. In 1922, Robinson et al. first described the APP as the pelvic frontal plane [Citation19]. In 1978, Lewinnek et al. used a special positional reference for conventional radiographs that defined the APP to measure the inclination and anteversion of the cup [Citation8]. In 1998, Jaramaz et al. used the anterior pelvic plane to determine computer-assisted cup placement in THA [Citation20].
Understanding the orientation of the acetabulum is of key importance in many orthopedic procedures including periacetabular osteotomies and the planning, execution and evaluation of total hip arthroplasties. Abduction and anteversion angles have long been recognized as the two main parameters that define the geometry of the acetabulum. However, abduction and anteversion angles cannot be reliably evaluated on plain X-ray film because pelvic tilt can change the measured angles of the native acetabulum and the prosthetic acetabular cup by as much as 10° [Citation21,22]. To overcome these problems, many studies have used 3D anatomical structures for CT volume [Citation4,Citation7,Citation9].
Although the landmarks defining the APP are obvious, the APP may not be accurate because of incorrectly designated landmarks in 3D CT slices. There are two reasons for this: human (operator) error and the thickness of the CT slices. With regard to the former, the ASISs and pubic tubercles are ambiguous anatomical structures that are difficult to represent precisely. This can make it difficult for operators to recognize the landmarks on CT slices. With regard to the latter, landmarks may not be found if the landmarks are hidden between slices. Certainly, the greater the slice thickness, the larger the potential error. In this case, estimation methods, such as linear approximation, are necessary to obtain more accurate landmarks. For reference, we reduced the error from the thickness by using the CT volume, which has a thin slice thickness (0.5 mm).
Few studies have investigated methods for determining the pelvic reference plane. Kobashi et al. [Citation13] proposed a method to determine the APP based on anatomical points. In this method, an algorithm using ROIs specified by quadrant in the CT volume calculates each anatomical point. Even though this method applies a calibration algorithm for CT poses using silhouette images, finding two landmarks in narrow structures, such as the pubic tubercle, is difficult. In some cases, one of two pubic tubercle points might not be extracted appropriately (). A second method that involves selecting anatomical landmarks for APP manually has inconsistencies because the ASIS and pubic tubercle are ambiguous anatomical structures that are difficult to represent with specific points. Furthermore, manual selection of landmark points on CT images is tedious, time-consuming and error-prone [Citation11]. A third method utilizes the SB plane. A crucial step when using this method is segmentation of the SB; however, finding certain boundaries of the SB in CT slices is difficult [Citation9]. A specific segmentation method was not proposed in the method [Citation7]; therefore, we could not evaluate its efficacy.
In order to avoid ambiguity, our semiautomated method defines the APP using specified landmarks detected by a computer program. The extracted ASIS and pubic tubercle are the maximum ventral points in user-defined ROIs without reference to patient posture.
ICC values for landmarks found by our method and those found by experts were higher than 0.937, which was larger than the ICC values for landmarks designated by an unskilled and an expert (). Errors between landmarks designated using our method or by the expert were smaller than the errors when comparing landmarks between the unskilled and the expert (). The ICC and error values indicate that the landmarks and the APP determined by our semiautomatic software were closer to the expert’s determination than the unskilled.
We note that the ICC value may be different, even if errors are similar. For example, the results for the x and y components of the right ASIS for the unskilled trial in showed similar errors, even though the ICCs were different. The low ICC and high error of the x component of the right ASIS suggested bias. Furthermore, the high ICC and high error of the y component of the left ASIS suggested that the unskilled tried to select points accurately without bias. In fact, ICC was computed by quantification of the agreement between two variables. In our experiments, we selected landmarks in frontal view of the 3D space. The anatomical structures of each landmark area were flat in the direction of sight. Therefore, the ICC values for the y components were relatively higher than those of the other components (). The intraobserver reliability between the points chosen by the unskilled and by the semiautomated method suggests that our method was robust for the same volumes (). In contrast, the results of the unskilled changed over time.
Our method was also robust to changes in pelvis position (ICC >0.964). A change in voxel intensities derived from interpolation in the rotation process can affect the pelvic bone model so that the ICC values were not 1 (). A strength of our method was less dependence on the direction of the CT slice than the expert’s designations. Acetabular orientation can therefore be accurately measured without reference to patient posture.
Our study has several limitations. First, a method using user-selected ROIs can be tedious. To overcome this limitation, an automated method for specifying each region is essential. This is still challenging, however, because landmark areas do not indicate how to divide the CT volume by image processing. Second, we focused only on healthy cases. To use our method for subjects with implants, additional processes, such as noise reduction of metal artifacts, need to be implemented. Failure to remove metal artifacts around the implant could result in false detection of landmarks. Third, this method was developed using high-resolution CT images, which expose patients to a large amount of radiation. We hope to adapt this method to pelvic MRI in the future. However, the CT images had already been acquired, so our study did not impose an additional burden on patients. Fourth, we evaluated our method in a relatively small population of subjects (n = 28).
Operative determination of the APP orientation is difficult because the percutaneous palpation of bony landmarks is not precise. Some studies have shown that the APP is not appropriate for positioning the acetabular components [Citation23]. To our knowledge, there is no reliable reference that can be easily identified during an operation.
In conclusion, we developed a robust method for measuring the APP using ROI boxes. The similarity in the landmarks detected using our method and those designated by an experienced surgeon indicate that our method is a useful tool for determining the APP. Furthermore, the method was not affected by the direction of the CT slice, and the landmarks were the most ventral points. This suggests that robust and accurate results can be acquired, even if unskilled uses our method.
Acknowledgements
This work was supported by a National Research Foundation of Korea (NRF) grant funded by the Korea government (MSIP) (No. 2011-0030075).
Disclosure statement
The authors report no conflicts of interest. The authors alone are responsible for the content and writing of this article.
Additional information
Funding
References
- Chung CY, Park MS, Choi IH, et al. Morphometric analysis of acetabular dysplasia in cerebral palsy. J Bone Joint Surg Br. 2006;88:243–247.
- Pinoit Y, May O, Girard J, et al. [Low accuracy of the anterior pelvic plane to guide the position of the cup with imageless computer assistance: variation of position in 106 patients]. Rev Chir Orthop Reparatrice Appar Mot. 2007;93:455–460.
- Lembeck B, Mueller O, Reize P, et al. Pelvic tilt makes acetabular cup navigation inaccurate. Acta Orthop. 2005;76:517–523.
- Babisch JW, Layher F, Amiot LP. The rationale for tilt-adjusted acetabular cup navigation. J Bone Joint Surg Am. 2008;90:357–365.
- Gose S, Sakai T, Shibata T, et al. Verification of the Robin and Graham classification system of hip disease in cerebral palsy using three-dimensional computed tomography. Dev Med Child Neurol. 2011;53:1107–1112.
- Wu G, Van der Helm FC, Veeger HD, et al. ISB recommendation on definitions of joint coordinate systems of various joints for the reporting of human joint motion—Part II: shoulder, elbow, wrist and hand. J Biomech. 2005;38:981–992.
- Jozwiak M, Rychlik M, Musielak B, et al. An accurate method of radiological assessment of acetabular volume and orientation in computed tomography spatial reconstruction. BMC Musculoskelet Disord. 2015;16:42.
- Lewinnek GE, Lewis JL, Tarr R, et al. Dislocations after total hip-replacement arthroplasties. J Bone Joint Surg Am. 1978;60:217–220.
- Haas B, Coradi T, Scholz M, et al. Automatic segmentation of thoracic and pelvic CT images for radiotherapy planning using implicit anatomic knowledge and organ-specific segmentation strategies. Phys Med Biol. 2008;53:1751.
- Fieten L, Eschweiler J, Heger S, et al. Surface-based determination of the pelvic coordinate system. Proc SPIE. 2009;7261:726138.
- Lubovsky O, Peleg E, Joskowicz L, et al. Acetabular orientation variability and symmetry based on CT scans of adults. Int J Comput Assist Radiol Surg. 2010;5:449–454.
- MacDonald S, Hersche O, Ganz R. Periacetabular osteotomy in the treatment of neurogenic acetabular dysplasia. J Bone Joint Surg Br. 1999;81:975–978.
- Kobashi S, Fujimoto S, Nishiyama T, et al. Robust pelvic coordinate system determination for pose changes in multidetector-row computed tomography images. Int J Fuzzy Log Intell Syst. 2010;10:65–72.
- Schroeder W, Martin K, Lorensen B, An object-oriented approach to 3D graphics. Upper Saddle River (NJ): Prentice Hall; 1997.
- Buades A, Coll B, Morel JM. A non-local algorithm for image denoising. IEEE Computer Society Conference on Computer Vision and Pattern Recognition. 2005;2:60–65.
- Otsu N. A threshold selection method from gray-level histograms. Automatica. 1975;11:23–27.
- Fleiss JL, Cohen J. The equivalence of weighted kappa and the intraclass correlation coefficient as measures of reliability. Educ Psychol Meas. 1973;33:613–619.
- Shrout PE, Fleiss JL. Intraclass correlations: uses in assessing rater reliability. Psychol Bull. 1979;86:420.
- Cunningham DJ. Cunningham's textbook of anatomy. London, England: Hodder & Stoughton; 1922:255–260.
- Jaramaz B, DiGioia IIIAM, Blackwell M, et al. Computer assisted measurement of cup placement in total hip replacement. Clin Orthop Relat Res. 1998;354:70–81.
- Anda S, Svenningsen S, Grøntvedt T, et al. Pelvic inclination and spatial orientation of the acetabulum: a radiographic, computed tomographic and clinical investigation. Acta Radiol. 1990;31:389–394.
- Muller O, Reize P, Trappmann D, et al. Measuring anatomical acetabular cup orientation with a new X-ray technique. Comput Aided Surg. 2006;11:69–75.
- Wolf A, DiGioia IIIAM, Mor AB, et al. Cup alignment error model for total hip arthroplasty. Clin Orthop Relat Res. 2005;437:132–137.