
Abstract
Motor learning is crucial to surgical skills enhancement, but its neural mechanism has been investigated only using some simple tasks with limited motor involvement. This study aimed to gain more understanding of the neural dynamics during motor learning by investigating the time course of electroencephalogram (EEG) activities in the continuous tracking task that involves more motor components. One participant performed 16 trials of the continuous tracking task on Day1 and Day2 respectively. The 16-channel EEG signals were recorded and analyzed in both the resting and active states. Results showed that the tracking performance improved from Day1 to Day2. Regarding the EEG, it was found that the relative amplitude in the individual alpha band (IAB) decreased locally over primary motor cortex from the resting state to the active state on both days, and this reduction was more focused on the left primary motor cortex on Day2 compared to Day1. Moreover, in the active state the alpha coherence between central and frontal areas also significantly increased from Day1 to Day2. Time course of alpha activities may explain the tracking performance enhancement from Day1 to Day2. Future work will include more participants to extend the validity of current results.
1. Introduction
Motor learning is a process to build an exact matching model between perceived sensory input and operative motor demands, which is not only essential in numerous daily activities such as driving, typing and playing instruments or sports [Citation1] but also crucial to the rehabilitation like stroke recovery [Citation2] and surgical skills enhancement [Citation3]. Understanding the neural activities in the motor learning process could provide hints for the interaction between the cortical regions and the surgical training in order to lay a foundation on the development and refinement of surgical training strategies [Citation3].
Plenty of research investigated the neural activities during motor learning using simple motor tasks based on finger tapping. For instance, the most widely used serial reaction time task (SRTT) [Citation4,Citation5] may induce morecognitive improvement but limited motor learning. Compared to the SRTT, another typical motor task paradigm named the continuous tracking task paradigm [Citation6] is considered more suitable for motor learning investigation, as it involves much more motor components.
Generally in a continuous tracking task, participants are required to track a target moving on a monitor with a hand-driven device. The trajectory of target movements is a waveform that consists of three equal-duration segments generated by sine-cosine polynomials, with random patterns in the first and the third segments but a constant pattern in the middle one over trials. The motor learning is induced in this task paradigm, evidenced by the tracking performance improvement across the practice trials of task. In addition, being blinded to the segment composition, participants are unaware of the existence of the constant pattern, which also enables the researchers to investigate the implicit learning with this task paradigm.
With more motor components involvement, the continuous tracking task is much more complicated and difficult than the SRTT, leading to more complicated neural responses. Deeper understanding on the continuous tracking task paradigm is of great help to better investigate the neural mechanism of motor learning. Previous work [Citation7] investigated the factors that undermined conclusions about the implicit motor learning induction in the continuous tracking task based on two experiments. Although this work examined the time-on-task effect and demonstrated the successful induction of implicit motor learning in the continuous tracking task, it did not perform any further analysis of the neural dynamics related to the sensorimotor processing. With electroencephalogram (EEG) coherence analysis, another study [Citation8] demonstrated that implicit motor learning in the continuous tracking task facilitated the neural resources deployment and promoted neural efficiency during a surgical skill (i.e. laparoscopy) training. The findings showed that the T3-Fz coherence in alpha band was significantly lower for the implicit learner than that for the explicit learners, which indicated that implicit motor learning reduced the EEG co-activation between verbal-analytic and motor planning areas during the task. However, only the T3-Fz and T4-Fz coherence rather than the comprehensive analysis of EEG activities was involved in the aforementioned study.
Although several researchers have explored the continuous tracking task paradigm in the aspects of task performance and neural resources deployment, the time course of brain activity in this task paradigm remains not well known. Moreover, a comprehensive investigation of different EEG bands in both the resting and active states (the active state refers to that the participant is performing the continuous tracking task) is critical, since it provides more details on the neural dynamics involved in this task paradigm and leads to better understanding on the neural mechanism of motor learning. To this end, this pilot study attempted to investigate the time course of EEG activities in different brain regions in the continuous tracking task.
2. Materials and methods
2.1 Participant
One healthy young adult with corrected-to-normal vision (male, aged 20, right-hand dominated) participated in the experiment. The participant was not using any sort of chronic medication or addictive drugs, and not suffering from any kind of neurologic, psychiatric or psychological disorder. All the experimental details were explained and an informed consent was signed before the experiment. The protocol was in accordance with the Declaration of Helsinki and approved by the Research Ethics Committee (University of Macau).
2.2. Task and procedure
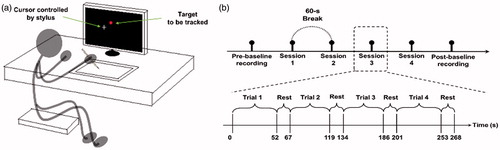
The participant was seated comfortably in front of an LCD monitor (ViewSonic 22”, refresh rate 120 Hz, 1680 × 1050 pixel resolution) with a viewing distance of about 80 cm. The full screen was proportionally projected to a tablet (PTH-851, Wacom Intuos pro, Japan) with an active area of 12.8 × 8.0 inch. With a stylus and the tablet, the participant was instructed to track a small red dot with a diameter of 9 mm displayed on the screen by controlling the movements of a cross-shaped white cursor as shown in . The proportion between the stylus movements on the tablet and the cursor movements on the monitor is exactly 1:2. The goal of this task was to track the moving red dot horizontally with an invisible sinusoidal trajectory as accurately as possible. A custom Java program (Sun Microsystems, Santa Clara, CA) was designed to generate the waveform patterns, control the complexity of the trajectory of target (red dot) movements, and record the positions of both the cursor and the target at a sampling rate of 32 Hz.
Figure 1. (a) Illustration of the continuous tracking task. (b) The schematic representation of the experiment on each day.
One trial comprises three equal-duration segments. In each segment, the waveform of the target movements is consisted of a uniform rectilinear motion in the horizontal direction and a curvilinear motion in the vertical direction that was generated by a sine-cosine series written as follow:
(1)
where αi is the rounded vertical coordinate of the i-th position at which the target is to be displayed, θi=i×2.14π/(time×freq), with time representing the segment duration and freq representing the sampling rate. The duration is 17.14 s and the sampling rate for display is chosen the same as that for recording for consistency and simplicity. By transforming the first 15% and last 15% of each segment, a smooth transition between two consecutive segments was created to ensure that each segment could start and end at “0”. Thus, only the middle 70% of each segment was analyzed to evaluate the tracking performance. The waveform pattern of the middle segment was fixed across trials, while the waveform patterns of the other two segments were randomly generated in each trial. Moreover, in order to strictly control the complexity, two criteria were followed: (a) the numbers for coefficients were within the range of ±5, and (b) the difference among the mean velocities of the waveform of three segments was no more than 1% when running the task.
The experiment was conducted on the two days indicated by Day1 and Day2, with a three-day interval. The experimental schedule was the same for both days as shown in except that the constant patterns in the middle segments were different between these two days. The participant completed 4 sessions with a 60-s interval between two consecutive sessions on each day. Each session contained 4 trials with a 10-s interval between two consecutive trials. On each day, the resting EEG signals were recorded in the eyes-closed and eyes-open conditions (four 30-s epochs for each condition) right before and after performing the continuous tracking task, which were defined as pre-baseline and post-baseline respectively.
2.3. EEG recording
The EEG signals were recorded from 16 channels including C3, Cz, C4, P3, Pz, P4, Fz, F7, F8, F3, F4, T3, T4, O1, Oz and O2 according to the international 10-20 system. Impedance for all electrodes was kept below 10 kΩ. The ground electrode was placed on the forehead and the reference electrode was placed on the left mastoid. The EEG signals were amplified by an amplifier of g.USBamp (Guger Technologies, Graz, Austria) with a sampling rate of 600 Hz. In order to avoid the baseline drift, high frequency noise and powerline interference, all EEG signals were pre-processed by a built-in band-pass filer ranged from 0.5 to 60 Hz and a notch filter at 50 Hz in the amplifier. Subsequently, the artifacts with amplitudes beyond ±75 μV were removed from the EEG data prior to further analysis.
2.4. Data analysis
The participant’s tracking performance was calculated in each trial using the root mean square error (RMSE) in screen pixels (the lower the RMSE, the better the tracking performance). In the resting states and each trial of the continuous tracking task, the relative EEG amplitudes in eight frequency bands (relative to 0.5–30 Hz) were calculated for further analysis, including the delta (0.5–4 Hz), theta (4–8 Hz), sigma (12–16 Hz), beta1 (16–20 Hz), beta2 (20–28 Hz), individual alpha band (IAB: peak alpha frequency (PAF) ± 2 Hz), high IAB (HIAB: PAF to PAF + 2 Hz) and low IAB (LIAB: PAF - 2 Hz to PAF). Here, IAB instead of fixed alpha band (8–12 Hz) was analyzed due to the large inter-individual and inter-location difference in the alpha band [Citation9]. In addition to the relative EEG amplitudes, EEG C3-C4, C3-P3, C3-P4, C3-F3 and C3-F4 coherence was also analyzed in the aforementioned eight EEG frequency bands. A Hamming window (2048 sample and 50% overlap) was used for coherence calculation. 1-tailed paired sample t test was applied to examine whether the tracking performance on Day2 was significantly better than that on Day1. Moreover, in order to investigate the time course of aforementioned EEG frequency bands, the following statistics analyses were performed. First, the mean relative EEG amplitudes and coherence in each frequency band in the active state across trials were compared with the pre-baseline on both days. Then 2-tailed paired sample t tests were also used to examine (a) whether the relative EEG amplitudes or EEG coherence in the active state had significant difference between days, and (b) whether the intra-hemispheric and inter-hemispheric EEG coherence in the active state had significant difference on both days.
3. Results
3.1 Tracking performance
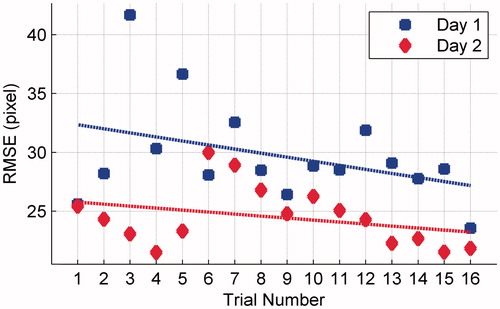
presents the mean RMSE of three segments in each trial on both days. The tracking errors (RMSE) on both days showed a decreasing trend across trials, which indicated that the tracking performance kept improving across trials on each day. 1-tailed paired sample t test showed that the RMSE on Day2 was significantly lower than that on Day1 (t = 4.088, p = 0.0005), indicating that the tracking performance on Day2 was significantly superior to that on Day1.
Figure 2. Mean RMSE of three segments in each trial on both days.
3.2. Time course of EEG activities
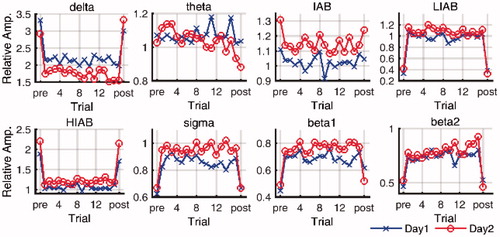
In both pre- and post-baseline and each trial of the continuous tracking task, the relative EEG amplitudes were calculated in eight frequency bands. presents the relative EEG amplitudes at C3 in the pre-baseline, 16 trials, and the post-baseline on both days. It can be seen that the relative EEG amplitudes in the active state in all bands are obviously different from those in the resting state, which is also observed in other channels.
Figure 3. The time course of relative EEG amplitudes in eight frequency bands on both days. (pre: pre-baseline, post: post-baseline).
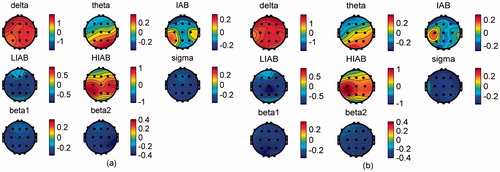
In order to compare the EEG activities between the resting and active states, the relative EEG amplitudes were averaged across trials and then compared with the pre-baseline. The statistical analysis is not available due to the small number of participants. Therefore, the relative EEG amplitude differences (i.e. pre-baseline - active state) between these two states are shown in , from which we can see that a broad beta band (including sigma, beta1 and beta2, 12–28 Hz) in the active state is obviously higher than that in the resting state in all brain regions on both days. In contrast, delta in all brain regions and theta in the occipital lobe in the active state were lower than that in the resting state on both days. Moreover, it is interesting that the changing trend between the active and resting states in HIAB was opposite to that in LIAB in all channels, e.g. the HIAB in the active state was obviously lower than that in the resting state at C3, while the LIAB showed the opposite result. Furthermore, IAB in the active state decreased locally over the left primary motor cortex (at C3) but increased in all the other channels on Day2 while on Day1 IAB also increased in all channels except for the right and left primary motor cortex (at C3 and C4).
Figure 4. Mean difference of the relative EEG amplitudes between pre-baseline and active state on (a) Day1 and (b) Day2. (pre-baseline - active state).
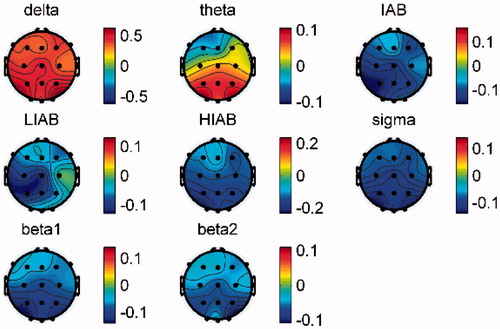
As shown in , the relative EEG amplitudes in several frequency bands were obviously different between Day1 and Day2. further shows the p value of paired sample t test of relative EEG amplitudes comparisons in the active state between two days, and shows the mean difference of relative EEG amplitudes (i.e. Day1 - Day2) in the active state across trials. It can be observed that the HIAB, IAB and sigma in all recorded brain regions on Day2 were significantly higher than those on Day1 while delta showed a significant decrease from Day1 to Day2. Also, LIAB in the left frontal, central and temporal lobes on Day2 were significantly higher than those on Day1. Besides, theta in the occipital lobe, beta1 in all regions except the left temporal lobe, and beta2 in the central and occipital regions presented significant difference between two days.
Figure 5. P value of paired sample t test of the relative EEG amplitudes in the active state comparison between Day1 and Day2.
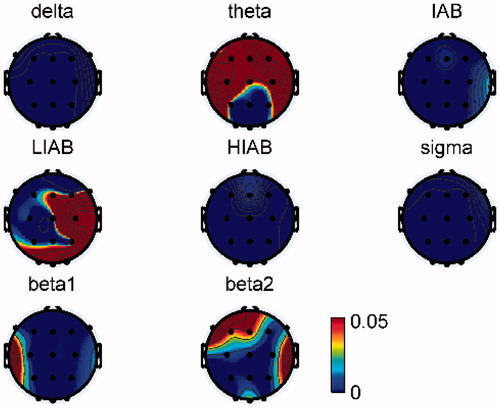
Figure 6. Mean difference of the relative EEG amplitudes across trials between two days. (Day1-Day2).
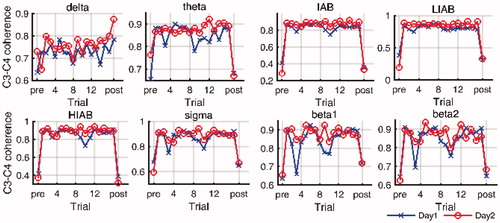
Regarding the EEG coherence between C3 and other four channels in different brain regions, the differences of the coherence levels between the resting and active states varied among frequency bands. As illustrated in , EEG C3-C4 coherence level was relative low in the resting state in all analyzed frequency bands except delta, whereas it increased to around 0.9 sharply in the active state, particularly for IAB, LIAB and HIAB. The similar trends were also observed in EEG C3-F4 and C3-P4 coherence on both days. On the contrary, EEG C3-P3 and C3-F3 coherence levels were high in both the resting and active states. Furthermore, although all analyzed alpha coherence in the active state was high (no less than 0.6), paired sample t test showed that the intra-hemispheric alpha coherence (C3-P3 and C3-F3) was significantly higher than the corresponding inter-hemispheric alpha coherence (C3-P4 and C3-F4) on both days (p < 0.0001). In the comparison between two days, EEG coherence significantly increased in LIAB (p < 0.01) and delta band (p < 0.05) from Day1 to Day2. Moreover, EEG C3-C4, C3-F3 and C3-F4 coherence also showed significant increase in IAB and HIAB while it was not the case for C3-P3 and C3-P4 coherence.
Figure 7. The time course of EEG coherence in eight frequency bands on both days. (pre: pre-baseline, post: post-baseline).
4. Discussion
This pilot study investigated the time course of EEG activities during a typical motor learning task, namely the continuous tracking task paradigm. One participant performed 16 trials of the continuous tracking task with different constant patterns on Day1 and Day2 respectively with a three-day interval. The EEG signals from 16 channels in both the resting and active states were recorded, and the relative EEG amplitudes and the EEG coherence between the left primary motor cortex and other brain regions in eight frequency bands were analyzed.
The time course of EEG activities showed that the relative EEG amplitudes and coherence were obviously different between the resting and active states on both days. Compared to the resting state, the relative amplitude in delta band was obviously lower in the active state, probably because the delta component reflected sustained attention requirement of the continuous-attention tasks [Citation10]. In contrast, the relative amplitudes in high frequency bands (i.e., sigma, beta1 and beta2) obviously increased in all recorded channels, which may be related to the excitability change of the primary motor cortex, since increased beta power can be considered as an electrophysiological indicator of the imbalance in the excitation-inhibition homeostasis in the cortex [Citation11]. Regarding alpha bands, IAB in the active state decreased locally over left primary motor cortex while slightly increased in other brain regions. This phenomenon was reasonable due to the relations between the right-handed driven motor task and the increased excitability over the left primary motor cortex. The locally decreased IAB was probably associated with the excitability enhancement of motor cortex [Citation12] while the increased IAB could be caused by the excitability inhibition of other regions, which resembled the ‘focal ERD/surround ERS’ phenomenon [Citation13,Citation14]. It was interesting that HIAB and LIAB showed opposite change in all channels and the locally decreased IAB might result from obviously the decrease of HIAB and the increase of LIAB in all brain regions.
EEG coherence is a widely used indicator of brain functional coupling between different cortical areas [Citation15]. This study mainly investigated the EEG coherence changes among 5 electrode pairs in order to detect the functional connection changes between the sensorimotor area contralateral to the movement (C3) and the bilateral parietal (P3 and P4) and frontal (F3 and F4) areas. The frontal area plays a critical role in the control of posture and particularly in postural adjustments [Citation16], which may explain the high level of EEG C3-F3 and C3-F4 coherence during the continuous tracking task in an exact demand of the posture control and adjustment. Some previous studies suggested that the parietal area also contributed to the transformation of perceived sensory input into operative motor commands along with the central motor system [Citation17,Citation18]. Moreover, it was demonstrated that the parietal and central areas enhanced the functional coupling of EEG rhythms specifically involving the expectancy of contralateral motor activity [Citation19]. It explained the EEG coherence enhancement between the central and parietal areas during the continuous tracking task, since the tracking was a motor event involving the expectancy of target movement across the whole task.
In terms of the comparison between two days, it turned out that though using different constant patterns and with a three-day interval, the tracking performance on Day2 was significantly better than that on Day1, which indicated that the consolidation of motor learning lasted for more than 3 days. Moreover, although EEG activities in the active state of both days had consistent changing trends over trials as shown in and , the differences of the relative EEG amplitudes and coherence between Day1 and Day2 were significant. Overall, compared to Day1, the beta amplitudes significantly increased in most brain regions, while the low frequency bands like delta significantly decreased in all channels and theta significantly decreased in occipital lobe on Day2. HIAB and IAB amplitudes on Day2 were also significantly higher than those on Day1 in all recorded regions while LIAB only increased significantly over left primary motor cortex, which could be related to the tracking performance improvement on Day2. Consistent with the aforementioned findings, the IAB ‘focal ERD/surround ERS’ phenomenon was more obvious on Day2 than that on Day1 as shown in , which might imply the better tracking performance on Day2. It is noteworthy that a study based on visual cued finger movements in [Citation20] reported that the 10 Hz coherence increased between the central and frontal areas during 10 Hz ERD over sensorimotor areas. Similarly, besides the more obvious IAB ‘focal ERD/surround ERS’ phenomenon, the significant increase in alpha (including IAB, LIAB and HIAB) coherence from Day1 to Day2 might be also related to the tracking performance improvement.
5. Conclusion
This pilot study mainly investigated the time course of EEG activities across a typical motor task in the aspects of relative EEG amplitudes and EEG coherence. The relative amplitudes in alpha bands (IAB, LIAB and HIAB) over primary motor cortex contralateral to the movement and alpha coherence between the central area and frontal/parietal areas may play a crucial role in motor learning indicated by tracking performance improvement. The findings in this pilot study can help in understanding the neural dynamics in the continuous tracking task and giving a direction in further investigation on the mechanism of motor learning so as to enhance motor skills included in the surgical and microsurgical procedures. Our future work will investigate more participants to extend the validity of current results.
Acknowledgements
This work is supported in part by the Macau Science and Technology Development Fund (FDCT) under projects 036/2009/A, 142/2014/SB and 055/2015/A2, the University of Macau Research Committee under MYRG projects 079(Y1-L2)-FST12-VMI, 069(Y1-L2)-FST13-WF, 2014-00174-FST, 2016-00240-FST and 2017-00207-FST and Shanghai Municipal Education Commission High Peak & Plateau Program.
Disclosure statement
No potential conflict of interest was reported by the authors.
Additional information
Funding
References
- Heyes C, Foster C. Motor learning by observation: evidence from a serial reaction time task. Q J Exp Psychol A. 2002;55:593–607.
- Krakauer J. Motor learning: its relevance to stroke recovery and neurorehabilitation. Curr Opin Neurol. 2006;19:84–90.
- Ros T, Moseley M, Bloom P, et al. Optimizing microsurgical skills with EEG neurofeedback. BMC Neurosci. 2009;10:87.
- Trembach A, Aganianz E. EEG Mapping during motor learning in left-handed humans. Neuroimage. 2001;13:1272.
- Vernet M, Bashir S, Robertson E, et al. Motor cortical and distributed network modulation during visuo-motor learning: a TMS-EEG study. J Vis. 2011;11:936.
- Pew R. Levels of analysis in motor control. Brain Res. 1974;71:393–400.
- Zhu F, Poolton J, Maxwell J, et al. Refining the continuous tracking paradigm to investigate implicit motor learning. Exp Psychol. 2014;61:196–204.
- Zhu F, Poolton J, Wilson M, et al. Implicit motor learning promotes neural efficiency during laparoscopy. Surg Endosc. 2011;25:2950–2955.
- Klimesch W. EEG alpha and theta oscillations reflect cognitive and memory performance: A review and analysis. Brain Res Brain Res Rev. 1999;29:169–195.
- Kirmizi-Alsan E, Bayraktaroglu Z, Gurvit H, et al. Comparative analysis of event-related potentials during Go/NoGo and CPT: decomposition of electrophysiological markers of response inhibition and sustained attention. Brain Res. 2006;1104:114–128.
- Rangaswamy M, Porjesz B, Chorlian D, et al. Beta power in the EEG of alcoholics. Biol Psychiatry. 2002;52:831–842.
- Ros T, Munneke M, Ruge D, et al. Endogenous control of waking brain rhythms induces neuroplasticity in humans. Eur J Neurosci. 2010;31:770–778.
- Tsoneva T, Garcia-Molina G, Desain P. Neural dynamics during repetitive visual stimulation. J Neural Eng. 2015;12:66017.
- Suffczynski P, Kalitzin S, Pfurtscheller G, et al. Computational model of thalamo-cortical networks: dynamical control of alpha rhythms in relation to focal attention. Int J Psychophysiol. 2001;43:25–40.
- Thatcher R, Krause P, Hrybyk M. Cortico-cortical associations and EEG coherence: a two-compartmental model. Electroencephalogr Clin Neurophysiol. 1986;64:123–143.
- Luppino G, Rizzolatti G. The organization of the frontal motor cortex. News Physiol Sci. 2000;15:219–224.
- Douek M, Wickramasinghe M, Clifton M. Failure to recognise objects by active touch (astereognosia) results from lesion of parietal- cortex representation of finger kinaesthesis. Lancet. 1999;354:393–394.
- Fogassi L, Luppino G. Motor functions of the parietal lobe. Curr Opin Neurobiol. 2005;15:626–631.
- Babiloni C, Brancucci A, Vecchio F, et al. Anticipation of somatosensory and motor events increases centro-parietal functional coupling: an EEG coherence study. Clin Neurophysiol. 2006;117:1000–1008.
- Leocani L, Toro C, Manganotti P, et al. Event-related coherence and event-related desynchronization/synchronization in the 10 Hz and 20 Hz EEG during self-paced movements. Electroencephalogr Clin Neurophysiol. 1997;104:199–206.