
Abstract
The Taguchi dynamic analysis was applied to optimize the linear dependence between computer tomography (CT) number and mass density. The Taguchi unique L18(21 × 35) orthogonal array was utilized in the dynamic analysis of a commercial Catphan 600 phantom with CTP 404 module, in order to optimize eighteen combinations of six factors controlling the CT simulator operation, i.e. scan time, kVp, mA, field of view (FOV), slice thickness, and imaging processing algorithm. Each factor being assigned two or three different levels made it possible to organize the required number of combinations (18). The seven materials involved in the phantom possessed different mass densities, which were incorporated into the dynamic analysis. The revised signal-to-noise ratio (S/N) was utilized to describe the integrated performance of various factors’ combinations in pursuing the optimal ρm-CT number (HU) calibration curve. The optimal option was found to be: 1 s scan time, 130 kVp, 200 mA, 40 cm2 FOV, 3 cm of slice thickness, and soft type of algorithm for maintaining the ρm-HU calibration. Factors kVp and FOV dominated the performance either by providing a significant change in S/N value or strongly improving the reproducibility in daily quality assurance. The ρm-HU calibration (HU = 1016.9 × density + 1029.5, r2 = 0.9954) was further verified by the treatment planning systematic default (TPS) (HU= 1242.1 × density+ 1054.8, r2 = 0.9755). The well-calibrated ρm-HU curve was successfully applied to clinical examination of the simulated oral cancer from CT scanned slice via a Rando phantom. A significant disagreement between optimal and default isodose curves was observed for doses exceeding 7000 cGy, while a good fit was exhibited by doses below 5000 cGy.
Introduction
A CT simulator is a vital component in the radiation oncology facility. It enables the medical physicists to ensure the exact position, size and shape of the tumor so that they may develop a sound treatment plan. CT simulator transmits X-rays through tissue to create a graphic display of the tumor and surrounding normal tissue. A CT Simulator allows for precise treatment planning by demonstrating the calibration between the target tumor and healthy tissues while the patient is in treatment position.
The conversion of the computed tomography (CT) number (HU) into a mass density (ρm) relative to water is one of the main processes that determine the accuracy of patient dose calculations in radiotherapy treatment planning [Citation1]. An accurate ρm-HU calibration is instrumental for medical physicists in estimating the administered dose for the specific carcinoma cases. The required accuracy of the therapy dose estimation is ±5% in compliance with the ICRU-24'. However, the estimation accuracy of 2-3% is strongly recommended by regulations [Citation2–4], since the calculated dose is the theoretical basis for practical applications. A well-calibrated linearity of the electron density would allow one to minimize the cumulative uncertainty of the ρm-HU conversion, since sharp variations of mass density are well-known to control dose fluctuations in the treatment planning simulation.
The importance of proper ρm-HU calibration has been reported by numerous researchers, with various solutions being proposed to promote the CT daily quality assurance. Thus, Saito [Citation1], and Landry et al. [Citation5] applied the dual-energy subtraction for converting CT numbers to electron density according to a simplified linear regression fit. Goodsitt et al. [Citation6] applied a rapid kVp switching dual energy CT to upgrade the accuracy of ρe-HU calibration. In order to verify the calibration of ρe-HU, Petit et al. [Citation7] adopted the revised algorithm in Monte Carlo simulation and an indigenous PMMA phantom, whereas Bush et al. [Citation8] applied the Monte Carlo simulation with the revised database. In this study, a robust designation was performed to gain a superior ρm-HU calibration. The revised algorithm was executed for a commercial Catphan 600 phantom with CTP 404 module, which has seven different materials as referred standard. Eighteen combinations of six factors in presetting the CT simulator were realized according to the Taguchi dynamic analysis, and each combination was measured three times to ensure the method reproducibility. The unique definition of sensitivity and standard deviation, those were revised from the original Taguchi dynamic analysis, was introduced to integrate the empirical data altogether. In contrast to conventional static optimization, the dynamic robust design as proposed herein integrates the unique needs for ρm-HU calibration in compliance with the Taguchi recommendation. The dynamic design optimizes performance in more than just a single situation while the static one emphasizes only a single requirement for a specific condition. Therefore, the specific expectation value in dynamic design requires both good reproducibility in a particular material and a strong linearity among all materials.
The optimized option of ρm-HU calibration was further verified and confirmed by the clinical application. The optimal ρm-HU calibration combined a high sensitivity representing linearity with a low deviation to ensure the reproducibility. The discrepancies between the results of static and dynamic optimal analyses and the dominant factors in the optimization procedure are discussed in detail.
Materials and methods
Orthogonal arrays
The Taguchi dynamic analysis, as compared to other optimization techniques, determines both the optimal result from finite analytical data and the dominant factors involved in the optimization of ρm-HU calibration from finite analytical data. This method has been widely applied in precise manufacturing [Citation9,Citation10] and other fields [Citation11–13]. In this work, six essential factors in presetting the CT simulator were obtained as (1) scan time, (2) kVp, (3) mA, (4) Field of View (FOV), (5) slice thickness, and (6) imaging processing algorithm, the latter being defined as standard, detail, or soft one, respectively [Citation14]. These six factors were considered altogether with two or three different levels of each to optimize the output. Thus, a total of 486 (2 × 3 × 3 × 3 × 3 × 3= 486) different combinations were considered. However, according to Taguchi, if samples are considered separately, their arrangement into eighteen groups will provide the same accuracy (confidence) as the above 486 groups [Citation15]. The arrangement of samples within eighteen groups according to the Taguchi approach is presented in . The numbers indicate the various experimental layouts or levels of the different factors. Thus, eighteen groups of six factors combinations, according to the Taguchi approach are organized as displayed in (cf. ). Data of each adopted material in group were averaged from three measurements to ensure their statistical accuracy.
Table 1. The Taguchi’s unique orthogonal array of L18 (21 ×35), a total of 486 (2 × 3 × 3 × 3 × 3 × 3= 486) different combinations were considered.
Table 2. Six factor combination in every group according to the Taguchi’s recommendation.
Signal-to-noise ratio, S/N
To optimize the ρm-HU calibration, empirical slope (m) of the ρm-HU linear regression fit is used as a metric of the sensitivity when CT simulator is in different preset. The signal-to-noise ratio, S/N [dB], is proposed herein to quantify the integrated performance of the ρm-HU regression. The S/N ratio is revised based on the dynamic optimization method developed by Taguchi [Citation16]. The parameter S/N integrates both a superior conversion constant and a low standard deviation, thus pursuing the highest S/N in the optimization always yields the crucial point. Here parameters β and S/N are defined as follows:
(1)
(2)
(3)
(4)
where β is the conversion constant, and Y is the derived CT number (HU) to the specific mass density X (ρm [gcm−3]). The term stdev denotes the integrated standard deviation of the repeated mass density in obtaining the CT number (HU) that is averaged over n (number) repeated measurements for all m values (materials). In this study, n and m are equal to 3 and 7, respectively. In addition, b denotes the CT number of zero mass density in the ρm-HU linear regression fit, and the value is negative if it is lower than that of water. The theoretical CT number of water (ρm: 1.0) is assumed to be zero.
Computed tomography simulator
The adopted CT simulator, PHILIPS/MARCONI ACQSIM CT Single-slice, was located at the Department of Radiation Oncology, Taichung Veterans General Hospital. It is equipped with 2400 detectors along the detectable ring and provides a larger diameter and field of view (FOV) of 85 and 60 cm, respectively, as compared to those of the conventional CT scans (70 and 50 cm, respectively), since it allows to scan the patient with auxiliary tool for precise positioning in advance of real treatment.
Catphan 600 phantom
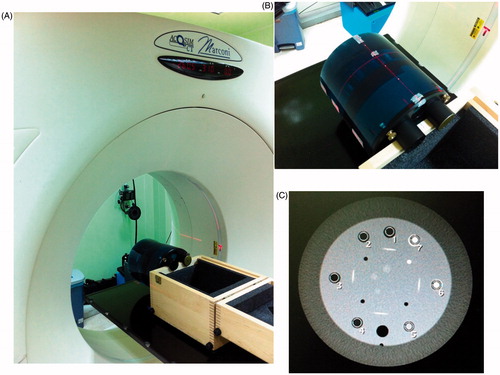
A commercialized phantom model Catphan 600 module CTP404 (The Phantom Lab, Salem, USA) was adopted as a standard phantom [Citation17]. The unique module CTP404 included seven different materials: air, PMP, LDPE, Polystyrene, Acrylic, Delrin and Teflon with mass density (ρm) equal to 0.001, 0.853, 0.944, 1.017, 1.146, 1.354, and 1.876 [gcm−3], respectively. In this work, the region of interest (ROI) of each adopted materials exceeded 80% of the total cross section from the CT slice (∼70–75 mm2 in reality). depicts the CT simulator and Catphan 600 module CTP 404 as applied in this work. Here, depicts the CT simulator, PHILIPS/MARCONI ACQSIM CT Single-slice with a flat couch to easy locate the auxiliary tool for precise positioning the patient for treatment planning, is the close up view of the Catphan 600 phantom with module CTP404 inside, and is the CT scanned profile of module CTP 404, the marked numbers corresponding to seven materials, such as air, PMP, LDPE, Polystyrene, Acrylic, Delrin and Teflon in the sequential order.
Figure 1. The CT simulator and Catphan 600 module CTP 404 as applied in this work. (A) depicts the CT simulator, PHILIPS/MARCONI ACQSIM CT Single-slice with a flat couch to easy locate the auxiliary tool for precise positioning the patient for treatment planning, (B) is the close up view of the Catphan 600 phantom with module CTP404 inside, and (C) is the CT scanned profile of module CTP 404, the marked numbers corresponding to seven materials, such as air, PMP, LDPE, Polystyrene, Acrylic, Delrin and Teflon in the sequential order.
Results
Data analysis
lists the average CT numbers (HU) of the seven materials inside the Catphan phantom 600, module CTP404. The HU values were averaged from three independent measurements to ensure the reproducibility and the corresponding sensitivity (m) from the linear regression fit of the ρm-HU calibration (cf. EquationEquation 4(4) ). The essential standard deviation stdev (cf. EquationEquation 2
(2) ) and the Taguchi unique definition of signal-to-noise ratio (cf. EquationEquation 3
(3) ) are also listed. illustrates the derived linear regression fit of every group. As clearly depicted, every regressed fit had high coefficient of determination (r2 ∼1.000) and the slope (i.e. sensitivity, m) fluctuated from 975 (group 7) to 1049 (group 1). In the systematic default of CT simulator, the derived HU is zero for pure deionized water, and is negative or positive if the mass density is lower or higher than that of water. The derived HU exhibits strong fluctuations if the CT-scanned ROI contains a complex tissue organization with various mass densities, and thus, the inappropriate conversion of ρm-HU calibration might acutely mislead the clinical evaluation. Accordingly, the optimization process becomes an integral component of daily quality assurance for medical physicists.
Figure 2. The derived linear regression fit of every group. As clearly depicted, every regressed fit had high coefficient of determination (r2 ∼1.000) and the slope (i.e. sensitivity, m) fluctuated from 975 (group 7) to 1049 (group 1).
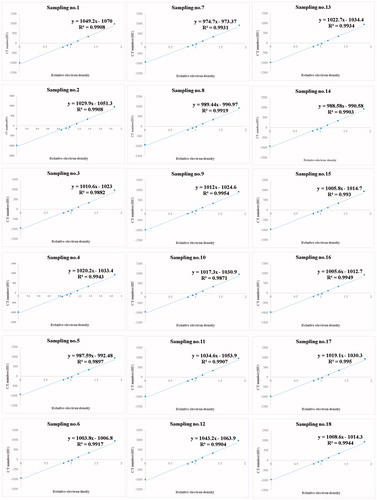
Table 3. The derived data from the CT simulator and the correlated calculations of sensitivity, stdev, and S/N. the data were averaged from three independent CT scanning.
Contributions of various factors
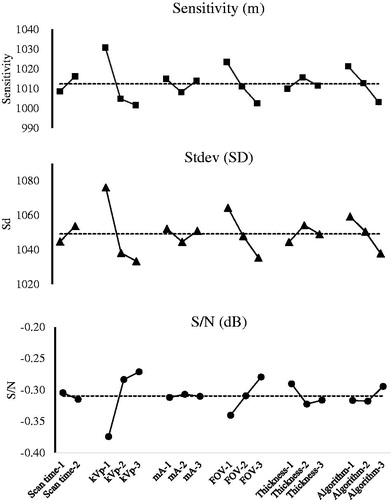
The Taguchi dynamic analysis not only identifies the sensitivity (m) for ρm-HU calibration, but also effectively elucidates the dominant factors. In the unique orthogonal arrangement of various factors, the factor level frequencies are fixed across the 18 groups (cf. ), and the data thus obtained are rearranged to elucidate the dominant factors. shows the sensitivity, standard deviation (stdev), and S/N versus six factors, respectively. Apparently, the CT simulator performance is controlled by dominating factors kVp or FOV, insofar as any slight variation of these two factors affected the entire performance, whereas variation of other factors caused minor fluctuations of only one or two indices of the total three ones.
Figure 3. The sensitivity, standard deviation (stdev), and S/N versus six factors, respectively. Apparently, the CT simulator performance is controlled by dominating factors kVp or FOV.
Discussion
Calibration linearity verification
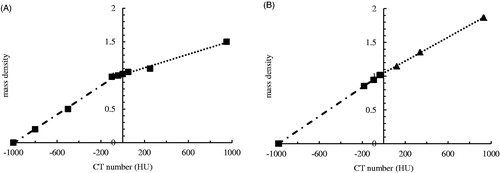
The optimal combination of six factors for presetting the CT simulator is easily obtained from the trends of S/N versus each individual factor depicted in . This implies 1 s scan time, 130 kVp, 200 mA, 40 cm2 FOV, 3 cm of slice thickness, and soft algorithm. The optimal combination is outside the original eighteen combinations proposed by Taguchi and confirmed by the following measurements. The derived S/N of the optimal one is −0.32 dB, which is the medium one among the eighteen original groups, and the linear regressed fit of CT number (HU) to mass density is HU = 1016.9 × ρm + 1029.5, r2 = 0.9954; stdev: 1055.6. Obviously, the optimal setting does not exceed the highest S/N (−0.21 dB in group 7), although further verification of ρm-HU calibration still yielded quite acceptable quality characteristics. The sensitivity of the optimal ρm-HU calibration does not need to be the maximal one (1049 in group 1), nor its standard deviation should be the minimal one (998 in group 7). Noteworthy is that when the conflicting features are compromised altogether magnifies the dynamic optimization to be an inevitable and superior approach rather than only single-purpose in static optimized demand. illustrates the difference between conventional and optimal settings of the CT simulator in this work. The straight linearity of the ρm-HU calibration provides a reliable optimization result. The mass density can be easily converted to CT number (HU) by a single straight line from −1000 to +1000 HU, whereas the conventional one fails to obey the straightforward application rule and has to be replaced by a broken line with linear portions in the range from −1000 to 0.00 and 0.00 to +1000 HU, respectively. In addition, the coefficient of determination (r2) is 0.957 and 0.9954, respectively for this two calibration curve. The broken line obtained from the conventional approaches may cause large fluctuation of CT numbers in routine quality assurance process. The calibration analysis becomes even confusing if the CT numbers approach 0.0, since the conflict values derived from two broken lines create a measurable gap and mislead the dose estimation from the systematic default program (cf. ). A well optimization process optimizes the CT number versus mass density with high sensitivity, high reproducibility and low standard fluctuation altogether, thus, the optimal combination of each CT scan facility needs to be customized according to domestic or unique consideration in reality.
Figure 4. The difference between conventional and optimal settings of the CT simulator in this work. The straight linearity of the ρm-HU calibration provides a reliable optimization result.
Taguchi dynamic analysis
Focusing only on high sensitivity (m), high reproducibility (stdev) or even high linearity (r2) may suppress the effectiveness of the dynamic optimization process. Therefore, a reliable evaluation of different factors combination must determine an integrated performance and reflect the practical usability. S/N is such an index of integrated performance for maintaining the CT simulator (cf. , ) since it complies both the sensitivity and stdev.
The two dominant factors in presetting the CT simulator are kVp and FOV. The CT number (HU) is strongly affected by the mass attenuated coefficient of the shielded material. Most researchers report the dominant contribution of kVp for HU, since the charged electrons depend heavily on the assigned voltage to CT simulator [Citation18–20]. An optimal CT kVp voltage can sufficiently energize the charged electrons so they will not be biased or weak to penetrate dense or light materials, respectively. In contrast, FOV dominates the ρm-HU calibration performing not because it holds the highest sensitivity but suppresses largely the uncertainty and thus improves the reproducibility (cf. ), which is crucial for the daily quality assurance, since it provides a low fluctuation of data acquisition in presetting the CT simulator. The compromised setting of CT simulator does not need to have the highest sensitivity to provide the ρm-HU calibration, but stable conversion allows medical physicists to ensure that the total administered dose is within the tolerance range and below permitted dose limit in the required organ, in order to avoid any unexpected or outraged damages by the planned treatment.
Clinical verification
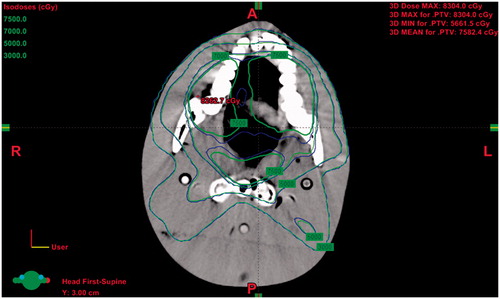
The optimal ρm-HU calibration is verified by the theoretical presetting of a true CT scanned slice. The treatment planning systematic default (TPS) ρm-HU calibration of the CT scan is defined as HU = 1242.1 × ρm + 1054.8, r2= 0.9755 for reference. According to this procedure, a medical physicist firstly marks the clinical target volume (CTV) of a simulated oral cancer patient, then 7000 cGy is split into 35 times of exposure with five entry angles (0, 75, 130, 230, and 285 degrees) along the outline of CTV to form PTV (planning target volume). The treatment planning is also preset to bypass the critical organ as spinal cord or parotid, and the dose is verified by the pencil beam convolution (PBC) algorithm. shows the true isodose curve of CT scanned slice from a Rando phantom head. As depicted in , the green curve corresponds to the optimal ρm-HU calibration, whereas the blue one is derived by TPS. The isodose curves are classified as follows: low (3000 cGy), medium (5000 cGy), high (7000 cGy), and extremely high (7500 cGy). Apparently, the discrepancy between high and too high isodose curves is quite significant, whereas a minor difference between two isodose curves in the low and medium dose ranges is observed.
Figure 5. The true isodose curve of CT scanned slice from a Rando phantom head. The green curve corresponds to the optimal ρm-HU calibration, whereas the blue one is derived by TPS.
Conclusion
The Taguchi dynamic analysis was successfully applied in this study to optimize a linear dependence between CT number and mass density. Eighteen combinations of six essential factors in presetting the CT simulator were realized for the Catphan 600, module CTP404 commercial phantom wherein seven materials of different mass densities provided the basis of the proposed dynamic analysis. The sensitivity (m), reproducibility (stdev), and linearity (r2) of the optimal ρm-HU calibration were corroborated by the conventional setting and successfully applied to clinical verification. The main advantage of dynamic analysis over a static one is a possibility of simultaneous dealing with multiple requirements for quality characteristics.
Disclosure statement
No potential conflict of interest was reported by the authors.
Additional information
Funding
References
- Saito M. Potential of dual-energy subtraction for converting CT numbers to electron density based on a single linear relationship. Med Phys. 2012;39:2021–2030.
- Mostaar A, Allahverdi M, Shahriari M. Application of MCNP4C Monte Carlo code in radiation dosimetry in heterogeneous phantom. Iran J Radiat Res. 2003;1:143–149.
- Kappas C, Rosenwald JC. Quality control of inhomogeneity correction algorithms used in treatment planning systems. Int J Radiat Oncol Biol Phys. 1995;32:847–858.
- Cunningham JR. Tissue inhomogeneity corrections in photon-beam treatment planning. Progress Med Radiat Phys. 1982;103–131.
- Landry G, Reniers B, Granton PV, et al. Extracting atomic numbers and electron densities from a dual source dual energy CT scanner: experiments and a simulation model. Radiother Oncol. 2011;100:375–379.
- Goodsitt MM, Christodoulou EG, Larson SC. Accuracies of the synthesized monochromatic CT numbers and effective atomic numbers obtained with a rapid kVp switching dual energy CT scanner. Med Phys. 2011;38:2222–2232.
- Petit SF, Elmpt WJC, Nijsten SMJJG, et al. Calibration of megavoltage cone-beam CT for radiotherapy dose calculations: correction of cupping artifacts and conversion of CT numbers to electron density. Med Phys. 2008;25:849–865.
- Bush K, Gagne IM, Zavgorodni S, et al. Dosimetric validation of Acuros XB with Monte Carlo methods for photon dose calculations. Med Phys. 2011;38:2208–2221.
- Cheng TC, Chang CY, Yao KS, et al. Optimization of preparation of the TiO2 Photocatalytic reactor using the Taguchi method. Adv Mat Res. 2008;47-50:351–354.
- Pan LK, Wang CC, Wei SL, et al. Optimizing multiple quality characteristics via Taguchi method-based Grey analysis. J Mater Process Tech. 2007;182:107–116.
- Chen CY, Liu KC, Chen HH, et al. Optimizing the TLD-100 readout system for various radiotherapy beam doses using the Taguchi methodology. Appl Radiat Isot. 2010;68:481–488.
- Chen CY, Pan LF, Chiang FT, et al. Optimizing quality of digital mammographic imaging using Taguchi analysis with an ACR accreditation phantom. Bioengineered. 2016;7:226–234.
- Chiang FT, Chu KH, Chen CY, et al. Taguchi’s analysis to optimize descending aortography for patent ductus arteriosus, with clinical verification. Hell J Nucl Med. 2016;19:118–123.
- Seeram E. Computed Tomography: Physical Principles, Clinical Applications, and Quality Control. Chapter 1, 4, 5,10, 11and 17, Elsevier Health Sciences. 3rd ed. 2009.
- Taguchi G. Introduction to quality engineering. Tokyo: Asian Productivity Organization, 1990.
- Yeh DM, Wang TH, Pan LK. Evaluating the quality characteristics of TLD-100T and TLD-100H exposed to diagnostic X-rays and 64 multislice CT using Taguchi’s quality loss function. Radiat Measure. 2015;80:17–22.
- Catphan 600 module CTP404. Available from: https://www.southernscientific.co.uk/data/file/f/2/SSL_Catpha-n%20600%20Datasheet.1438855766.pdf
- Noban A, Moftah B, Tomic N, et al. Influence of electron density spatial distribution and X-ray beam quality during CT simulation on dose calculation accuracy. J Appl Clin Med Phys. 2011;12:80–89.
- Atousa M, Mohammadreza A, Seied RM. Physical properties of ethyl methacrylate as a bolus in radiotherapy. Iran J Med Phys. 2012;9:127–134.
- Yagi M, Ueguchi T, Koizumi M, et al. Gemstone spectral imaging: determination of CT to ED conversion curves for radiotherapy treatment planning. J Appl Clin Med Phys. 2013;14:173–186.