
Abstract
Purpose: Light sources such as laser and light emitting diode or ultrasound devices have been widely used for cancer therapy and regenerative medicines, since they are more cost-effective and less harmful than radiation therapy, chemotherapy or magnetic treatment. Compared to laser and low intensity ultrasound techniques, light emitting diode and high frequency focused ultrasound shows enhanced therapeutic effects, especially for small tumors. Materials and methods: We propose combinational light emitting diode-high frequency focused ultrasound treatment for human cervical cancer HeLa cells. Individual red, green, and blue light emitting diode light only, high frequency focused ultrasound only, or light emitting diode light combined with high frequency focused ultrasound treatments were applied in order to characterize the responses of HeLa cells. Results: Cell density exposed by blue light emitting diode light combined with high frequency focused ultrasound (2.19 ± 0.58%) was much lower than that of cells exposed by red and green light emitting diode lights (81.71 ± 9.92% and 61.81 ± 4.09%), blue light emitting diode light (11.19 ± 2.51%) or high frequency focused ultrasound only (9.72 ± 1.04%). Conclusions: We believe that the proposed combinational blue light emitting diode-high frequency focused ultrasound treatment could have therapeutic benefits to alleviate cancer cell proliferation
Introduction
Light and ultrasound sources are currently widely utilized for cancer treatment and regenerative applications [Citation1–3]. Using laser technology for medical treatment described as phototherapy, and it has been used for treating skin ailments, cancers, nerve system disorders, and depression [Citation4–7]. Treatment using a laser light with a photosensitizer that can localize the cancer cell is called photodynamic therapy [Citation8].
Compared to laser technology, light emitting diode (LED) is cost-effective and safer for therapeutic uses. It generates less health risk since focused laser sometimes induces tissue damage due to accumulated heat on the local area [Citation9]. However, LED is originally a divergent source that a technical guidance to be converged to the target point [Citation10].
Among the imaging modalities such as X-ray, positron emission tomography, and magnetic resonance imaging, the ultrasound is a low-cost and non-invasive imaging modality [Citation11]. Low-frequency and low-intensity ultrasound treatment such as sonodynamic therapy and ultrasound-mediated chemotherapy are still under development for cancer therapy [Citation12]. In sonodynamic therapy, the unfocused ultrasound transducer is directly transmitted into the cancer cell, and it is easily sensitized by microbubbles [Citation12]. Compared to photodynamic therapy, it can be deeply transferred into the tumor because the light is attenuated and scattered widely in water and tissues as well as the skin surface [Citation12,Citation13]. In ultrasound-mediated chemotherapy, low frequency and intensity ultrasound beams helps chemotherapeutic agents transfer into tumor and enhances delivery to the target [Citation12]. However, this is not useful for vascularized tumors such as pancreatic cancer because the size of the microbubble is limited to the vasculature size [Citation14]. Rather than low intensity (<0.1 W/cm2) imaging devices, high intensity (>0.1 W/cm2) ultrasound devices are used as a treatment tool [Citation15,Citation16]. In recent years, the low frequency (<2 MHz) therapeutic ultrasound applied method, referred to as high intensity focused ultrasound has been extensively utilized to treat large malignant solid tumors [Citation17,Citation18].
Compared to low frequency and high intensity therapeutic methods, high frequency (>15 MHz) focused ultrasound (HFFU) is more useful for small soft tissue and cell acoustic stimulation and manipulation. This is because the beam’s focus of the ultrasound transducer for manipulating and trapping decreases as the operating frequency of the ultrasound increases [Citation19]. Therefore, we propose a feasibility study to demonstrate the potential application using the combinational LED-HFFU treatment for HeLa cell treatment since LED generates less damage to tissues. In addition, LED with guidance, combined with HFFU is an easier way to target tumor cells than low frequency ultrasound treatment.
Method
HeLa cell preparation
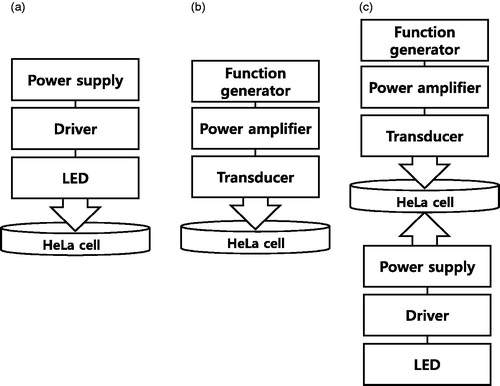
HeLa cells (Korean Cell Line Bank, Seoul, South Korea) were cultured in high glucose Dulbecco’s modified eagle medium (DMEM) containing 10% fetal bovine serum (FBS) and 1% penicillin streptomycin. The prepared cells were stored at 37 °C in a humidified incubator at 5% CO2. The cells were trypsinized when 80% confluence was achieved, washed three times with PBS, and re-suspended at density 5 × 10⁵ cells in a 60-mm culture dish. When the cell confluency reached about 40%, the LED/HFFU stimuli were administered and cells counted at Day 0. The ambient temperature was adjusted to 26 °C to avoid thermal damage to the cells. depicts the brief experimental setup of the LED, HFFU, and combinational LED and HFFU stimulation treatments.
Figure 1. The experimental models of the (a) LED, (b) HFFU and (c) combinational LED and HFFU treatment using HeLa cells.
LED experiment
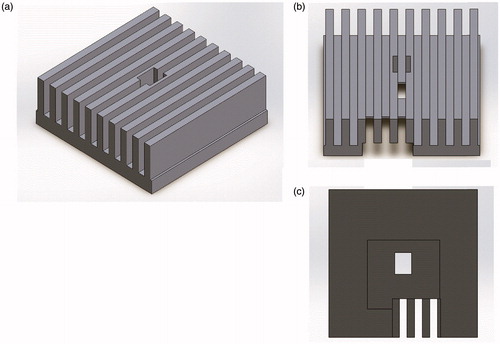
As shown in , a LED light (CBT-120 series, Luminus Devices, Sunnyvale, CA, USA) applied by 24 W power (12 V and 2 A) generated from a LED driver (DK-136 M-3, Luminus Devices, Sunnyvale, CA, USA) and power supply (PAS20-36, Kikusui Electronics Corp., Yokohama, Japan) were utilized to stimulate the Hela cells. The wavelengths of the red, green and blue LED lights are 622, 535, and 462 nm, respectively. The LED light is originally a divergent source compared to the laser, thus requiring special guidance to converge the light to the target cell. shows a LED focus guide fabricated by a 3 D printer (Cubicon 3DP-310 F, High Vision System, Seongnam, Korea) to reduce the temperature increment resulting from high power LED on the target area. This guide needs to be placed between the LED and HeLa cells. The light from the LED devices is transmitted through the top of the LED focus guide and the cooling fan is located under the LED devices. LED light stimulated the cell through 10, 20, or 30 min of daily irradiation. The stimulus-driven cell densities were measured using microscopic brightfield images to compare each group for three consecutive days. To avoid the effects of ambient light condition, all samples were completely wrapped up in aluminum foil.
Figure 2. Schematic design of (a) guide, (b) top and (c) bottom view of the guide.
HFFU experiment
As shown in , a 25 MHz, 438 mVp-p, and 20 cycle burst signal generated by an arbitrary function generator (AFG3252C, Tecktronics Inc., Beaverton, OR, USA) was amplified by a 50-dB power amplifier (75A250A, American Research Corp., Souderton, PA, USA). The amplified burst signals were transmitted into 25 MHz focused ultrasound transducer (V324, Olympus Corp., Tokyo, Japan) to generate the acoustic signals that were directly applied to the HeLa cells. The acoustic signal was exposed to the cells for 10, 20, and 30 min daily and the stimulus-driven cell densities were measured using microscopic brightfield images. To avoid cell contamination, the cells were completely wrapped with parafilm.
Combinational LED and HFFU experiment
As shown in , HeLa cell samples in a petri dish were placed between the LED and HFFU. The HFFU and LED exposure times for HeLa cells were the same as in the previous experimental setup.
Numerical analysis of cell density
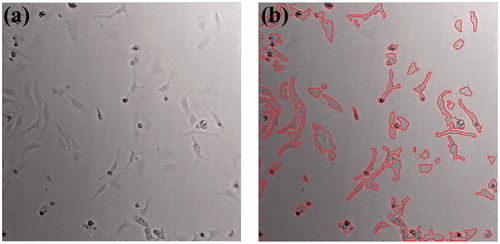
All brightfield images were acquired on an inverted microscope (Eclipse Ti-E, Nikon Instruments Inc., Tokyo, Japan). Image processing and statistical analysis were performed using MATLAB software (MathWorks, Natick, MA, USA) as done previously described [Citation20]. Briefly, all images were acquired over the same region of interests (ROIs) where each stimulus was applied. Adaptive thresholding and other image processing techniques were applied to segment and analyze the ROIs. shows example images used for quantitative analysis using (a) an acquired brightfield image by the imaging system and (b) post-processed image with red colored cell boundary using MATLAB software. Analysis of variance (ANOVA) with Scheffe’s post hoc test was applied to assess the differences between the control and experimental groups. P values of less than 0.05 were considered statistically significant.
Figure 3. Representative images of cell density calculation using (a) an acquired brightfield image and (b) cell boundary traced image using the MATLAB program. The boundary is marked by the red solid line.
Results and discussion
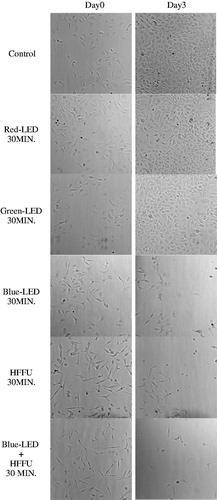
shows images of HeLa cells acquired on high-resolution inverted microscope to assess the cell densities between the groups exposed to red, green, and blue LED, HFFU only, and blue LED + HFFU for 30 min prior to the experiment and one day after the last stimulus (Day 0 and Day 3, respectively). Red and green LED stimuli did not critically affect HeLa cell viability (). However, blue LED alone and blue-LED + HFFU suppressed cell viability according to the cell density of each group. In addition, blue LED + HFFU demonstrated the reduced cell density up to 3 days post stimulus induction, compared to other experimental groups. Yoshida et al. [Citation21] demonstrated that blue LED can induce thermal effects in mitochondria which are time-dependent. Blue LED leads to cell death and inhibition of tumor cell growth [Citation22]. However, the mechanisms associated with the effects of blue LED irradiation in solid tumors and its signaling effects are unclear and is still under research [Citation22]. Briefly, LED and ultrasound induce thermal and mechanical effects [Citation22,Citation23].
Figure 4. The brightfield images acquired using an inverted microscope. From top, image of Hela cells without any stimulus as a control group, Red-LED 30 MIN group, Green-LED 30 MIN group, Blue-LED 30 MIN group, HFFU-30 MIN group, and Blue-LED + HFFU 30 MIN group represents the HeLa cell exposed by red, green, and blue LED lights only, HFFU only, and combined blue-LED + HFFU for 30 min, respectively.
Ultrasound therapy is usually targeted for cancer cell therapy in the deep area compared to photodynamic therapy [Citation12]. Ultrasound generates bio-effects resulting in cell death due to thermal and mechanical effects. For thermal effects, the absorption coefficients of the biological effect increases with frequency. At several MHz ranges, the thermal effects can be significant. However, low intensity and low-cycle operations typically cannot significantly contribute to the thermal effects on the cells. Acoustic cavitation describes the mechanical effects that are generated by ultrasound waves [Citation12]. The cavitation effect parameters are acoustic frequency, intensity and exposure time [Citation24]. Cavitation refers to the ultrasound wave effects on the growth and collapse of the gaseous cavities in a liquid medium such as water and blood [Citation24]. Especially for high frequency ultrasound waves, the cavitation in the tissues could be significant because threshold pressure increases with the frequency linearly [Citation25]. Moreover, the cavitation effects in high frequency may cause another thermal effect. The ultrasound dose related to the frequency, intensity, and duration is still under investigation and does not fully describe the beneficial effects [Citation26].
However, blue-LED and HFFU groups reduced the cell density to 9.72 ± 2.51% and 11.19 ± 2.51%, respectively. In addition, the cell density of the blue-LED + HFFU group decreased to 2.19 ± 0.58% and the differences in these three groups were statistically significant (p < 0.05). Therefore, blue LED light and combinational blue LED + HFFU stimulus is more effective than red and green LED light for HeLa cell treatment.
shows the selected experimental results from when the HeLa cell groups were exposed to all stimuli for 30 min on days 0 and 3. Interestingly, the blue-LED and HFFU only worked for HeLa cell treatment. However, treatment using blue-LED light combined with HFFU was the most effective therapeutic solution as a potential treatment. According to our results, blue-LED + HFFU inhibition of cancer cells outperformed compared to any other group. Therefore, in this study, blue LED + HFFU was most effective solution to treat HeLa cancer cells.
Figure 5. The experimental results of the cell density when using Red, Green and Blue LED lights. Control group of the HeLa cell is represented by black color. The HeLa cell groups when using red, green and blue LED light are represented by red, green and blue color bar, respectively. *p < 0.05.
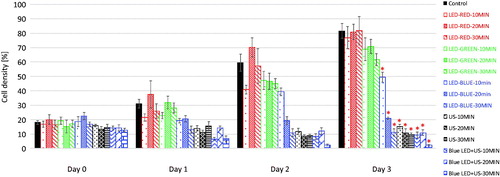
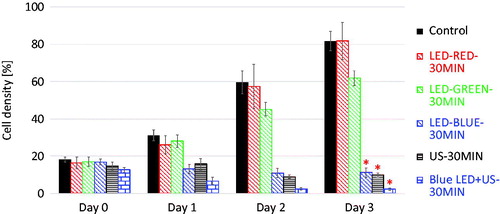
Figure 6. The selective experimental results of the cell densities when using red LED, green LED, blue LED and Blue LED + HFFU stimuli on each day. The black bar represents the control group of HeLa cells. *p < 0.05.
summarizes the numerical data of the experimental cell density results using red, green, and blue-LED, HFFU only, and blue-LED + HFFU at 30 min for three consecutive days. Red LED shows a similar cell viability of 81.71 ± 9.92% to the control group (not significant; p > 0.0.5). However, blue-LED, HFFU, and blue LED + HFFU showed cell viability of 9.72 ± 2.51%, 11.19 ± 2.51%, and 2.19 ± 0.58%, respectively.
Table 1. The numerical data of the experimental cell density results.
To our best knowledge, this is the first report of the design and performance of combinational LED and HFFU for cancer treatment. Therefore, furthermore experiments are needed to determine the mechanisms of combined LED and HFFU treatment, as well as to apply a feasibility study using real cancer tissues in the future.
Conclusion
The LED is a cost-effective and less harmful source, for generating thermal effects on small cells leading to necrosis and the inhibition of tumor cell growth. In addition, HFFU is regarded as part of a therapeutic protocol for cancer treatment to target small tumors compared to low frequency (<15 MHz) ultrasound treatment owing to its thermal and mechanical effects. Therefore, we performed a feasibility study of combinational LED and HFFU treatment on HeLa cells, well-known immortal cell line that is most commonly used in cancer research [Citation27]. HeLa cells were exposed by LED devices attached to a LED focus guide and HFFU during three consecutive days in order to characterize the response using cell viability. Red and green-LED shows the cell density of HeLa cell (81.71 ± 9.92 and 61.81 ± 4.09 respectively) on Day 3 so that the red and green-LED stimuli do not effectively suppress HeLa cell proliferation. However, blue-LED only, HFFU only, and blue-LED combined with HFFU treatments induced significantly reduced cell viability of 9.72 ± 1.04% and 2.19 ± 0.58%, respectively compared to the control, red, and green-LED stimuli. In conclusion, we have presented a potential therapeutic strategy of the first use of combinational treatment using blue-LED and HFFU. The experimental procedure can be performed with ease using our proposed protocol. In addition, this approach can provide meaningful information about the feasible therapeutic effects on solid tumors.
Disclosure statement
The authors have no conflict of interests to disclose.
Additional information
Funding
References
- Hochman B, Pinfildi CE, Nishioka MA, et al. Low-level laser therapy and light-emitting diode effects in the secretion of neuropeptides SP and CGRP in rat skin. Lasers Med Sci. 2014;29:1203–1208.
- Furlow B. Contrast-enhanced ultrasound. Radiol Technol. 2009;80:547S–561S.
- Takeuchi S, Udagawa Y, Oku Y, et al. Basic study on apoptosis induction into cancer cells U-937 and EL-4 by ultrasound exposure. Ultrasonics. 2006;44:e345–e348.
- Gigo‐Benato D, Geuna S, Rochkind S. Phototherapy for enhancing peripheral nerve repair: a review of the literature. Muscle Nerve. 2005;31:694–701.
- Lam RW, Kripke DF, Gillin JC. Phototherapy for depressive disorders: a review. Can J Psychiatry. 1989;34:140–147.
- Ben-Hur E, Rosenthal I. The phthalocyanines: a new class of mammalian cells photosensitizers with a potential for cancer phototherapy. Int J Radiat Biol Relat Stud Phys Chem Med. 1985;47:145–147.
- Hearn RMR, Kerr AC, Rahim K, et al. Incidence of skin cancers in 3867 patients treated with narrow‐band ultraviolet B phototherapy. Br J Dermatol. 2008;159:931–935.
- Dolmans DEJGJ, Fukumura D, Jain RK. Photodynamic therapy for cancer. Nat Rev Cancer. 2003;3:380–387.
- Whelan HT, Smits RL, Jr., Buchman EV, et al. Effect of NASA light-emitting diode irradiation on wound healing. J Clin Laser Med Surg. 2001;19:305–314.
- Schubert EF, Gessmann T, Kim JK. Light emitting diodes. Hoboken (NJ): Wiley Online Library; 2005.
- Niu L, Qian M, Yang W, et al. Surface roughness detection of arteries via texture analysis of ultrasound images for early diagnosis of atherosclerosis. Plos One. 2013;8:e76880.
- Wood AKW, Sehgal CM. A review of low-intensity ultrasound for cancer therapy. Ultrasound Med Biol. 2015;41:905–928.
- Beard P. Biomedical photoacoustic imaging. Interface Focus. 2011;1:602–631.
- Khokhlova TD, Haider Y, Hwang JH. Therapeutic potential of ultrasound microbubbles in gastrointestinal oncology: recent advances and future prospects. Therap Adv Gastroenterol. 2015;8:384–394.
- Szabo TL. Diagnostic ultrasound imaging: inside out. London (UK): Elsevier Academic Press; 2013.
- Yan F, Li X, Jin Q, et al. Therapeutic ultrasonic microbubbles carrying paclitaxel and LYP-1 peptide: preparation, characterization and application to ultrasound-assisted chemotherapy in breast cancer cells. Ultrasound Med Biol. 2011;37:768–779.
- Chen G-S, Lin C-Y, Jeong JS, et al. Design and characterization of dual-curvature 1.5-dimensional high-intensity focused ultrasound phased-array transducer. IEEE Trans Ultrason Ferroelectr Freq Control. 2012;59:150–155.
- Moon H, Yoon C, Lee TW, et al. Therapeutic ultrasound contrast agents for the enhancement of tumor diagnosis and tumor therapy. J Biomed Nanotechnol. 2015;11:1183–1192.
- Hwang JY, Lee C, Lam KH, et al. Cell membrane deformation induced by a fibronectin-coated polystyrene microbead in a 200-MHz acoustic trap. IEEE Trans Ultrason Ferroelect Freq Contr. 2014;61:399–406.
- Choe S-w, Terman DS, Rivers AE, et al. Drug-loaded sickle cells programmed ex vivo for delayed hemolysis target hypoxic tumor microvessels and augment tumor drug delivery. J Control Release. 2013;171:184–192.
- Yoshida A, Yoshino F, Makita T, et al. Reactive oxygen species production in mitochondria of human gingival fibroblast induced by blue light irradiation. J Photochem Photobiol B Biol. 2013;129:1–5.
- Oh P-S, Na KS, Hwang H, et al. Effect of blue light emitting diodes on melanoma cells: involvement of apoptotic signaling. J Photochem Photobiol B. 2015;142:197–203.
- Pasternak MM, Strohm EM, Berndl ES, et al. Properties of cells through life and death–an acoustic microscopy investigation. Cell Cycle. 2015;14:2891–2898.
- Shung KK, Thieme GA. Ultrasonic scattering in biological tissues. Boca Raton (FL): CRC press; 1992.
- Apfel RE, Holland CK. Gauging the likelihood of cavitation from short-pulse, low-duty cycle diagnostic ultrasound. Ultrasound Med Biol. 1991;17:179–185.
- Jang KW. The effect of low-intensity pulsed ultrasound on chondrocyte migration and its potential for the repair of articular cartilage [Thesis]. The University of Iowa; 2011.
- Rahbari R, Sheahan T, Modes V, et al. A novel L1 retrotransposon marker for HeLa cell line identification. Biotechniques. 2009;46:277.