
Abstract
Intravascular ultrasound (IVUS) imaging provides an excellent tool for evaluation of the type, morphology, extent, and severity of an atheromatous plaque. 3 D IVUS imaging offers additive information pertaining to morphology of the arterial structures and volumetric plaque distributions. A new 3 D IVUS visualization technique was developed to provide 3 D structural information of a curved artery. A virtual 3 D curved arterial phantom consisting of varying cross-sectional shapes, wall thicknesses, and acoustic intensity information was utilized to validate the nonlinear interpolation technique to create intermediary 2 D IVUS images. IVUS imaging was performed for the iliofemoral arterial segment of an atherosclerotic Yucatan miniswine model. These in-vivo IVUS data were utilized for intermediary IVUS image generation and volumetric 3 D IVUS visualization. Smooth transitional changes of cross-sectional shape, wall thickness and grayscale intensity were found between the intermediary images and the original arterial phantom slices. The 3 D IVUS imaging of the unfolded curved iliofemoral artery provided realistic 3 D luminal surface images of the arteries with physiologic grayscale intensity information. This unique 3 D IVUS imaging technique may help with assessment of 3 D plaque distribution across the curved arterial structure, and improve 3 D visualization of atheromatous components.
1. Introduction
Cardiovascular diseases occupy about 30% of all deaths in the world, and atherosclerosis is one of the major causes of the disease such as stroke and heart attack [Citation1]. Atheromatous plaques often cover large areas across the arterial structure as the disease diffuses throughout the arteries. Therefore, it is necessary to comprehensively evaluate the type, morphology, extent, and severity of atherosclerotic plaques [Citation2,Citation3]. Intravascular ultrasound (IVUS) imaging modality was used for 30 years to assist endovascular treatment [Citation4,Citation5], and provides an excellent tool for evaluation of acoustic backscatter information across the arterial structure, allowing to assess pathologic alteration of atherosclerotic plaques at the time of vascular intervention [Citation6–8]. Recent technical advances in IVUS imaging offer an effective determination of morphologic characteristics and composition information of normal and atheromatous tissue components within the arterial wall [Citation9].
Three-dimensional (3 D) IVUS can provide additive information pertaining to morphology of the arterial structures and volumetric plaque distributions compared to the standard 2 D IVUS imaging [Citation10]. Conventional 3 D IVUS imaging methods often demonstrate cut-view images of the arterial segment displaying acoustic intensity inside the arterial wall structure towards the longitudinal direction [Citation11]. However, this method simply provides two sets of another cross-sectional arterial images along the blood flow direction. An automatic computerized method to reconstruct 3 D vascular geometry using IVUS sequences was developed to avoid time-consuming and labor-intensive tasks for the clinicians [Citation12,Citation13]. However, there is no detailed IVUS backscatter information across the vascular wall in the developed techniques.
Recently, we developed a 3 D IVUS imaging algorithm to visualize both arterial geometry and grayscale intensity information [Citation10,Citation14]. In the volumetric 3 D IVUS visualization, 2 D intermediary image data were reconstructed by considering not only vascular structure geometry but also gray-level data. This 3 D IVUS visualization strategy to provide the arterial structure information as well as the acoustic intensity information within the arterial wall has the great potential to improve the determination of atheromatous plaques.
In the present study, we further improved our volumetric 3 D IVUS imaging algorithm to visualize unfolded arteries having complex curvature such as the iliofemoral artery. A 3 D curved arterial phantom was utilized to validate the 3 D IVUS algorithm and applied the technique to an iliofemoral artery of an atherosclerotic animal model.
2. Materials and methods
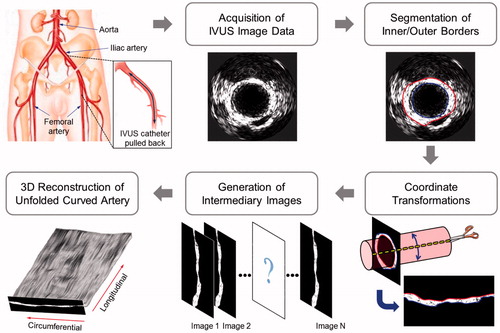
shows the 3 D IVUS reconstruction algorithm developed to convert a set of 2 D IVUS images of a curved artery in a sequential order into 3 D IVUS visualization of an unfolded artery. This image processing protocol includes multiple sub-modules for acquisition of IVUS image data, segmentation of the inside and outside arterial edges, coordinate transformations, generation of intermediary images, and 3 D reconstruction of the unfolded curved arterial geometry.
Figure 1. Volumetric 3 D IVUS reconstruction algorithm to visualize a curved artery.
2.1. Acquisition of IVUS image data and segmentation of the arterial borders
An atherosclerotic Yucatan pigs (25–30 kg, Sinclair Bio-Resources, Auxvasse, MO) was utilized to attain IVUS image data. The Institutional Animal Care and Use Committee of The University of Texas Health Science Center at Houston approved the animal protocol. The animal was anesthetized and the left iliofemoral artery was exposed via groin incision. An IVUS catheter (20 MHz, 3.5 F) was inserted to the iliofemoral arterial segment and pulled back slowly (0.5 mm/s). IVUS image data were collected through a clinical Volcano s5i IVUS system (Philips Healthcare, Andover, MA). Following completion of IVUS image data acquisition, the inside and outside edges in all the IVUS slice images were traced using a semi-automated segmentation algorithm.
2.2. Transformation of image coordinates and generation of intermediary images
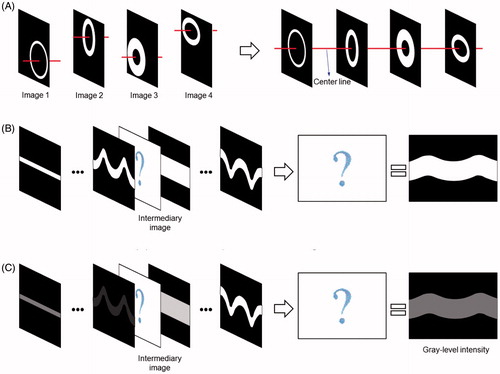
demonstrates schematics of the nonlinear interpolation algorithm to create intermediary unfolded IVUS images. This algorithm employs the arterial geometric data as well as the acoustic intensity data. The center of the outer arterial border was calculated in each IVUS slice, and a series of the segmented arterial images were aligned in tomographic sequence. Unfolded arterial images with respect to the longitudinal direction were created following the coordinate transformation from the Cartesian coordinate system to the polar coordinate system. A cubic spline interpolation technique was employed to create intermediary images between the original IVUS images. Both arterial geometric data and grayscale intensity (i.e., acoustic backscatter) data were implemented into the nonlinear interpolation process [Citation14]. First, the segmented arterial borders were utilized to interpolate the arterial geometry in the intermediary IVUS images. Next, grayscale intensity information between the inside and outside edges were imported to the nonlinear interpolation algorithm to calculate the grayscale intensity distribution in the arterial wall for each intermediary IVUS image.
Figure 2. Schematic diagram of the intermediary IVUS image generation algorithm.
2.3. Validation of the interpolation algorithm for intermediary IVUS image creation
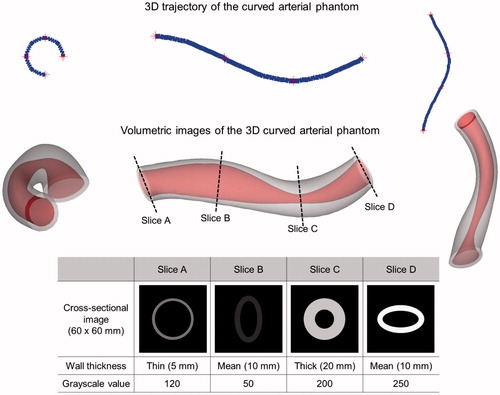
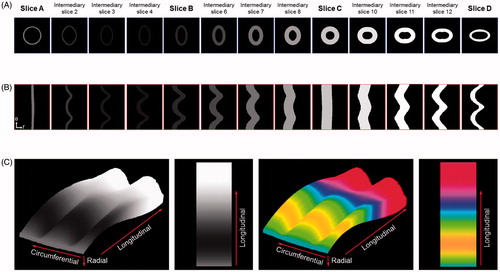
A virtual 3 D curved arterial phantom was utilized to validate the nonlinear interpolation technique to generate intermediary IVUS images (). This 3 D curved arterial phantom consisted of varying cross-sectional shapes, wall thicknesses and grayscale intensity values. Atherosclerotic plaque is generally shown in slightly darker gray color compared to the medial layer in IVUS imaging while plaque can be also displayed in highly bright gray color when targeted ultrasound contrast agents are utilized [Citation15]. Cross-sectional slices of the phantom at four different locations with different shapes and grayscale intensity values were utilized to create three intermediary images between a pair of the original 2 D IVUS images. Both cross-sectional geometry and acoustic intensity values of each intermediary image generated by the nonlinear interpolation were compared with the original 2 D IVUS images at the corresponding locations of the phantom.
Figure 3. A 3 D curved arterial phantom containing varying cross-sectional shapes, wall thicknesses and grayscale values.
2.4. Volumetric 3 D visualization of the unfolded curved iliofemoral artery
The original 2 D IVUS images (n = 13) of a porcine iliofemoral artery were collected in an inter-slice distance of 0.5 mm. For each pair of adjacent original IVUS slices, 20 intermediary unfolded IVUS images were generated, resulting in a total of 253 unfolded arterial images along the longitudinal direction. Image stocks containing these unfolded IVUS images were implemented to ImageJ (NIH-supported open-source imaging processing software) for visualization of 3 D IVUS imaging.
3. Results
3.1. Validation studies
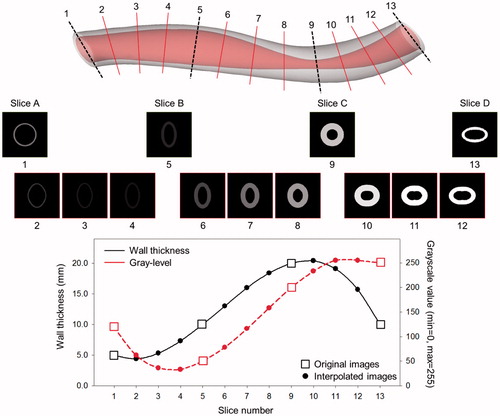
demonstrates the intermediary images created using the nonlinear interpolation technique and the changes in wall thickness and grayscale intensity value to compare with the original cross-sectional slices of the virtual 3 D curved arterial phantom. In order to facilitate assessing the transition of wall thicknesses and grayscale intensity values between the intermediary images across the longitudinal direction, each image was transformed from the polar coordinate system to the Cartesian coordinate system to display the images in the standard vascular imaging mode. Smooth transitional changes of cross-sectional shape, wall thickness, and acoustic intensity were found between the intermediary IVUS images and the cross-sectional images of the virtual arterial phantom. This validation study demonstrates that the nonlinear interpolation algorithm has been successfully implemented to generate intermediary IVUS images.
Figure 4. Validation studies using the 3 D curved arterial phantom displaying the changes in wall thickness and grayscale value.
3.2. 3 D visualization of the virtual arterial phantom and the porcine iliofemoral artery
The original cross-sectional slices of the curved arterial phantom and intermediary images generated using the nonlinear interpolation algorithm in the Cartesian and polar coordinate systems are demonstrated in . Volumetric 3 D visualization of the unfolded curved arterial phantom is displayed in . Volumetric visualization clearly demonstrated 3 D alterations of wall shape, wall thickness and grayscale intensity across both the circumferential and longitudinal directions.
Figure 5. Cross-sectional 2 D images and volumetric 3 D visualization of the unfolded curved arterial phantom (r: radial, θ: circumferential).
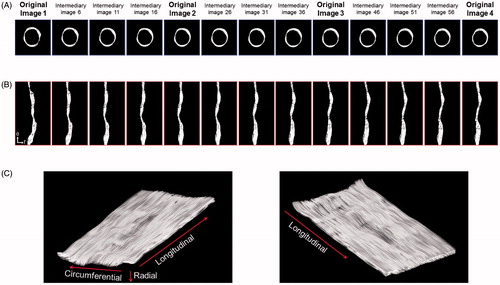
demonstrates the original 2 D IVUS images (image 1 to 4 out of the original 13 IVUS images) of the porcine iliofemoral artery and the nonlinear interpolation-based intermediary images in the Cartesian and polar coordinate systems. A smooth and realistic transition was identified in the intermediary images of the arterial segment. The 3 D visualization of the unfolded curved iliofemoral artery generated using 253 cross-sectional IVUS images provided realistic luminal surface images of the artery including the physiologic acoustic intensity information.
Figure 6. Intermediary IVUS image generation and volumetric 3 D IVUS visualization of the unfolded curved iliofemoral artery (r: radial, θ: circumferential).
4. Discussion
The primary interest in the past efforts to develop 3 D IVUS imaging techniques has been focused on precise detection of the arterial wall borders and visualization of 3 D realistic smooth surface reconstruction of the arterial borders [Citation16,Citation17]. In particular, 3 D luminal surface modeling of the coronary arteries using these 3 D IVUS techniques greatly benefitted identification of coronary blood flow dynamics combined with computational fluid dynamics (CFD) approaches [Citation18]. However, grayscale intensity information inside the arterial wall is often neglected in these 3 D IVUS imaging techniques while providing excellent 3 D surface rendering. Another standard 3 D IVUS visualization method is to demonstrate simple longitudinal cut-view images of the arteries. This method provides detailed acoustic intensity distribution inside the arterial wall in the blood flow direction [Citation11]. but comprehensive visualization of 3 D spatial plaque distribution is not available.
3 D IVUS reconstruction proposed in this study will be incorporated with image registration for intra-operative navigation of internal artery. The 3 D geometric structure of vessel wall may not only facilitate percutaneous interventions in complex anatomy but allow to identify a detailed in-vivo hemodynamic information [Citation19,Citation20]. The previous pathological studies have demonstrated that hemodynamic profiles have important roles in growth, remodeling and destabilization of atheromatous plaque [Citation21,Citation22]. In addition, the monitoring of a vascular response following the stent implantation is a potentially important [Citation23]. These upcoming techniques will be realized incorporating the 3 D IVUS reconstruction technique based on this study
There are several limitations in this study. Inherent inaccuracies can be involved during the semi-automated segmentation of the arterial borders in 2 D IVUS images, which can affect 3 D IVUS visualization of the arteries. Exact curvatures of the arterial structure cannot be obtained from IVUS alone. Angiography or computed tomography (CT) can be combined with IVUS imaging to provide accurate arterial curvature information.
A unique 3 D IVUS imaging technique has been developed to visualize the unfolded curved iliofemoral artery, allowing to demonstrate realistic luminal surface morphology and provide physiologic grayscale intensity information across the curved arterial structure. The 3 D IVUS imaging technique developed in this study may help with assessment of 3 D plaque distribution across the curved arterial structure, and improve 3 D ultrasound molecular imaging of atheroma components.
Disclosure statement
No potential conflict of interest was reported by the author(s).
Additional information
Funding
References
- Frostegard J. SLE, atherosclerosis and cardiovascular disease. J Intern Med. 2005;257:485–495.
- Bors AG, Kechagias L, Pitas I. Binary morphological shape-based interpolation applied to 3-D tooth reconstruction. IEEE Trans Med Imaging. 2002;21:100–108.
- Guedes A, Keller PF, L’Allier PL, et al. Long-term safety of intravascular ultrasound in nontransplant, nonintervened, atherosclerotic coronary arteries. J Am Coll Cardiol. 2005;45:559–564.
- Klingensmith JD, Shekhar R, Vince DG. Evaluation of three-dimensional segmentation algorithms for the identification of luminal and medial-adventitial borders in intravascular ultrasound images. IEEE Trans Med Imaging. 2000;19:996–1011.
- Lee JT, White RA. Basics of intravascular ultrasound: an essential tool for the endovascular surgeon. Semin Vasc Surg. 2004;17:110–118.
- Goertz DE, Frijlink ME, Krams R, et al. Vasa vasorum and molecular imaging of atherosclerotic plaques using nonlinear contrast intravascular ultrasound. Nhjl. 2007;15:77–80.
- Mintz GS, Nissen SE, Anderson WD, et al. American College of Cardiology Clinical Expert Consensus Document on Standards for Acquisition, Measurement and Reporting of Intravascular Ultrasound Studies (IVUS). A report of the American College of Cardiology Task Force on Clinical Expert Consensus Documents. J Am Coll Cardiol. 2001;37:1478–1492.
- Nissen SE, Yock P. Intravascular ultrasound: novel pathophysiological insights and current clinical applications. Circulation. 2001;103:604–616.
- Lee RT, Loree HM, Cheng GC, et al. Computational structural analysis based on intravascular ultrasound imaging before in vitro angioplasty: prediction of plaque fracture locations. J Am Coll Cardiol. 1993;21:777–782.
- Kim H, Kee PH, Rim Y, et al. Nitric oxide improves molecular imaging of inflammatory atheroma using targeted echogenic immunoliposomes. Atherosclerosis. 2013;231:252–260.
- Prati F, Arbustini E, Labellarte A, et al. Eccentric atherosclerotic plaques with positive remodelling have a pericardial distribution: a permissive role of epicardial fat? A three-dimensional intravascular ultrasound study of left anterior descending artery lesions. Eur Heart J. 2003;24:329–336.
- Cardinal MH, Soulez G, Tardif JC, et al. Fast-marching segmentation of three-dimensional intravascular ultrasound images: a pre- and post-intervention study. Med Phys. 2010;37:3633–3647.
- Sanz R, Bodi V, Sanchis J, et al. Development of software for three-dimensional reconstruction and automatic quantification of intravascular ultrasound images. Initial experience. Rev Esp Cardiol. 2006;59:879–888.
- Rim Y, McPherson DD, Kim H. Volumetric three-dimensional intravascular ultrasound visualization using shape-based nonlinear interpolation. Biomed Eng Online. 2013;12:39.
- Kim H, Moody MR, Laing ST, et al. In vivo volumetric intravascular ultrasound visualization of early/inflammatory arterial atheroma using targeted echogenic immunoliposomes. Invest Radiol. 2010;45:685–691.
- Cardinal MH, Meunier J, Soulez G, et al. Intravascular ultrasound image segmentation: a three-dimensional fast-marching method based on gray level distributions. IEEE Trans Med Imaging. 2006;25:590–601.
- Sanz-Requena R, Moratal D, Garcia-Sanchez DR, et al. Automatic segmentation and 3D reconstruction of intravascular ultrasound images for a fast preliminar evaluation of vessel pathologies. Comput Med Imaging Graph. 2007;31:71–80.
- Ramaswamy SD, Vigmostad SC, Wahle A, et al. Comparison of left anterior descending coronary artery hemodynamics before and after angioplasty. J Biomech Eng. 2006;128:40–48.
- Feldman CL, Ilegbusi OJ, Hu Z, et al. Determination of in vivo velocity and endothelial shear stress patterns with phasic flow in human coronary arteries: a methodology to predict progression of coronary atherosclerosis. Am Heart J. 2002;143:931–939.
- Stone PH, Coskun AU, Kinlay S, et al. Effect of endothelial shear stress on the progression of coronary artery disease, vascular remodeling, and in-stent restenosis in humans: in vivo 6-month follow-up study. Circulation. 2003;108:438–444.
- Gibson CM, Diaz L, Kandarpa K, et al. Relation of vessel wall shear stress to atherosclerosis progression in human coronary arteries. Arterioscler Thromb. 1993;13:310–315.
- Stone PH, Coskun AU, Yeghiazarians Y, et al. Prediction of sites of coronary atherosclerosis progression: In vivo profiling of endothelial shear stress, lumen, and outer vessel wall characteristics to predict vascular behavior. Curr Opin Cardiol. 2003;18:458–470.
- Honda Y, Fitzgerald PJ. Frontiers in intravascular imaging technologies. Circulation. 2008;117:2024–2037.