
Abstract
Traditional dysphagia prescreening diagnostic methods require doctors specialists to give patients a total score based on a water swallow test scale. This method is limited by the high dimensionality of the diagnostic elements in the water swallow test scale with heavy workload (Towards each patient, the scale requires the doctors give score for 18 diagnostic elements respectively) as well as the difficulties of extracting and using the diagnostic scale data’s non-linear features and hidden expertise information (Even with the scale scores, specific diagnostic conclusions are still given by expert doctors under the expertise). In this paper, a hybrid classifier model based on Nonlinear-Principal Component Analysis (NPCA) and Deep Belief Networks (DBN) is proposed in order to effectively extract the diagnostic scale data’s nonlinear features and hidden information and to provide the key scale elements’ locating methods towards the diagnostic results (The key scale elements that affect different diagnostic conclusions are given to improve the efficiency and pertinence of diagnosis and reduce the workload of diagnosis). We demonstrate the effectiveness of the proposed method using the frame of ‘information entropy theory’. Real dysphagia diagnosis examples from the China-Japanese Friendship Hospital are used to demonstrate applications of the proposed methods. The examples show satisfactory results compared to the traditional classifier.
1. Introduction
Dysphagia has been found to be the most common sequela of stroke [Citation1,Citation2].
Video fluoroscopy and swallow examination (VFSS) evaluating swallowing function, fiberoptic endoscopic evaluation of swallowing (FEES) are the ‘Gold standard’ for swallowing function test. However, the 'gold standard' test is often difficult to complete because the patient is uncooperative or in a coma. Typically, doctors give prescreening diagnostic results based on patients’ water swallow test scale scores, which consist of examinations of the feeding process and dysfunction assessments including laryngeal functions (sounding occasion, sounding quality, tune), respiratory functions (breathing times, the ratio of fast to slow breathing), zygomatic reflexes (normal and abnormal zygomatic movements), facial examinations (if the patient’s face is symmetrical or paralyzed), and tongue function (degree of flexibility) [Citation3,Citation4]. However, there is an increasing need to improve the accuracy of diagnostic tests, due to challenges including difficulties in evaluating dysfunction (for example, doctors cannot execute the sophageal television lens examination for patients with severe stroke) [Citation5]. shows the anatomical structures of dysphagia, and shows the 18 diagnosis items of the water swallow test scale proposed by DG Smithard et al. at the South University of Manchester Hospital [Citation2,Citation6–9].
Figure 1. Anatomical structures of dysphagia.
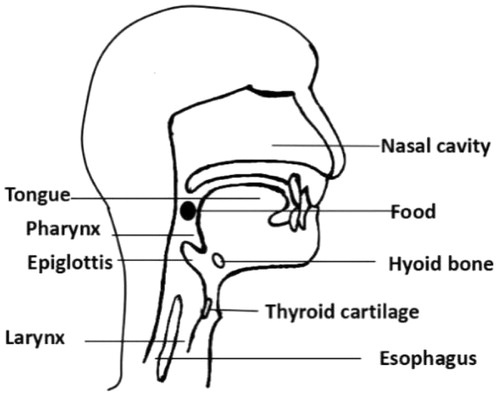
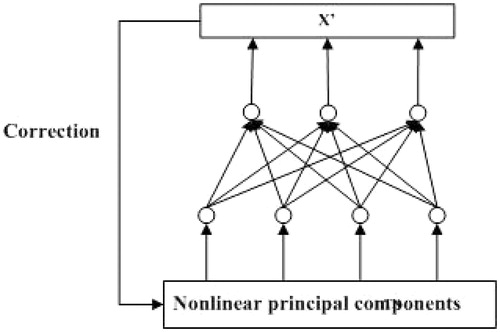
Figure 2. Structure of data dimension reductions.
Water swallow test scale diagnostic elements reveal multiple dimensions and nonlinear features; therefore, it is difficult to quantify and utilize qualitative information, like physician expertise, which is an integral aspect of diagnosis [Citation10,Citation11]. Research on intelligent diagnostics for dysphagia has not been widely published; however, artificial intelligence used in other areas of medicine can be applied to the study of intelligent dysphagia diagnosis. Artificial intelligence methods have shown good applicability to pattern recognition issues with uncertainty models [Citation12–14] and complex data [Citation15,Citation16]. Presently, a number of intelligent approaches including expert systems, artificial neural networks, and genetic algorithms are used in medical diagnosing and treatment [Citation17]. For example, a fuzzy method was built for tremor assessment, prediction, and rehabilitation [Citation18], a reasoning method was employed to construct medical expert systems [Citation19], and a new heart disease diagnosis expert system has been established [Citation20]. Many reviews have studied [Citation20–24] dysphagia diagnostic classification networks. For example, Oral and pharyngeal phases of the swallowing mechanism often leads to aspiration. Two sets of networks were developed, one for the oral called the oral classifier, and the other one for the pharyngeal phase [Citation20]. Prabhu et al. [Citation21] studied the acceleration signal during swallowing was filtered and segmented. The parameters extracted from the signal were used to develop and train two sets of Neural Network models. The first Neural Network model was developed an ANN model to differentiate between the acceleration signals of normal, dysphagic and coughing, and then, designed another ANN model to differentiate between acceleration during swallowing in normal, mild dysphagic, moderate dysphagic and severe dysphagic subjects. Lee et al. [Citation22] studied 100 children with neurologically-based dysphagia using a single-axis accelerometer. And extracted five potentially discriminatory mathematical features from the accelerometry signals based on radial basis function classifiers. Cola et al. [Citation24] investigated the influence of stimuli, such as taste (i.e. natural, cold, sour, and sourcold) and temperature based on the ANN (Artificial Neural Network) methods. However, The above-mentioned methods are limited to shallow layer learning, which does not take full advantage of the diagnostic experiences of experts, and traditional dysphagia diagnostic classifiers are not able to locate key water swallow test scale item elements.
Common classification methods such as clustering, support vector machine (SVM), and neural networks are shallow. The traditional clustering methods for high dimensional data have more difficulty finding the cluster centers than low dimensional data clustering, because the data distribution is more sparse, and the distance between each of the data points might be quite large [Citation25]. SVM is a supervised learning algorithm with certain advantages in terms of small sample classification; however, this method is very reliant on the sample data scale and is very complex in terms of algorithm classifying. Additionally, the SVM’s kernel function selection determines the classification accuracy and convergence speed [Citation26]. Due to the lack of pre-training, the neural network cannot mine implicit information [Citation27]. The deep learning technique consists of two phases: the unsupervised pre-training and the supervised back-propagation, which are beneficial for mining the latent relationship [Citation28]. Deep learning methods involve three main models: automatic encoders, convolution neural networks, and deep belief networks [Citation29]. Recently, deep learning techniques have attracted increasing attention in the field of machine learning, inspiring successful application in multiple fields. The deep belief network differs from other deep learning models. It is hierarchically built by stacking a series of restricted Boltzmann machines (RBMs). The supervised back-propagation algorithm can be used to obtain weights after the unsupervised pre-training phase [Citation30]. Li applied a variety of well-trained deep belief network (DBN) models in order to predict the risk of bone disease development [Citation31]. Shang proposed a kind of soft sensor based on deep belief networks in a crude distillation unit (CDU) [Citation32]. In addition, deep learning methods are most widely used in the field of voice and image recognition with the improved DBN towards the different objectives. For example, a CTC-DBN (connectionist temporal classification-DBN) [Citation33] was proposed to recognize the key speech information on the telephone where the new DBN is applicable to the real-time dynamic classification. And the CRF-DBN (Conditional random field-DBN) [Citation34] is designed to deal with the information recognition of the context. Through literature researches, we found that all the improved DBNs are designed for the specific objective models with out applications in the diagnosis of dysphiga. Therefore, it is conceivable that the deep belief network is suitable for constructing a model of dysphagia diagnosis classifications.
Additionally, given current dysphagia diagnostic classifications, it remains difficult to locate key scale item elements in the presence of high dimensional and nonlinear features associated with the water swallow test scale scores. As the most popular approaches for obtaining variable correlations, the variance filter and principal component analysis (PCA) are able to reduce data dimensions [Citation35,Citation36]. However, this demonstrates the limitations of obtaining nonlinear data information. In contrast, nonlinear PCA approaches have found been applied successfully in the field of nonlinear feature extractions. Li used the input-training network to build a nonlinear PCA framework [Citation37]. Niu combined the Radial Basis Function (RBF) with PCA to reduce modeling errors [Citation38]. Subsequently, it was found that nonlinear PCA plays an important role in fault detection of for process industries [Citation39–42]. It is conceivable that nonlinear PCA methods are eligible for both dimension reductions and nonlinear feature extractions in order to address dysphagia diagnostic data, which could further contribute to the location of key water swallow test scale item elements associated with diagnostic results.
In this work, we first built a diagnostic data dimension reduction structure that combines nonlinear PCA (NPCA) and IT-NN (Input training neural network). We then create a novel classifier based on deep brief networks to improve the effectiveness of dysphagia diagnostic results. We can use NPCA to locate the key water swallow test scale item elements associated with diagnostic results.
The remainder of this article is organized as follows. Section 2 presents the modeling steps for the novel hybrid classifier based on NPCA and DBN. In Section 3, we introduce the dysphagia diagnosis method based on the classifier along with an approach to locate the key item elements in the water swallow test scale. Section 4 provides a dysphagia diagnosis case study to demonstrate the effectiveness of the proposed approaches. Section 5 provides a conclusion and suggests future areas of research.
2. The hybrid classifier
Because the CNN (Convolutional Neural Network) is rarely used to build the model of process data, DBN is more effective to recognize the information in the process data like medical diagnosis problem without strong dynamic and real-time demand there is no dynamic demand strong.
Conventional DBN methods demand large amounts of training data in order to achieve excellent modeling performances. However, in the medical diagnosis field, it is difficult to obtain a large number of diagnostic cases. In the following section, we detail the modeling methods of a novel hybrid classifier based on NPCA and DBN. First, NPCA is used to reduce data dimensions and extract the nonlinear features of the data. Then, the reduced-dimensional data are used to generate the inputs and outputs of the DBN model. Lastly, we introduce a method to locate the key input variables in terms of influencing the model output.
2.1. Data dimension reductions
Linear PCA identifies linear correlations between process variables, whereas the objective of nonlinear PCA is to extract both the latent linear and nonlinear correlations, as described below:
(1)
where, X is the original sampling data, TN = [t1, t2,…,tk] is the matrix of nonlinear principal component scores, E is the matrix of residuals, X′ is the estimated value of X, and F(*) is the nonlinear function expressed by an input-training neural network (IT-NN) [Citation37]. Here, IT-NN is used to re-construct low-dimensional diagnostic data. shows the structure of the data dimension reduction.
Specifically, to train the network, the following goal function must be optimized:
(2)
where, gradient optimization algorithms can be used to achieve the minimum value of J.
2.2. Classifier modeling
DBN techniques [Citation39] are employed to construct the hybrid classifier model, whose inputs are specified by the principal component score vector TN. The modeling procedure to establish the hybrid classifier is described in the following section.
(1) Basics of RBM
Based on traditional Boltzmann machines, the restricted Boltzmann machine (RBM) is extended with stratified limits, as well as a binary chart that consists of visual layers and hidden layers. Outputs of the hidden layer correspond to the internal features of data, which can maximize the probability of a specific kind of distribution.
First, we introduce basic energy-based models, in which each configuration of variables is assigned to a scalar value of energy. Let ν denote the input vector of the RBM (visible layers), then the probability of distribution through an energy function can be defined as:
(3)
where, Z=∑Vexp{Energy(v)} is the normalizing factor. A lower energy is preferred to maximize the probability P(v). By introducing a vector of the hidden layer h, the RBM framework is formulated as follows [Citation42]:
(4)
The RBM energy function can be simplified as a second-order polynomial [Citation42]
(5)
where ν and h are both vectors of binary values (0 or 1) and W, b, and c are parameters of the energy function. Because of this, they are referred to as binary RBMs, which are most frequently used in practical applications.
However, binary RBMs can only process discrete inputs. In order to tackle continuous-valued inputs, binary RBMs can be extended to Gaussian RBMs as follows [Citation40]:
(6)
where αi and σi are the mean and the standard deviation of the Gaussian distribution for the visible unit i. Here, the input layer v is continuous-valued and the hidden layer h is binary. In EquationEq. (4)
(4) , θ = {W, b, c}, αi, and i are parameters to be estimated in the training procedure.
Therefore, it is reasonable to set the training objective of RBM as maximizing P(v) which is the probability of the model simply based on the training input data. The optimization is typically performed by a state-of-the-art gradient descent. Using EquationEq. (2)(2) and the total probability formula, the gradient of the log-likelihood function at a single data point v is calculated as follows:
(7)
where, θ = {W, b, c}. Two terms in EquationEq. (6)
(6) are interpreted such that the positive term represents the conditional expectation of ∂[−Energy(v, h)]/∂ the given visible units v, and the negative term represents the expectation of ∂[−Energy(v, h)]/∂ the joint distribution P(v, h) with parameter θ. Note that ∂[−Energy(v, h)]/∂ is easy to compute, which makes the positive term available with P(h|v). However, for RBMs with numerous units, computations of the negative term through sampling become very difficult [Citation42].
(2) The improved DBN structures
As mentioned in Section 2, we can stack a series of RBMs to construct a DBN. The hidden layer in an RBM can suggest underlying features behind the input data. The hidden layers of high-level RBMs represent high-level features because high-level RBMs are established based on low-level features from the hidden layer of low-level RBMs. Therefore, DBN can be regarded as a latent variable model with the inner layer representing low-level features and output amounting to high-level features. And the nodes are full linked. The framework of the novel DBN is shown in [Citation42].
Figure 3. The framework of the novel DBN.
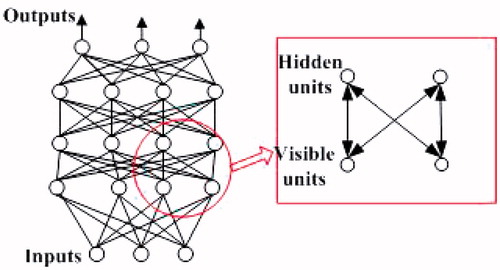
The traditional DBN [Citation32] proposed by Hinton consists of restricted Boltzmann machines, where each restricted Boltzmann machine is designed as a node of the network connecting between layers of nodes, as well, the nodes in the layer is not connected [Citation32]. From , we can see that the novel DBN is different from the traditional DBN.
The DBN output is characterized as follows:
(8)
where, S(·) is a nonlinear function to be approximated by the deep learning neural network, E refers to the error.
(3) Location of contributions
For linear PCA, the Q and T2 statistics must be modified to calculate the contributions of the original process variables. While in nonlinear PCA, the T2 statistic is changed due to the nonlinear information. Because the first-order partial derivative of the output results in the change of input variables, we can obtain the following formula:
(9)
where, Y indicates the output of the DBN, Xi indicates the input variables, and i is the number of variables. The relationship between Y and X is represented by EquationEqs. (8)
(8) and Equation(1)
(1) . Therefore, we obtain the following relationship:
(10)
where, ∂Y∂TN is the first-order partial derivative function between output Y and nonlinear principle components TN, and the relationship between Y and TN is shown in EquationEq. (8)
(8) in the classification stage,
is the first-order partial derivative function between TN and Xi, and the relationship is represented in EquationEq. (1)
(1) in the dimension reduction stage, the nonlinear functions H(·) and F(·) are modified by the neural networks.
Thereafter, the contribution K|xi is adopted to represent the contribution in order to locate the key input variables that influence the DBN’s outputs.
3. Complexity analysis of improved DBN
A complexity analysis is shown below, in order to demonstrate the advantages of the improved DBN in terms of network structure and algorithm complexity:
(1) The structural complexity of the improved DBN
In 1958, Shannon proposed the concept of information entropy, which describes the uncertainty of information sources. When researchers seek to improve the generalization ability, they use an approach to control the ‘effective complexity’ of the network by regularization (penalty function) [Citation42]. Deco introduced a method to give equivalent ‘effective complexity’ of a network by constructing a regular function based on mutual information entropy [Citation43]. Therefore, by computing the hidden layer’s information entropy, which can reflect the structure of the network, we can demonstrate the network structure’s advantages under the proposed method. The mutual information entropy between the input layer and the hidden layer is defined as:
(12)
where, P is the number of input samples, and Q is the nodes’ number of hidden layers, and djl corresponds to the normalized output from the lth samples to the first jth hidden units.
Theorem 1: Assume that there are two DBNs (net1 and net2) that have the same information feature. If the two DBNs have the same ‘effective complexity’ (Hnet1 = Hnet2) when their network input layer nodes’ number meet Pnet1 < Pnet2, then the total hidden layer nodes’ number meet Qnet1 < Qnet2.
Proof:
Assume the mutual information entropy function of the first DBN network (net1) is minimized, and the first RBMs’ layer in net1 fully reflects the mutual information of the input layer and the hidden layer. Based on the principle of information entropy, we can obtain [Citation24]:
(13)
where, Q1 represents the number of nodes in the first layer of the hidden layer. Based on Equationequations (12)(12) and Equation(13)
(13) , we have:
(14)
According to the principle of DBN, the improved DBN (net2) proposed in this paper can make each RBM completely reconstruct the input variables, therefore, the net2 should minimize all of the mutual information entropy. The improved mutual information entropy H′ is described as:
(15)
Further, net2’s NPCA has completely extracted the sample features; therefore, net2’s first layer of RBMs can map the hidden layer to the original sample information. Then, we have:
(16)
Thereafter, if we use two DBNs (net1 and net2) of the same network structure to reconstruct the same sample data, the ‘effective complexity’ should be equal (H=H′). If P′≤P, then Q1′≤Q1. Similarly, the number of RBM nodes in the subsequent hidden layer also follows this rule. We have:
Qnet2=Q1′+Q2′+⋯Qn′≤Qnet1=Q1+Q2+⋯Qn
(n is the total number of hidden layers of the network).
Therefore, the total number of the improved DBN’s node meet Snet1 < Snet2.
(2) The time and space complexity analysis of the improved DBN
As a computer science technique, analysis of an algorithm’s complexity typically assesses the costs associated with time and space complexity [Citation44]. To address this, we briefly present the complexity analysis of the effective learning algorithms as follows.
Theorem 2: Assume there is a DBN network (net1) containing n hidden layers where the total node number of the hidden layers is [h1, h2…hn]. Therefore, there must be a class of DBN (net2) under the nonlinear feature extraction mechanism based on the ITNN neural network (assuming that the nonlinear feature extraction mechanism can effectively ensure the equivalent of samples’ mutual information entropy). When the total node number of the improved DBN (net2) hidden layers is reduced to [h′1, h′2…h′n] and the total node number of ITNN neural network’s hidden layer nodes is h0, which satisfies h0 < β. We have: the time complexity of the improved DBN is less than the original DBN, which is described as:
Proof:
1. The pseudo-code of the traditional DBN algorithm is as follows:

Therefore, the time complexity of DBN is .
2. The improved NPCA-DBN algorithm pseudo-code is as follows:
Therefore, the time complexity of the improved DBN is .
Additionally, because the improved DBN reduces the number of hidden layer nodes in the original DBN, it can effectively reduce space complexity.
4. Dysphagia diagnosis based on the improved DBN
Based on the proposed hybrid classifier, we establish the dysphagia diagnostic method. Then, according to the dysphagia diagnostic results, the key water swallow test scale item elements are determined, which can help make the treatment process more effective.
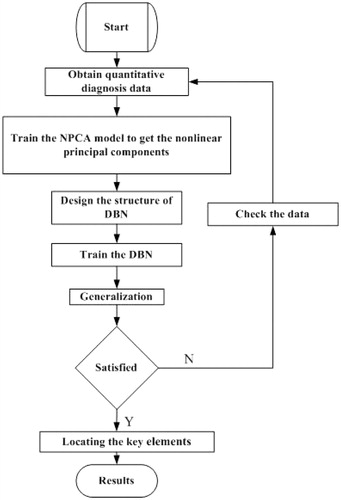
The digital description method of water swallow test scale elements is carried out before the dysphagia diagnostic approaches are presented based on the proposed hybrid classifier model. Then a detailed description is given of the key elements of the water swallow test scale locating process based diagnostic results. The flow chart of the dysphagia diagnostic process is shown in .
Figure 4. The flow chart of the dysphagia diagnostic process. Details of the key steps for dysphagia diagnosis are described as follows.
4.1. Digitalization of the water swallow test scale item elements
The digitalizing description of 15 diagnostic results (mouth period (I), tongue period (II), throat period (III), pharynx period (IV), and syndromes with a combination of the four conditions above [Citation42]) is shown in .
Table 1. Diagnostic items for water swallow test scales.
Table 2. The digitalized diagnostic results.
4.2. Diagnostic classifications
Unsupervised learning, based on the proposed classifier, is used to learn the diagnostic data data features. Considering 150 historic diagnostic data points as X’, the principal component scores vector TN (EquationEq. (1)(1) ) is specified as the input of the DBN model, which is trained to obtain the diagnostic classification model.
According to , if the DBN’s output is 0.8, then we can conclude that the patient is suffering from the a mix of Mouth, Tongue, and Throat periods (I/II/IV). If the DBN’s output is 0.139, the patient may be experiencing a Tongue period (as the output is close to II (0.133)).
4.3. Key scale element locations
Locating the key water swallow test scale elements is important for ensuring accurate treatment. According to EquationEq. (10)(10) , we can obtain the key water swallow test scale elements’ contribution to the diagnostic results, which can help doctors formulate treatment plans.
Consider that the historic dysphagia diagnosis cases X = [X1, X2, X3….X18] are specified as the inputs of the DBN. The DBN output Y corresponds to the classification result. The contribution of the key water swallow test scale element is termed as K|Xi in EquationEq. (10)(10) . In this paper, we define the contribution score limits as 80%. The input variable whose contribution is over the limit is recognized as the key element of the diagnosis.
5. Case studies
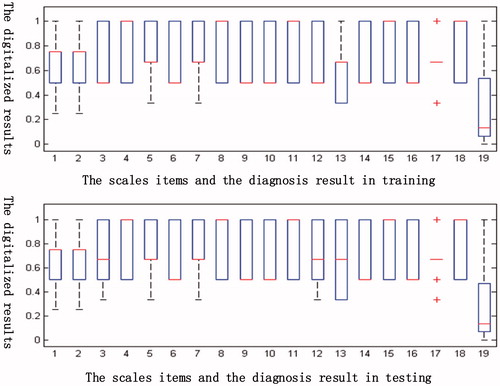
In this section, 180 cases collected by the Department of Physical Rehabilitation in China-Japanese Friendship Hospital were employed to verify the proposed methods. 150 of the cases were used to train the dysphagia diagnostic classifier, while the other 30 cases were used as test data. The boxplots of the DBN input variables and the outputs that were created for the training and generalizing case data are listed in . The training data and the testing data share the same general characteristics, which enhances the availability of the data. We summarize the key water swallow test scale diagnostic item elements’ contributions for all types of dysphagia diagnostic results. Finally, the validation of the diagnostic model and key scale elements’ location results are verified by experts using statistical approaches.
The abscissa in the represents the boxplots’ statistical distribution of eighteen diagnostic scale items and the diagnostic results in the training group (150 patients) and the testing group (30 patients) [Citation45]. In addition, the ordinates corresponds the normalized results of the eighteen diagnostic scale items and the diagnostic results. We can see that the distribution of the testing group data is approximately the same as that of the training samples. Therefore, it justifies that the sample used for survey is representative.
Figure 5. Comparisons of the boxplots of 19 items for the training data and test data.
The eighteen patients’ water swallow test scale item elements can be converted to fall between 0 and 1, as seen in .
Table 3. Digital diagnostic elements in water swallow test scales.
5.1. Dysphagia diagnosis
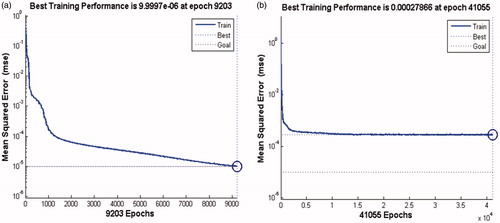
The proposed NPCA-DBN hybrid classifier was used to diagnose the dysphagia cases. The NPCA based data dimension reducer converted the 18 original water swallow test scale diagnostic item elements into 10 principal components before DBN is trained to obtain the dysphagia diagnostic model. and show comparisons in terms of training performance and ability to generalize between the proposed hybrid classifier and the traditional DBN model.
Figure 6. Comparisons in terms of training performance between the proposed hybrid classifier and the traditional DBN mode ((a): the training performance of the hybrid classifer. (b): the training performance of the traditional classifer).
From the , we can see that there are three cases (10th, 15th, 23rd) with big deviation of the diagnostic results by the improved DBN proposed in this paper, as well, there are six cases (9th, 10th, 12th, 15th, 22th, 28th) with the error diagnostic results. Furthermore, the accuracy of the proposed DBN is higher than that of the traditional methods
Table 4. Comparisons in terms of ability to generalize between the proposed hybrid classifier and the traditional DBN model.
presents the diagnostic accuracies of the proposed NPCA-DBN classifier and the traditional classifiers.
From , we found that the diagnostic accuracy of the proposed NPCA-DBN classifier is higher than the other the traditional classifiers. Firstly, PLS is suitable to deal with the linear classifying problems. Then, SVM showed better performance than the traditional DBN when the sample data is small. However, the structure of SVM is more complex when the sample data is larger, as well, the computational complexity increases with the number of training samples becomes exponentially.
Table 5. Comparisons of diagnostic accuracy.
From we can see that the maximum relative errors of the proposed classifier and the traditional DBN are 10.621 and 3.241, respectively.
Table 6. Diagnostic relative errors.
5.2. Locations of key elements
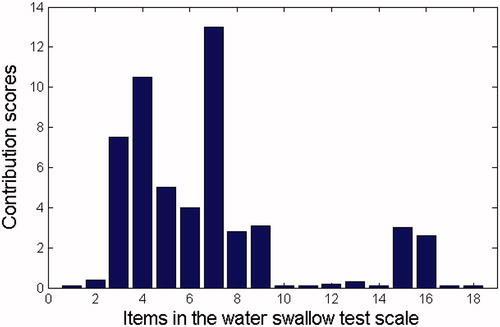
Based on EquationEq. (10)(10) , contributions of the 18 original water swallow test scale diagnostic item elements are used to represent the diagnostic results. shows that the contributions of the 4th, 6th, and 10th water swallow test scale items (lip closure, judgment of laryngeal function, and the laryngeal movement in the first feed water stage) in the 5th generalization case (whose diagnostic results are mouth period, tongue period, and pharynx period) are the highest. Therefore, we can conclude that the laryngeal movement in the first feed water stage is the key factor of the diagnostic results. shows that contribution of the 4th and 7th water swallow test scale item (lip closure and the pharyngeal reflex) in the 25th generalization sample (whose diagnostic result is tongue period and pharynx period) is the highest. Similarly, we can conclude that the ‘pharyngeal reflex’ is the key factor of the diagnostic results.
Figure 7. Contributions of the water swallow test scale item factor in the 5th case.
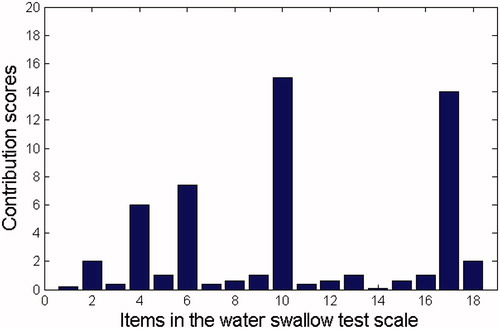
Figure 8. Contributions of the water swallow test scale item factor in the 25th case.
Using the statistical results of the diagnostic cases, key element locations towards different diagnosis classification results are listed in .
Table 7. Locating results.
The key scale elements locating conclusions (marked as with a ‘√’) differ according to the diagnosis results, which is important to help doctors objectively generate diagnosis results objectively, leading to more effective treatments.
Additionally, the Cohen’s Kappa [Citation46] index is used to measure [Citation47,Citation48] the agreement between the proposed method and the group of physicians. The index (Kappa = 0.867 and P < 0.05) indicates that the proposed method has a high consistency with the doctors’ diagnosis.
6. Conclusion
In order to extract nonlinear features and qualitative information (expert doctors’ expertise) from high dimensional diagnostic scale data and reduce doctors’ heavy workload during the diagnostic process, this study proposes a hybrid classifier based on nonlinear-principal component analysis (NPCA) and deep belief networks (DBN) In contrast to traditional approaches. The hybrid classifier can extract the diagnostic scale data’s nonlinear features and hidden information and provide the key scale elements’ locating methods towards the diagnostic results, along with improve the efficiency and pertinence of diagnosis.
In addition, based on the ‘information entropy theory’, we prove that the novel NPCA-DBN classifier takes advantage of modeling accuracy and convergence speed, and overcomes the shortcomings of small sample sizes. Cases of dysphagia diagnoses collected from a hospital are used to test the applications of the methods, yielding satisfactory results compared with conventional classifiers. Based on comparative diagnostic test with the 180 real dysphagia diagnosis examples from the China-Japanese Friendship Hospital, we found that the diagnostic accuracy of the proposed NPCA-DBN classifier is higher than the other the traditional classifiers (i.e. DBN, PLS and SVM).
This research is still in the beginning stages, and there is need for further investigation on key issues such as diagnostic modeling methods with uncertain information (e.g. water swallow test scale item values that are unavailable in the presence of serious physical conditions of dysphagia patients), or with small diagnosis samples.
Acknowledgements
This study is supported by the Open Research Project under Grant from SKLMCCS [20150103], the Beijing outstanding talent training Project [2015000020124G041] and the National Natural Science Foundation of China [61603023].
Disclosure statement
No potential conflict of interest was reported by the authors.
Additional information
Funding
References
- Logemann JA. Evaluation and treatment of swallowing disorders. 2nd ed. Austin: Pro-Ed:1998.
- Smithard DG, O’Neill PA, England RE, et al. The natural history of dysphagia following a stroke. Dysphagia. 1997;12:188–193.
- Lawrence ES, Coshall C, Dundas R, et al. Estimates of the prevalence of acute stroke impairments and disability in a multiethnic population. Stroke. 2001;32:1279–1284.
- Hassan HE, Aboloyoun AI. The value of bedside tests in dysphagia evaluation. Egypt J Ear Nose Throat Allied Sci. 2014; 15:197–203.
- Ellis AL, Hannibal RR. Nursing swallow screens: why is testing water only not enough? J Neurosci Nurs. 2013;45:244–253.
- Smithard DG, O’Neill PA, Park C, et al. Complications and outcome after acute stroke does dysphagia matter? Stroke. 1996;27:1200–1204.
- Smithard DG, O’Neill PA, Martin DF, et al. Aspiration following stroke: is it related to the side of the stroke? Clin Rehabil. 1997;11:73–76.
- Ramsey DJ, Smithard DG. Assessment and management of dysphagia. Hosp Med. 2004;65:274–279.
- Osawa A, Maeshima S, Tanahashi N. Water-swallowing test: screening for aspiration in stroke patients. Cerebrovasc Dis. 2013;35:276–281.
- MartinoMaki R, Diamant EN. Identification of dysphagia using the Toronto Bedside Swallowing Screening Test (TOR-BSST©): are 10 teaspoons of water necessary? Int J Speech-Lang Pathol. 2014;6:193–198.
- Suiter DM, Leder SB. Clinical utility of the 3-ounce water swallow test. Dysphagia. 2008;23:244–250.
- Mallela UK, Upadhyay A. Buckling load prediction of laminated composite stiffened panels subjected to in-plane shear using artificial neural networks. Thin-Wall Struct. 2016;102:158–164.
- Stojanovic B, Milivojevic M, Milivojevic N, et al. A self-tuning system for dam behavior modeling based on evolving artificial neural networks. Adv Eng Soft. 2016;97:85–95.
- Wahab OA, Mourad A, Otrok H, et al. CEAP: SVM-based intelligent detection model for clustered vehicular ad hoc networks. Expert Syst Appl. 2016;15:40–54.
- Yan Y, Zheng WK, Bao J, et al. An enhanced Mary SVM algorithm for multi-category classification and its application. Neurocomputing. 2016;187:119–125.
- Fu JH, Lee SL. A multi-class SVM classification system based on learning methods from indistinguishable chinese official documents. Expert Syst Appl. 2012;39:3127–3134.
- Yardimci A. Soft computing in medicine. Applied Soft Comput. 2009;9:1029–1043.
- Teodorescua HL, Chelaru M, Kandela A, et al. Fuzzy methods in tremor assessment, prediction, and rehabilitation. Artif Intell Med. 2001;21:107–130.
- Montani S. Exploring new roles for case-based reasoning in heterogeneous AI systems for medical decision support. Appl Intell. 2008; 28:275–285.
- Palreddy S, Reddy NP, Green P, et al. Neural networks in computer-aided diagnosis classification of dysphagic patients. Paper presented at 14th Annual International Conference of the IEEE Engineering in Medicine and Biology Society; 1992(4). p. 1517–1518.
- Prabhu DNF, Reddy NP, Canilang EP. Neural networks for recognition of acceleration patterns during swallowing and coughing. Proceedings of the 16th Annual International Conference of the IEEE, 1994. p. 1105–1106.
- Reddy NP, Prabhu D, Palreddy, et al. Redundant neural networks for medical diagnosis: diagnosis of dysphagia. Intell Syst through Artif Neural Networks. 1995;5:699–704.
- Lee J, Blain S, Casas, et al. A radial basis classifier for the automatic detection of aspiration in children with dysphagia. J NeuroEng Rehabilit. 2006;3:1–3.
- Cola PC, Gatto AR, da Silva RG, et al. Classification of normal swallowing and oropharyngeal dysphagia using wavelet. Appl Math Comput. 2009;207:75–82.
- Saki F, Kehtarnavaz N. Online frame-based clustering with unknown number of clusters. Pattern Recogn. 2016;57:70–83.
- Li H, Chung F-l, Wang S. A SVM based classification method for homogeneous data. Appl Soft Comput. 2015;36:228–235.
- Embrechts MJ, Rossi F, Schleif F-M, et al. Advances in artificial neural networks, machine learning, and computational intelligence. Neurocomputing. 2014;141:1–2.
- Zhang YP, Li X, Zhang ZF, et al. Deep learning driven blockwise moving object detection with binary scene modeling. Neurocomputing. 2015;168:454–463.
- ZhouChen S, Wang QX. Active deep learning method for semi-supervised sentiment classification. Neurocomputing. 2013;120:536–546.
- Shen FR, Chao J, Zhao JX. Forecasting exchange rate using deep belief networks and conjugate gradient method. Neurocomputing. 2015;167:243–253.
- Li H, Li XY, Ramanathan M, et al. Identifying informative risk elements and predicting bone disease progression via deep belief networks. Methods. 2014;69:257–265.
- Shang C, Yang F, Huang DX, et al. Data-driven soft sensor development based on deep learning technique. J Process Control. 2014;24:223–233.
- M, Wöllmer F, Eyben Bö, Schuller, et al. Spoken term detection eith connectionist temporal classification:a novel hybrid CTC-DBN decoder. Poster presented at Acoustics, speech, and signal processing, ICASSP-88; 2010.
- Zhong Pin, Gong gZ. A hybrid DBN and CRF model for Spectral-Spatial classification of hyperspectral images. Stat Optim Inform Comput 2017;5:75–98.
- Verbanck M Josse, et al. Regularised PCA to denoise and visualise data. Stat Comput. 2015;25:471–486.
- Zhu Ge J, Song ZZ. Dynamic mixture probabilistic PCA classifier modeling and application for fault classification. J Chemometrics. 2015;29:361–370.
- Li EG, Yu JS. An input-training neural network based nonlinear principal component analysis approach for fault diagnosis. Control Decision. 2003;18:229–231.
- Niu Z, Liu ZJ, Niu yg. RBF networks-based nonlinear principal component analysis for process fault detection. Machine Learn Cybernet. 2005;8:4784–4788.
- Hessam M, Tarek E, Nejib S. A nonlinear principal component analysis approach for turbulent combustion composition space. Int J Hydrogen Energy. 2014;39:4622–4633.
- Liu KL, Fei ZS, Yue BX, et al. Adaptive sparse principal component analysis for enhanced process monitoring and fault isolation. Chemometrics Intell Lab Sys. 2015;146:426–436.
- Mansouri M, Nounou M, Nounou H, et al. Kernel PCA-based GLRT for nonlinear fault detection of chemical processes. J Loss Prevent Process Ind. 2016;40:334–347.
- Tan S, Mavrovouniotis ML. Reducing data dimensionality through optimizing neural network inputs. Aiche J. 1995;41:1471–1480.
- Liu J, Yu J, Yan B. A new method to fault nonlinear diagnosis for a class of systems. Chinese J Electron. 2011;2:217–222.
- Sanchez D, Melin P, Castillo O. Optimization of modular granular neural networks using a hierarchical genetic algorithm based on the database complexity applied to human recognition. Inform Sci. 2015;309:73–101.
- Ni Y-y, Zhang J-x. Modeling and forecasting for multivariate time series using a vector autoregression model. Chinese J Health Stat. 2014;1:53–56.
- Liang X, Chen S-w, Zhou P, et al. Diagnosis and differential diagnosis of two dimensional and three dimensional transvaginal Ultrasound. Chinese Ultrasound Med. 2012;28:355–357.
- Deng F, Guan S, Yue X, et al. Energy-based sound source localization with low power consumption in wireless sensor networks. IEEE Trans Ind Electron. 2017;64:4894–4902.
- Deng F, Guo S, Zhou R, et al Sensor multifault diagnosis with improved support vector machines. IEEE Trans Autom Sci Eng. 2017;14:1053–1063.