
Abstract
Continuous-wave Near-Infrared (NIR) optical spectroscopy has shown great diagnostic capability in the early tumor detection with advantages of low-cost, portable, non-invasive, and non-radiative. In this paper, Modified Lambert-Beer Theory is deployed to address the low-resolution issues of the NIR technique and to design the tumor detecting and imaging system. Considering that tumor tissues have features such as high blood flow and hypoxia, the proposed technique can detect the location, size, and other information of the tumor tissues by comparing the absorbance between pathological and normal tissues. Finally, the tumor tissues can be imaged through tomographic method. The simulation experiments prove that the proposed technique and designed system can efficiently detect the tumor tissues, achieving imaging precision within 1 mm. The work of the paper has shown great potential in the diagnosis of tumor close to body surface.
Introduction
As a malignant disease, cancer is a serious threat to human health. It will be of great help if the tumor can be timely detected at the early stage, significantly improving cure rate [Citation1].
Traditional methods to detect cancerous tissues, including X-Ray imaging, computer tomography (CT), nuclear magnetic resonance imaging (NMRI), positron emission tomography (PET), and ultrasonic imaging, have the advantage of high imaging resolution [Citation2]. However, the fact that these methods require expensive and cumbersome machines has made the diagnostic expense quite high, and the radiation from techniques such as X-Ray and CT is harmful for human body, as well [Citation3]. These disadvantages of traditional methods hindered the possibility of them being used as household appliances, which would ideally be used daily for early cancer screening. Imaging technique based on near-infrared (NIR) optical spectroscopy has shown great diagnostic capability in early tumor detection with advantages of low-cost, portable, non-invasive, and non-radiative [Citation4,Citation5].
NIR optical spectroscopy can easily get the pathological grading of the targeted tumor to differentiate benign and malignant tumors based on detecting the changes in blood-oxygen levels, thus the technique has natural advantages in recognizing early-stage malignant tumor [Citation6]. However, this method was discarded because of its low spatial resolution and its dependence on depth information of the target during detection [Citation7]. Recently, a great amount of effort has been made by researchers to study the theory of NIR imaging, and to increase imaging resolution by using other detection methods to assist NIR optical spectroscopy [Citation8,Citation9]. These include the work conducted by Dr. Zhu’s team from University of Connecticut, which used frequency-domain modulation as basis and combined NIR optical spectroscopy with ultrasonic phase control technique to support the ultrasound-guided diffuse optical tomography. Their team designed an imaging system, which is shown to be promising in clinical applications [Citation10].
To further the development of NIR imaging in tumor detection, it is key to resolve the issue of low spatial resolution while imaging targeted tumor using continuous-wave near-infrared with no assistance of other techniques. Therefore, this paper proposed an innovative tomography method based on continuous-wave near-infrared technology and Modified Lambert-Beer theory, designed and implemented a device containing a NIR sensor array and signal processing unit, which could be used as a house-hold equipment for self-inspecting and detecting malignant tumor. This device could be useful in routine detection of tumor close to body surface, especially breast tumor, with minimal economic inputting and professional knowledge.
The paper is organized as follows. In Section II, we introduce the structure of the data acquisition system used for tumor detection. In Section III, the tumor detecting and imaging theory are proposed. In Section IV, the experiment design and results analysis are shown in detail. In Sections V, we summarize the paper and give the conclusion about the performance of the proposed method.
Data acquisition system
The data acquisition system is aimed to reconstruct multiple tomographic maps for the target zones. Based on the Modified Lambert-Beer theory and using enhanced STM32F103 as the control core, the optical intensity measurement system deploys 3-wavelength (L735/805/850) LED light sources as NIR transmitters, photoelectric sensors (OPT101) as receivers. The whole system consists of the control unit and the probe unit. The probe unit directly contacts the human/imitation tissues, transmits and receives NIR, and sends the optical intensity information to the control unit for preprocessing. The processed data is then sent to the host computer for tissue/tumor tomographic imaging.
Probe structure
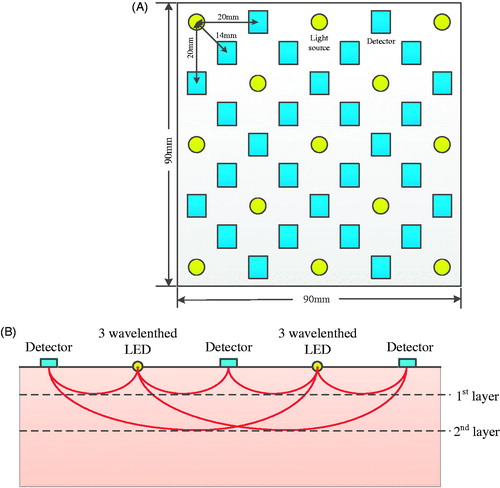
In this section, the probe structure design is discussed in detail, which is 9 × 9 cm in dimension and separated from the control and processing unit. The space on the probe board is only enough to accommodate a total of 41 light sources and detectors. Since the price of 3-wavelength NIR LED is much higher than the that of the detector, as few light sources and as many detectors as possible are chosen in the design under the criterion of maintaining the imaging resolution. As a result, 13 NIR optical sources and 28 detectors are finalized as shown in . Yellow circles represent LED optical sources, and light blue rectangles represent OTP101 sensors, the distance between neighboring optical source and sensor OTP101 is set to be 20 mm to ensure that the detection is deep enough, and the number of layers of tomography is sufficient for tumor detection such as breast cancer. Thus the linear distance between optical sources and sensors can be 14.0 mm, 20.0 mm, 31.3 mm, 44.7 mm, 50.5 mm, 60.0 mm, 71.4 mm, 81.6 mm, etc., according to the size of the probe board and the number of light sources and detectors. Based on the analytical function with respect to optical path distribution between the vertical incident optical source and sensor, it can be determined that the photon path satisfies arcsine distribution with the center between the optical source and the sensor reaching the maximum depth where l is the distance between the optical source and the sensor [Citation11,Citation12]. Therefore, it is feasible to detect the optical intensity at different depths of target tissues by adjusting the distance between the LED optical sources and optical intensity sensors. As shown in , the maximum sensing depth the probe sensor can achieve is 35.4 mm.
Figure 1. (A) Layout diagram of near-infrared light sources and detectors. (B) Near-infrared stratification.
Control system
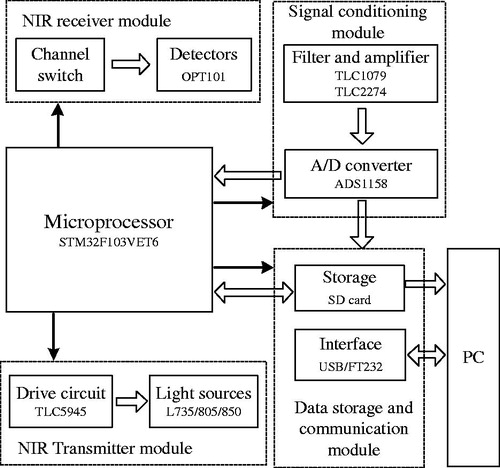
The overall system block diagram is shown in . The micro-processor STM32F103VET6 is used for control and data processing. 13 optical source groups, each of which has three wavelengths (735 nm/805 nm/850 nm), are controlled by the processor through the 16-Channel LED Driver TLC5945. The 13 × 3 single wavelength optical sources are lit up through time sharing control. After being absorbed by the imitation, the emergent ray is received by 28 photoelectric sensors (OPT101) and transferred to analog signal corresponding to the optical signal, then, the signal is sent to the main control board for preprocessing such as first order passive low-pass filtering and non-inverting amplifying. The analog signal is converted to 16-bit digital signal for 28 channels by 2 chips of 16-channel ADC (ADS1158) for processing by micro-processor. The processed data is saved in SD card and sent to host computer for further processing and imaging.
Figure 2. Structure diagram of control and imaging system.
Tumor detection and imaging theory
The system is designed for tumor detection and imaging based on Near-Infrared (NIR) optical spectroscopy and computer tomography scanning technique. In application, the designed system detects the difference in blood-oxygen level between the pathological and control tissues, and analyzing the degree of attenuation of the emergent optical intensity based on Modified Lambert-Beer Theory. Considering the tumor tissue features-high blood flow and hypoxia, the location, size, and other information of the tumor tissues can be finally determined and shown as tomography. Size, weight, power, and cost is taken into consideration during the whole system design process. The hardware structure is optimized so that the system performance is guaranteed by deploying minimum number of NIR optical sources and detectors. As less number of optical sources and sensors can reduce the image resolution, image interpolation and smoothing algorithm is used to address the low-resolution issue.
In this paper, the proposed tumor detection and imaging process is shown as follows:
The LED optical sources are numbered as Li, i=1,2,⋯,13. The photoelectric sensors are numbered as Dj, j=1,2,⋯,28.
For normal and diseased imitations, LED optical source L1 emits the incident light with optical intensity I0.
The photoelectric sensor L1 is used for measuring the emergent light intensities of normal and diseased imitations, denoted as I and I′, respectively. Based on Modified Lambert-Beer theory, the emergent light intensity for normal imitation is,
(1)
where OD11 represents optical density. DPF (Differential Path Length Factor) represents the function of light wavelength [Citation13]. l represents the distance between the optical source and the photoelectric sensor. εHbO2 and εHb represent the extinction coefficients of oxyhemoglobin and deoxyhemoglobin, respectively. While CHbO2 and CHb represent their molalities, respectively. G represents the attenuation factor synthesizing all the background factors that may disturb the absorption and scattering. G is usually regarded as constant when the light source and detector are the same. The emergent light intensity of diseased imitation is,
Combine (1) and (2), subtract G, we can get optical density difference,
Collect all the data from sensor D2 to D28 in turn, repeat Step (3), and achieve the optical density difference ΔOD1j, j=2,3,⋯,28.
Turn on LED optical sources L2 to L13 to emit the NIR with intensity I0 in turn, repeat Step (3) and (4), record the optical density difference ΔODij, i=2,3,⋯,13; j=2,3,⋯,28.
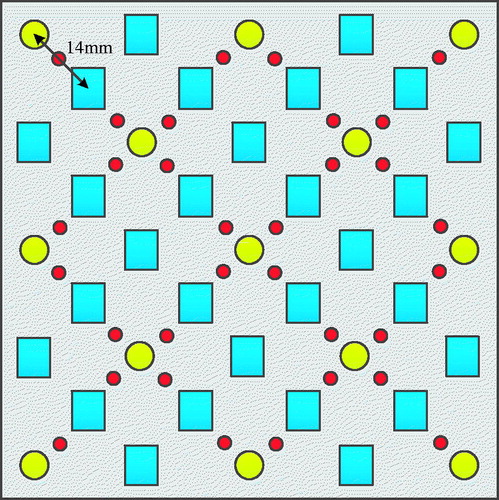
Conduct the imaging for the first layer of imitation at the depth of 5mm. Group the optical sources and detectors with distance 14mm, ΔODij are integrated as a set. The measuring points of first layer are shown in , where the red solid circle represents the first measuring point. The normalized measurement is set to be the pixel value for each measuring point. The pixel value at other locations can be derived through the interpolation method.
Based on Step (6), the pixel arrays are derived at depth of 11.2mm, 15.8mm, 21.2mm, 25.5mm, 29.2mm and 35mm.
Matlab is used for plotting images at different layers, thus finally implementing tomography imaging or 3-D imaging.
Figure 3. Pixel arrays of the first layer.
Experiment and analysis
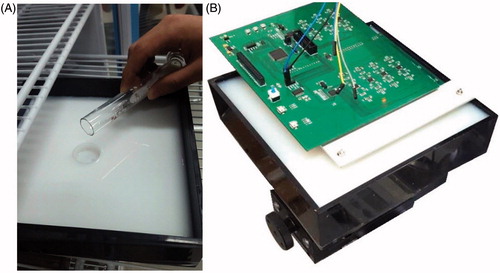
In this study, in order to verify the proposed system and detection method, the imitation is used to represent normal human tissues and tumor tissues. In the experiment, 1904 ml of 1% agar, 16 ml of 0.005% Indian ink, and 60 ml of 10% medical lipid emulsion were mixed to form a solid phantom [Citation14]. Scattering rate and absorption rate of the imitation as well as the normal human tissue to NIR are ensured to be close. Two imitations are made according to this protocol, one mimicking normal human tissue, and the other mimicking pathological tissue (). Both imitations are of the same size 22 cm × 22 cm × 4 cm. A cylindrical tumor-like object (made up with 1% agar, 0.025% Indian ink, and 10% medical lipid emulsion), 1 cm diameter and 0.3 cm height, is inserted to the tumor tissue imitation at around 25 mm depth.
Figure 4. (A) Imitation fabrication. (B) Tumor detecting and imaging.
The two imitations are detected using this device by lighting up LED optical sources through time-sharing control, emitting NIR of different wavelengths, and recording output results of all photoelectric detectors (emergent light intensity). Taking the difference of the two imitation measurements, and through interpolation method, the expanded result is displayed as tomography ().
Figure 5. Tumor imitation tomography. (A) 5 mm layer. (B) 11.2 m layer. (C) 15.8 mm layer. (D) 21.2 mm layer. (E) 25.5 mm layer. (F) 29.2 mm layer. (G) 35.4 mm layer.
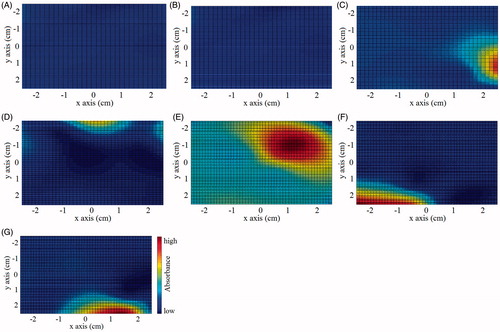
As shown in , a round and bright area is detected at the depth of 25.5 mm. Based on the above-mentioned theory, considering the characteristic of high blood flow in the tumorous area, when NIR is exerted on a tumor tissue, absorbance of photons by large amount of hemoglobin can create an optical dark region. After taking the absolute value of the difference between two imitation measurements, the trough values become peak values, thus the optical bright region in the figure. The highlighted area is in the shape of a circle, with diameter of the peak-valued area around 1 cm, which is the same as the size of the implanted tumor imitation (with less than 1 mm deviation). The sub-peak values appear at the margin of the peak-valued area as highlighted state, due to the partial absorption of infrared light, the travel path of which intersected by the tumor imitation. The sub-peak values making the margin obscure and indistinguishable, can be filtered out by setting an upper limit. Based on the experiment results, the proposed methods can precisely detect the shape, size, and depth of tumor imitation.
There exist obvious light spots at the margins in . It is because the imitation container can reflect the NIR, affecting the margin imaging accuracy. Besides, the existence of the light spots also comes from the sparsity of data sample. Although the data set is extended through the interpolation method, the amount of real measurement (detection value) in the data array is still comparatively small, making it difficult to achieve accurate marginal information. Therefore, in the future study, parallel translation will be carried out to increase the number of optical sources and sensors in the target zone. The increased effective measuring points can further improve the tumor imaging resolution.
Compared with the tumor imaging result in literature 10, the imaging resolution presented by this paper is relatively low, and the positioning accuracy of the tumor is relatively poor. The reason is that literature 10 uses ultrasound as an auxiliary positioning aid for near-infrared spectroscopy. For only using continuous near infrared spectroscopy as the detecting method, the positioning accuracy of the proposed method is bound to be low. However, the proposed tomography method simplifies the hardware structure and refines the algorithm, which reduces the cost of the device and realizes the embedded processing of the data. Low cost and small size make it meet the requirements of the household application, and the current imaging accuracy is also sufficient to proceed the daily examination of the tumor, especially for breast tumor.
Conclusion
Based on continuous-wave near–infrared technology, this study achieves locating and imaging of tumor through layer-by-layer detection of pathological tissues using the NIR senor array and series of signal processing. Experimental results show that, the hypothesized method can clearly generate tomography of tumor tissues. The sensor array is able to achieve wider-ranged and more in-depth detection compared to the single or linear optical source. A system can more accurately determine the 3-D orientation of the tumor when a wider angle is used to conduct integrity detection of certain area of the human body. Moreover, the imitation used in this study is similar to human tissues in terms of optical characteristics, thus the accuracy of the designed system for imitation tumor identification guarantees the feasibility of this technique in actual human diagnostics.
Disclosure statement
No potential conflicts of interest were disclosed.
Additional information
Funding
References
- Jayanthi VSA, Das AB, Saxena U. Recent advances in biosensor development for the detection of cancer biomarkers. Biosens Bioelectron. 2017;91:15–23.
- Poellinger A, Grosenick D. Optical Imaging in Mammography. Comprehen Biomed Phys. 2014;4:345–362.
- Ruchalski K, Gutierrez A, Genshaft S, et al. The evidence for low-dose CT screening of lung cancer. Clin Imaging. 2016;40:288–295.
- Korb ML, Hartman YE, Zinn KR, et al. Use of near-infrared imaging to improve surgical resection of breast cancer. J Am Coll Surgeons. 2013;217:S126–S127.
- Sampath L, Kwon S, Hall MA, et al. Detection of cancer metastases with a dual-labeled near-infrared/positron emission tomography imaging agent. Transl Oncol. 2010;3:307–317.
- Partsvania B, Petriashvili G, Fonjavidze N. Possibility of using near infrared irradiation for early cancer diagnosis. Electromagn Biol Med. 2014;33:18–20.
- Luo SG, Zhang EL, Su YP, et al. A review of NIR dyes in cancer targeting and imaging. Biomaterials. 2011;32:7127–7138.
- Jiang Z, Holyoak GR, Bartels KE, et al. In vivo trans-rectal ultrasound coupled trans-rectal near-infrared optical tomography of canine prostate bearing transmissible venereal tumor. SPIE BiOS. 2009;DOI:10.1117/12.807990.
- Mastanduno MA, Xu JQ, El-Ghussein F, et al. Sensitivity of MRI-guided near-infrared spectroscopy clinical breast exam data and its impact on diagnostic performance. Biomed Opt Express. 2014;5:3103–3115.
- Tavakoli B, Zhu Q. Two-step reconstruction method using global optimization and conjugate gradient for ultrasound-guided diffuse optical tomography. J Biomed Opt. 2013;18:016006.
- Mastanduno MA, Davis SC, Jiang SD, et al. Magnetic resonance guided optical spectroscopy imaging of human breast cancer using a combined frequency domain and continuous wave approach. Biomed Optics Imaging. 2012;DOI:10.1117/12.807990.
- Liu D, Liu X, Zhang Y, et al. Tissue phantom-based breast cancer detection using continuous near-infrared sensor. Bioengineered. 2016;7:321–326.
- Bhatt M, Ayyalasomayajula KR, Yalavarthy PK. Generalized Beer-Lambert model for near-infrared light propagation in thick biological tissues. J Biomed Opt. 2016;21:076012.
- Vaithianathan T, Tullis IDC, Everdell N. Functional imaging of the brain using a portable NIR instrument. Proc Spie. 2003;4955:96–102.