
Abstract
The typical method of monitoring arrhythmia is to use a body patch type sensor with a wet electrode. It has several problems caused by wet electrodes for long-term monitoring. Thus, a monitoring sensor integrated into clothes with a dry electrode is proposed. In this study, we develop a smart outdoor shirt equipped with a dry electrode electrocardiogram (ECG) sensor for a cardiac arrhythmia computer aided diagnosis system. The sensor can be inserted in a console close to the chest, charged, used to communicate wirelessly, and connected with a smartphone application. The ECG signals measured by the smart shirt indicated that 97.5 ± 1% of the signals could be measured in an immobile state and at least 85.2 ± 2% of the signals could be measured during movement. We propose a computer aided diagnosis system for detecting cardiac arrhythmia. It was determined through experiments that the system can detect arrhythmia with an accuracy of 98.2 ± 2%. This study suggests that smart shirt which can diagnose arrhythmia will provide information that can quickly recognize arrhythmia in daily life or exercise.
Introduction
Globally, the aging population and the number of individuals with chronic diseases have increased. Cardiovascular diseases are the leading cause of death worldwide, and mortality from cardiovascular diseases continues to rise every year [Citation1]. Telecommunications companies are actively entering the healthcare market with the introduction of wearables focused on healthcare and smart healthcare applications based on smartphone and tablet platforms. Previous efforts have focused on the “treatment” of specific patients; however, this realm of healthcare has expanded to include daily “care” that is customized for individuals; this has been the new global trend. In tandem with such trends, small and medium enterprises and venture firms related to healthcare have been actively developing u-health and e-service platforms with smartphones as the key medium, in addition to service programs with u-health applications for electrocardiograms (ECG), stress, obesity, and blood sugar levels [Citation2,Citation3]. Moreover, the “location” of healthcare activities is no longer restricted to hospitals. It is expanding to homes and other areas outside hospitals, with individuals being able to directly manage their health [Citation4]. Large hospitals are engaging in healthcare services by setting up subsidiaries and partnering with healthcare information firms. Typically, healthcare services are currently available in the form of “activity trackers” and “customized care,” which collect information about the health of individuals and utilize such information to provide effective prevention and treatment services at appropriate times [Citation5].
Among the multiple facets of the u-healthcare industry, this study focuses on u-health clothing based on IT. This industry has seen active R&D worldwide, with particular focus on healthcare products that measure physiological functions such as ECG, electromyograms, sweat, body temperature, and breathing. The development of life shirts that merge easurement systems for physiological signals has progressed rapidly. These shirts feel like normal fabric; however, they are fabricated using smart fibers, such as conductive fibers, textile sensors, textile input devices, and optical woven fibers [Citation6,Citation7]. A bioshirt, which is a high-tech wearable measurement and analytics system for physiological signals, was developed in a study by integrating measurement sensors for physiological signals and analytics modules with clothing. This shirt was equipped with Biopatch, which measures physiological signals, an activity monitor, which measures exact calorie consumption levels, and a life management system that monitors changes in daily activity [Citation8]. Moreover, the research team was in the process of developing biosensors for on-site diagnostics, such as biochips for urine analysis, cancer diagnosis, and cardiovascular diseases [Citation8,Citation9]. U-health clothing products require an expansion of perception as “clothing” that is comfortably worn every day to measure and manage ECG, while eliminating its former perception as equipment for patients. However, most currently available u-health clothing for measuring ECG is for “patients” or for “sports” purposes. This study focuses on the 40 s–60 s age group as a consumer segment and outdoor activity levels, and it aims to develop an ECG-measuring outdoor u-health shirt that is suitable for different body types and with highly wearable designs that allow for daily use.
Most biosignal monitoring sensors use wet electrodes. Despite and the fact that these sensors are easy to attach, owing to their material characteristics, several users experience problems related to tissues when they are used for long periods. Thus, dry electrodes that use tissue friendly conductive fabrics are required for biosignal monitoring systems that can be used for long periods.
Laundry is a limitation of smart outdoor shirts. As sensors contain electronic devices, they have a limited number of cleaning cycles. In the context of smart outdoor shirts, it is an important objective to create a low-cost sensor for laundry or a removable sensor that can be attached to clothes easily.
In this paper, we propose novel smart clothing with a dry electrode biosensor for real-time automatic diagnosis of cardiovascular diseases. The proposed method includes a biosensor that can detect arrhythmia automatically through a dry electrode, which is easier to attach to clothing than a wet electrode. This sensor can be attached to fashionably designed smartwear outdoor shirts for the 40 s–60 s age group. The designed smartwear outdoor T-shirts are introduced in the following section. Then, the biosensor with the dry electrode and its verification using numerical simulation are discussed. Next, the algorithm and system for the identification of arrhythmia is described. Then, the proposed method is validated through experiments. Finally, the conclusions and discussion are presented.
Materials and methods
Sensor and dry electrode for smartwear outdoor clothing
Smartwear outdoor shirts are proposed for those who require continuous ECG measurements for prevention of heart failure. These shirts are manufactured using elastic fabric such as spandex and polyester. First, 3 D image data are obtained for the typical body types in the 40 s–60 s age group to maintain a snug fit; these data are used for ECG measurements. The snug fit is coupled with inelastic and circular patterns that are comfortable to wearers. The ECG sensing patch and related manufacturing technologies are developed using a conductive material. To minimize the irritation and resistance due to existing metallic ECG measurement patches on the body, the patch is manufactured using conductive fiber. This allows for ECG measurements and is favorable for fashionable design. Several conductive fiber firms were contacted for obtaining samples, and each sample was checked for knittability, resistance, and whether physiological signals were measurable upon connection with sensors. shows the global standard size specifications and diagram for the 40 s–60 s age group.
Figure 1. Global standard size specifications and diagram for the 40 s–60 s age group.
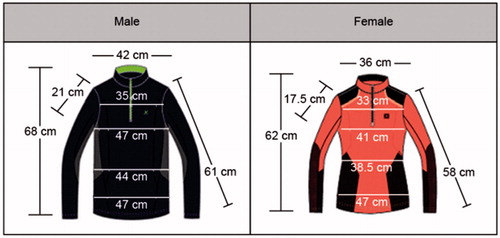
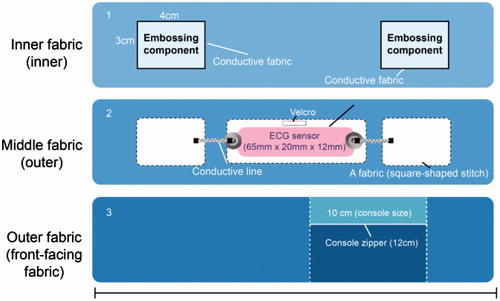
This product has superior elasticity and thickness, and it is comfortable to wear. The fabric on which the sensor is attached is the same as the fabric of the entire shirt, and it is characterized by evenly distributed elasticity throughout the shirt. In addition, the shirt is characterized by a comfortable fit and high wearability because it is based on the standard size specifications for the 40 s-60 s age group, which are obtained using the standard body classification. The sensor pack has a zipper finish that prevents external exposure when the sensor is attached and removed. The sensing patch is located approximately 28–30 cm from the neck on the chest, which is an area with minimal muscle movements and superior sensor measurement potential. To transmit the ECG signal measured from the skin to the sensor, a circuit is designed and integrated within the shirt. The inner fabric of the shirt contains a sensing patch with a 100% acrylic conductive fiber finish. It is embossed in consideration of coming into direct contact with skin. Moreover, another piece of fabric is knitted to insert the console where the sensor is located, and a button is used to hold the sensor within the console. The button is connected to the electrodes, which are connected to a line composed of conductive fiber to the primary fabric in the inner fabric. shows the internal circuit design of the smartwear outdoor shirt on the inner, outer, and front-facing fabric.
Figure 2. Internal circuit design of the smartwear outdoor shirt on inner, outer, and front-facing.
Design development
The minimal-awareness ECG sensor consists of dry electrodes on each side and a battery with a width, length, and height of 65 mm, 20 mm, and 12 mm, respectively. Moreover, it carries a Bluetooth transmission-enabled module that can communicate between the ECG sensor and a smartphone. This allows for real-time monitoring of measured signals.
Charging
The following two methods were developed for charging: wireless charging and wired charging using a micro-5-pin module. The wireless-charging sensor contains a secondary coil for charging and the wired-charging sensor contains a micro-5-pin module.
Data collection, amplification, and storage
The ECG tracks the cardiac induced potential difference between the electrodes placed on the surface of a body. However, the action potential for the contraction and relaxation of the heart muscle is approximately 1 mV, which is extremely difficult to measure. Therefore, it is necessary to amplify ECG data such that it can be easily recognized by the human eye. An operational amplifier is used for this purpose. This amplifier amplifies input potential to the desired level and generates the increased output potential required by a user. In this study, we constructed an instrumentation amplifier using an operational amplifier and developed a band-pass filter to amplify a fine ECG up to 100 fold. The current consumption of the proposed ECG sensor is approximately 11 mA. Noise is inversely proportional to the antenna length of the radio communication between internal sensors. The specifications of the developed ECG sensor electrodes are as follows: the distance between the electrodes is ≥40 mm and electrode width is ≥5 mm.
Materials and manufacturing
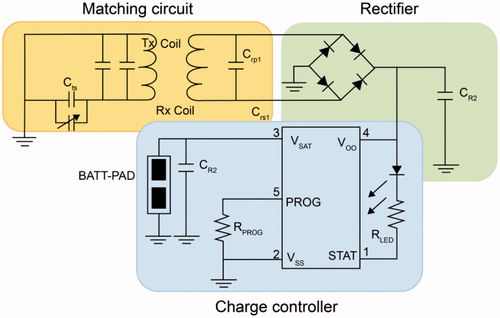
The electrodes are manufactured using titanium materials. The packaging material is hard and coated to protect the interior of the sensor. To completely block the interaction between the interior of the human body and the sensor environment, the sensor must be sealed through bonding techniques such as adhesives or lasers. In this study, we used lasers to produce a packaging prototype. Polydimethylsiloxane (PDMS) and medical epoxy can be used as suitable adhesives, and PDMS, parylene, polyethylene, glycol, and silicone can be used as coatings. Their biocompatibility has been proven in several studies [Citation10–12]. The wireless charger for the ECG measurement sensor was fabricated using electromagnetic induction through a coil. Electromagnetic induction is a phenomenon in which an electromagnetic field is generated when electricity flows through a coil; the magnetic field induces the flow of electricity in the opposite coil, thereby producing electric current. A helical type of resonance coil enables receiving coils to be charged from a source coil.
Packaging
Packaging material should be biocompatible to prevent inflammation or necrosis of human tissue [Citation13]. In addition, radio waves should not be lost when they pass through the material. Packaging design should be considered to prevent the risk of tissue damage due to movement after sensor insertion. Feedthrough must meet several requirements; it is important to ensure conductivity between internal circuitry and electrodes, minimize noise, and maintain airtightness. In this study, we developed an electrode sealing method using the elasticity of a polymer film. shows the minimal-awareness ECG sensor and shows the circuit diagram of the wireless electric power transfer system.
Figure 3. Minimal-awareness ECG sensor for bioshirt.
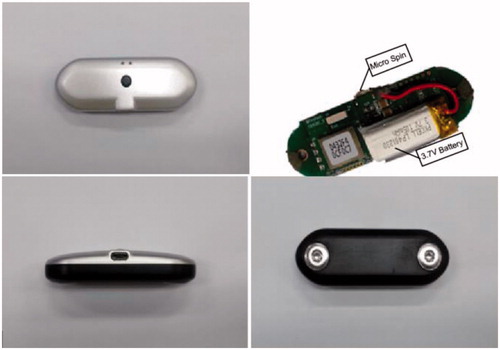
Figure 4. Circuit diagram of wireless electric power transfer system.
Wavelet transform
In this section, we propose an automatic arrhythmia detection algorithm based on ECG monitoring signals. A wavelet transform provides a description of a signal and decomposes it at different time–frequency resolutions [Citation14,Citation15]. It is suitable for the analysis of nonstationary signals, such as that in ECG. The different wave components of ECG with their frequencies are clearly visible when subjected to multiresolution analysis. Moreover, various noise levels, which appear at different frequency bands, and their contribution to signal distortion can be clearly identified. Selecting a wavelet function that closely matches the morphology of the signal under investigation is of considerable importance in wavelet-based applications. Daubechies wavelet families are similar to the shape of QRS; hence, db8, which has a low-frequency energy concentration and a morphology that is considerably similar to that of QRS, is selected as the mother wavelet for the present analysis.
Among multiple time-frequency representations, the discrete wavelet transform (DWT), which uses a dyadic scale, is considered to be the most efficient owing to its several unique properties and ability to solve a diverse set of problems including
data compression
biomedical signal analysis
feature extraction
noise suppression
with moderate computational expense.
The DWT analyzes a signal at different resolutions by decomposing it into several successive frequency bands. It uses 2 sets of functions, i.e., φ(t) and ψ(t) associated with low- and high-pass filters, respectively.
(1)
(2)
Here, h[n] and g[n] represent half-band low- and high-pass filters, respectively. A different scale and translation of their functions are important for obtaining a different frequency and time localization of the signal. Therefore, signal decomposition into different frequency bands is accomplished by successive low- and high-pass filtering of the time domain signal. The time domain signal sampled at 300 samples/s forms a discrete time signal, x[n], which is passed through a half-band high-pass filter (g[n]) and a low-pass filter (h[n]), with downsampling by a factor of 2.
Difference operation algorithm
The difference operation algorithm allows for simple and fast detection of QRS complexes. It essentially involves finding a difference signal or derivative. The ECG R wave is assessed using the difference operation filter technology, and an appropriate threshold is determined to obtain an accurate ECG detection algorithm. In EquationEquation (3)(3) , x[n] is the original ECG signal, 0 ≤ n ≤ N, and N is the total number of signal samples. The equation is obtained as follows:
Step 1: Obtain the difference signal, xd, using EquationEquation (3)(3) .
(3)
Step 2: Remove high-frequency noise signal components using a mean filter with a length of 5.
(4)
Step 3: Obtain threshold xF[n] using threshold level λ as follows:
(5)
Step 4: Find the R positions from xT[n].
The duration of each R-R interval is approximately 0.6–0.75 s (182–227 samples) at a sampling frequency of 300 Hz. The local maximum is derived from every interval, starting from the n at which xT[n] is greater than 0. L is interval length. By default, L is selected from 90 samples, which is half of the least number of samples in the R-R interval.
Heart rate variability
Over the past several decades, there has been a widespread interest in the study of the variation in the beat-to-beat timing of the heart, which is known as heart rate variability (HRV). The offline analysis of the R-R intervals uses the R-peak detection algorithm. Various time and frequency domain analyses can be performed for the beat-to-beat variations in the R-R intervals generated by HRV. For time domain analysis, we calculated the mean and standard deviation of the R-R intervals, the root mean square of the successive R-R interval differences (rMSSD), the number of R-R intervals for which the successive R-R intervals differed by at least 50 ms (NN50), and the number of times that the successive R-R intervals differed by 50% from the index R-R interval (pNN50). In addition, we obtained the integral of the R-R density distribution divided by the maximum density distribution (R-R triangular) and the length of the base of a triangle approximating the N-N interval distribution (TINN). Frequency domain analyses included the following: determination of power spectral density using very low-frequency (0.003–0.04 Hz; low frequency [LF]: 0.04–0.15 Hz) and high-frequency (HF) components (0.15–0.40 Hz) through the fast Fourier transform, the percentages of total power in the LF and HF ranges, and the ratio of LF to HF power. All HRV measurements were performed for each 5-min recording segment for each patient in the normal sinus rhythm (NSR; control) and arrhythmia groups.
Poincaré plot
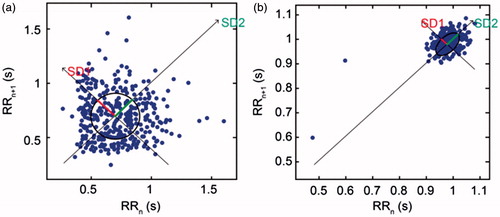
A simple and easy-to-comprehend nonlinear, quantitative, and visual HRV analysis technique is the use of the Poincaré plot. It is a graphical representation of the correlation between consecutive R-R intervals, which takes a sequence of intervals and plots each interval against the following interval. To mathematically characterize the shape of the plot, most researchers have adopted the method of fitting an ellipse to the plot. A set of axes is defined oriented with the line of identity, which is the axis with θ = π/4 rad.
(6)
In the reference system of the new axis, the dispersion of points around the x1-axis is measured using standard deviation, which is denoted by SD1. This quantity measures the width of the Poincaré cloud, and therefore, it indicates the level of short-term HRV. The length of the cloud along the line of identity represents long-term HRV, and it is measured by SD2, which is the standard deviation around the x2-axis. The Poincaré plot is related to the new set of axes by a rotation. As shown in , the standard deviation of the distance of the points from each axis determines the width (SD1) and length (SD2) of the ellipse. The lengths of the current (RRn) and post intervals (RRn +1) are shown on the x-axis and y-axis, respectively. shows the Poincaré plot for the R-R interval sequence in arrhythmia and NSR patients.
Figure 5. (a) Arrythmia patients (b)NSR patients. Poincaré plot for the 5-min R-R interval sequence in arrhythmia and NSR patients, used to analyze the effect of ECG duration on plot mapping.
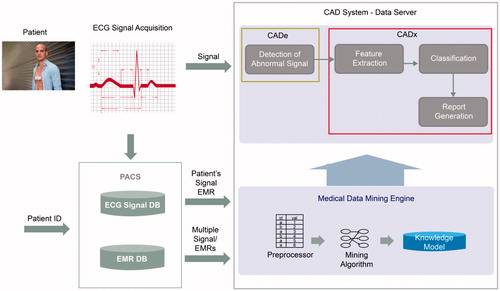
shows the overview of the computer aided diagnosis (CAD) system used in this study for monitoring arrhythmia. In the system, a medical data mining engine is modeled using a machine learning algorithm of the ECG features of HRV. We generate the engine from the ECG data of 500 patients. The CAD system integrates the mining engine; if the new ECG signal is monitored, the CAD system detects an abnormal signal and extracts HRV features. Finally, the knowledge model of the medical data mining engine determines and classifies the signal as arrhythmic or normal.
Figure 6. Computer aided diagnosis system for arrhythmia monitoring.
Results
Experiments on smartwear outdoor shirts with ECG sensor monitoring
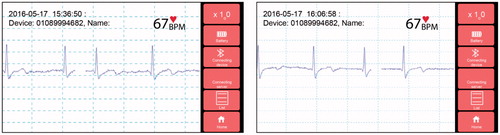
ECG measurements were performed using the sensor in real time while the shirt was worn. ECG data were acquired from 50 people while they wore the bioshirt to verify the validity of the data. At the Dongsan Medical Center in South Korea, it was determined whether the ECG signal is monitored correctly and if ECG peaks, such as the P, Q, R, S, and T peaks, are observed clearly. Expert review indicated that signal accuracy was 97.5 ± 1% in a state of immobility and 85.2 ± 2% during movement over a distance of approximately 10 m. shows the smartwear outdoor shirts with the ECG sensor and shows the ECG monitoring through a mobile phone and application. In , the x-axis and y-axis represent the time domain and signal amplitude, respectively.
Figure 7. Two colors of smartwear outdoor shirts with ECG sensor.
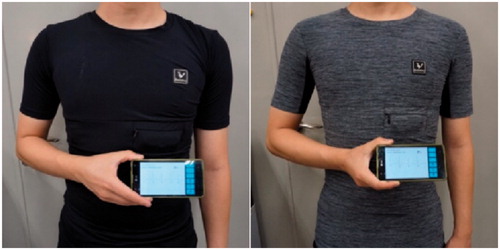
Figure 8. ECG monitoring through mobile phone and application.
Experiments on automatic arrhythmia diagnosis algorithm
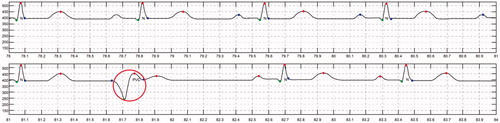
ECG detection was performed using long-term real-time ECG data from the bioshirt and the signal processing algorithm developed in this study. To validate the accuracy of the algorithm, normal and arrhythmic data were generated using an arrhythmia generation simulator, which can generate several kinds of ECG signals, including those for arrhythmia. Fifty cases for arrhythmia were generated and monitored through the bioshirt for verifying the algorithm. From the experiments, we found that the accuracy of the algorithm was 98.2 ± 2% for the identification of arrhythmia. show the CAD algorithm results obtained from the ECG monitoring signal. In these graphs, abnormal ECG (red circle) signals have been distinguished from normal ECG (blue circle) signals using the algorithm. shows the automatic ECG detection results for atrial fibrillation (AF). The QRS interval of AF is shorter than that for NSR. The system successfully differentiates AF from NSR. The algorithm automatically annotates N as NSR and AF as atrial fibrillation into the monitoring signal. shows the detection results for premature atrial contraction (PAC) and NSR. PAC signals exhibit irregular T peaks, and the algorithm classifies PAC successfully. shows the detection results for premature ventricular contraction (PVC). PVC signals exhibit irregular P and Q peaks; the algorithm detects this abnormality and differentiates the signal from NSR.
Figure 9. Automatic ECG detection results for atrial fibrillation (AF).
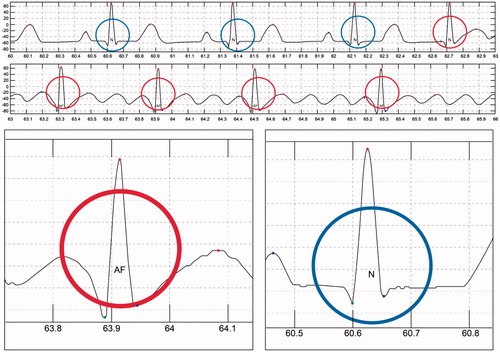
Figure 10. Automatic ECG detection results for premature atrial contraction (PAC).
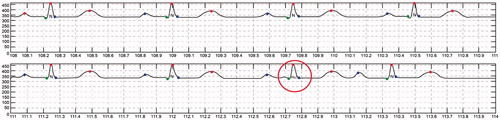
Figure 11. Automatic ECG detection results for premature ventricular contraction (PVC).
Conclusion
This study developed a u-health smart shirt that provides physical and mental comfort to middle-aged and senior consumers, who are either cardiovascular patients or at risk of such diseases, thereby enabling them to wear the shirt every day. This shirt, which consists of an ECG sensor that syncs with mobile devices, is manufactured using standard size specifications for the ages and genders of those in their 40 s–60 s; hence, it is effective for obtaining ECG measurements and is easy to wear. The design of the shirt is based on “design components and preferences analysis.” Furthermore, this study developed a circuit composition method using a conductive fiber that minimizes discomfort during wear due to sensors, circuit lines, and external exposure. The ECG sensor is characterized by minimal awareness, i.e., users hardly feel the sensor. In addition, the sensor enables users to check their state anytime and anywhere using their mobile devices through a wellness index measurement algorithm based on ECG signals and a low-noise data transmission algorithm. The shirt consists of wireless charging capabilities for sustained supply of electricity to ECG sensor for prolonged wear. The study developed a mobile application that can assist in the diagnosis of cardiovascular diseases and provide feedback on the wellness index.
Laundry is a limitation of the smart outdoor shirt. As sensors contain electronic devices, they have a limited number of cleaning cycles. In the context of smart outdoor shirts, it is considered as important objective to create a low-cost sensor for laundry or a removable sensor that can be attached to clothes easily. In the developed system, if arrhythmia is detected, the application interface sends an alert to a local hospital or emergency room. Data are stored for later review and further diagnosis. With global aging and an increasing number of patients with chronic diseases imposing significant social burdens on current society, this product allows for the habituation of anti-aging habits and active responses to early stage diagnoses of diseases through technological innovations in wearable devices, and it assists users in maintaining healthy lifestyles through long-term data storage and management.
| Abbreviation | ||
| ECG | = | Electrocardiogram |
| HRV | = | Heart rate variability |
| NSR | = | Normal sinus rhythm |
| CAD | = | Computer aided diagnosis |
Disclosure statement
The authors declared no potential conflicts of interest with respect to the research, authorship, and/or publication of this article.
Additional information
Funding
References
- Zbroch E, Musiałowska D, Koc-Zorawska E, et al. Age influence on renalase and catecholamines concentration in hypertensive patients, including maintained dialysis. Cia. 2016; 11:1545–1550.
- Hao Y, Foster R. Wireless body sensor networks for health-monitoring applications. Physiol Meas. 2008; 29:R27–R56.
- Newman JD, Turner AP. Home blood glucose biosensors: a commercial perspective. Biosens Bioelectron. 2005; 20:2435–2453.
- Zimetbaum PJ, Josephson ME. The evolving role of ambulatory arrhythmia monitoring in general clinical practice. Ann Intern Med. 1999; 130:848–856.
- Gupta R, Mitra M. Wireless electrocardiogram transmission in ISM band: an approach towards telecardiology. J Med Syst. 2014; 38:90.
- Lee J, Kwon H, Seo J, et al. Conductive fiber-based ultrasensitive textile pressure sensor for wearable electronics. Adv Mater (Deerfield Beach, Fla). 2015; 27:2433–2439.
- Teichmann D, Kuhn A, Leonhardt S, et al. Human motion classification based on a textile integrated and wearable sensor array. Physiol Meas. 2013; 34:963–975.
- Yang G, Chen J, Xie L, et al. A hybrid low power biopatch for body surface potential measurement. IEEE J Biomed Health Inform. 2013; 17:591–599.
- Sher M, Zhuang R, Demirci U, et al. Paper-based analytical devices for clinical diagnosis: recent advances in the fabrication techniques and sensing mechanisms. Expert Rev Mol Diagn. 2017; 17:351–366.
- Kim SJ, Lee DS, Kim IG, et al. Evaluation of the biocompatibility of a coating material for an implantable bladder volume sensor. Kaohsiung J Med Sci. 2012; 28:123–129.
- McBride ME, Marino BS, Webster G, et al. Amiodarone versus lidocaine for pediatric cardiac arrest due to ventricular arrhythmias: a systematic review. Pediatr Crit Care Med. 2017; 18:183–189.
- Gupta S, Figueredo VM. Tachycardia mediated cardiomyopathy: pathophysiology, mechanisms, clinical features and management. Int J Cardiol. 2014; 172:40–46.
- Karimipour A, Homaeinezhad MR. Real-time electrocardiogram P-QRS-T detection-delineation algorithm based on quality-supported analysis of characteristic templates. Comput Biol Med. 2014; 52:153–165.
- Te AL, Lin YJ, Chen YY, et al. Increased risk of ventricular tachycardia in patients with sarcoidosis during the very long term follow-up. Int J Cardiol. 2017; 228:68–73.
- Lee AK, Deyell MW. Premature ventricular contraction-induced cardiomyopathy. Curr Opin Cardiol. 2016; 31:1–10.