
Abstract
Ventricular assist devices (LVADs) are increasingly recognized for supporting blood circulation in heart failure patients who are non-transplant eligible. Because of its volume, the traditional pulsatile device is not easy to implant intracorporeally. Continuous flow LVADs (CF-LVADs) reduce arterial pulsatility and only offer continuous flow, which is different from physiological flow, and may cause long-term complications in the cardiovascular system. The aim of this study was to design a new pulsatile assist device that overcomes this disadvantage, and to test this device in the cardiovascular system. Firstly, the input and output characteristics of the new device were tested in a simple cardiovascular mock system. A detailed mathematical model was established by fitting the experimental data. Secondly, the model was tested in four pathological cases, and was simulated and coupled with a fifth-order cardiovascular system and a new device model using Matlab software. Using assistance of the new device, we demonstrated that the left ventricle pressure, aortic pressure, and aortic flow of heart failure patients improved to the levels of a healthy individual. Especially, in state IV level heart failure patients, the systolic blood pressure increased from 81.34 mmHg to 132.1 mmHg, whereas the diastolic blood pressure increased from 54.28 mmHg to 78.7 mmHg. Cardiac output increased from 3.21 L/min to 5.16 L/min. The newly-developed assist device not only provided a physiological flow that was similar to healthy individuals, but also effectively improved the ability of the pathological ventricular volume. Finally, the effects of the new device on other hemodynamic parameters are discussed.
1. Introduction
A left ventricular assist device (LVAD) is a mechanical device that is implanted in patients with congestive heart failure (HF) to assist the heart in pumping blood through the circulatory system. Since its first surgical implantation in the 1960 s, LVADs began to play an important role in the treatment of HF, either as a bridge to transplantation (BTT), or as a bridge to recovery (BTR). Lately, there is also mention of permanent implantation (destination therapy) [Citation1]. Presently, two types of LVADs are available for clinical usage. These include, continuous flow LVADs (CF-LVADs) and pulsatile LVADs (P-LVADs). CF-LVADs usually provide continuous blood flow that is different from physiological flow in that it has a reduced pulsatility. In most situations, they are much smaller and lighter than P-LVADs, and can be implanted intracorporeally. The better outcomes obtained can be attributed to device-related benefits. In addition, a smaller device size also allows for better protection against infections [Citation2,Citation3]. Nowadays, LVADs are widely accepted and widely applied in the clinic. However, the reduced pulsatility may cause long-term complications, such as aortic valve insufficiency and gastro-intestinal bleeding, which are major issues. Device-associated bleeding is the main reason of morbidity. Furthermore, there is a lot of discussion and controversy about the non-pulsatility flow and the effects on organ perfusion [Citation3]. Several researchers believed that the pulsatile flow should be preserved. In their studies, researchers tried to change the speed of the continuous flow and enhanced the pulsatility to synchronize with the cardiac cycle. Varying-speed support improved the perfusion and unloading of the left ventricle compared to constant-speed support [Citation4,Citation5]. However, varying-speed support also has potential adverse effects, such as blood damage due to increased shear stress caused by the frequent accelerating impeller. In addition, long-term use of varying-speed will reduce motor life, and may produce a heat impact on the blood, whereas continuous flow pumps must be kept working to prevent backflow.
Traditional pulsatile pumps are larger and heavier compared to CF-LVADs. They also need additional attachments to work properly, such as artificial valves. Although traditional pumps have many shortcomings, they can produce physiological flow. Recently, several new pulsatile devices have been designed, such as C-Pulse [Citation6,Citation7], LibraHeart pulsatile LVAD system [Citation8] and Rotary Piston Blood Pumps [Citation9,Citation10]. Therefore, it is of interest to further study the pulsatile pump.
In this study, a new pulsatile assist device was developed, based on overcoming the challenges associated with traditional pulsatile pumps. Our goals were to test the effectiveness of the pump and its impact on the pathological heart.
2. Materials and methods
2.1 An intraventricular assist device
In this study, an intraventricular assist device (iVAD) was generated. The iVAD is a new pulsatile balloon pump that is driven by a pneumatic drive unit or an electric drive unit and is implanted in the ventricle without the use mechanical heart valves. The minimum volume of the iVAD is about 3 cm3.
shows the principal components of the pump and their functions. The iVAD consists of a balloon pump, a pacemaker, and a drive unit. The balloon pump is implanted into the left ventricle starting from the apex. It is made of multi-layer medical polyurethane (PU) and silicone plastic polymer materials, such as the ellipsoid and has an opening mouth at the bottom that helps the ventricle pump blood. The innermost layer of the balloon is in direct contact with gas (air or He2). Nevertheless, the outermost layer contacts with blood and is covered with biological material. It has the best blood and tissue compatibility and is made from medical PU from Bayer (Leverkusen, Germany). The iVAD has a smaller implanted volume, creates a smaller operation wound, and the pulsatile flow it creates is similar to physiological flow. Additionally, unlike the continuous operation of CF-LVADs, iVADs can work intermittently. Especially, when the ventricle does not require assistance, there are no potential problems on the ventricle apart from immune responses and thrombosis.
Figure 1. Schematic of a typical intra-ventricular assist device.
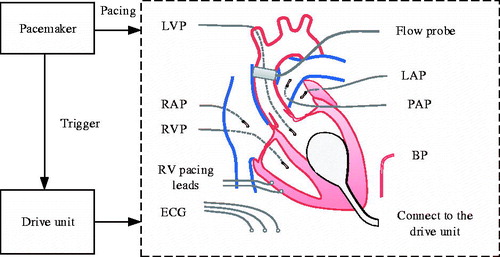
The working approach of an iVAD is relatively similar to that of an IABP [Citation11,Citation12] and a C-Pulse [Citation13]. The inflated and deflated phases are in the opposite direction. Co-pulsation of the iVAD synchronizes with the electrocardiogram (ECG) and aortic incisure points or phonocardiographs. The R wave peaks of the ECG are used by the pacemaker to trigger pulses for controlling the drive unit that drives pump inflation, and aortic incisure points trigger the iVAD deflation. In some patients, the points are not obvious and therefore the phonocardiograph is used to trigger deflation. Aortic incisure points and the phonocardiograph represent the time of aortic valve closure.
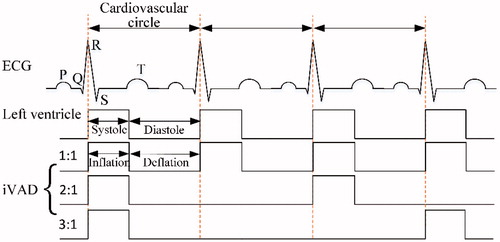
illustrates the pulsatile time relationship between the left ventricle and the iVAD. In addition, the drive modes mainly include 1:1, 2:1 and 3:1 (ventricular beats: pump beats). The experimental time of systole was defined from the relationship: ts = 0.413 - 0.0017HR, in which ts represents the systolic time, (seconds) and HR represents the heart rate (beats/min).
Figure 2. Illustration of the pulsatile rhythm of the left ventricle and the iVAD.
2.2 Modeling the cardiovascular system
The complexity of the heart, which is a time-varying distributed parameter in a nonlinear system, brings various challenges to its mathematical model. In the past, numerous dynamical models of varying degrees of complexity have been developed. For example, an eight-order hybrid model of the heart, which subdivides the human circulatory system into a number of lumped parameter blocks, including the pulmonary arterial and venous system as well as both ventricles has been developed [Citation14]. In addition, an eleventh-order model, which includes the resistance of peripheral blood vessels has been established [Citation15].
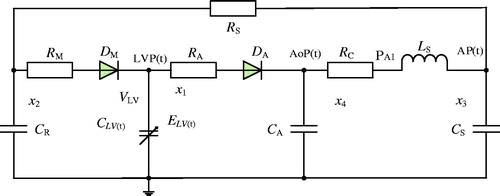
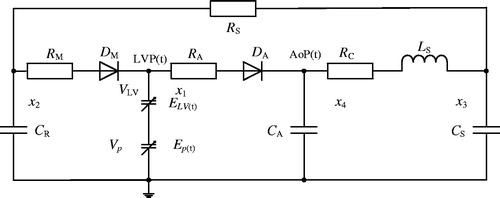
In this study, the relation between the left ventricle and the systemic circulation as well as the effects of the LVAD on the hemodynamics of both the left ventricle and the systemic circulation were investigated. Therefore, the right ventricle, pulmonary circulation, and some parts of the circulatory system, including blood vessels, were neglected. Moreover, a fifth-order lumped parameter electric hemodynamic of the heart was established to simulate the systemic circulation (). Using the fifth-order model, the behaviour of the left ventricle was modelled by means of a time-varying capacitance CLV(t), which is the reciprocal of the ventricle’s elastance function ELV(t). The elastance determines the change in pressure for a given change in volume within a chamber as described by Suga and Sagawa [Citation16]:
(1)
in which ELV(t) represents the time varying elastance (mmHg/ml), LVP(t) is the left ventricular pressure (LVP, mmHg), LVV(t) is the left ventricular volume (ml), and V0 is a reference volume (ml), the theoretical volume in the ventricle was set at zero pressure. In our study, we used:
(2)
in which En(tn) represents the normalized function referred to as the “double hill” function [Citation17]:
(3)
Figure 3. The cardiovascular circuit model.
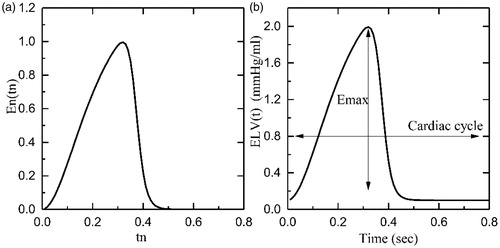
In the above formula, En(tn) represents the normalized time-varying elastance, tn=t/Tmax, Tmax=0.2 + 0.15tc and tc is the cardiac cycle interval, tc=60/HR, where HR represents the heart rate. The constants Emax and Emin are related to the end-systolic pressure volume relationship (ESPVR) and the end-diastolic pressure volume relationship (EDPVR), respectively. shows the plot of En(tn) and ELV(t) for a healthy heart with Emax=2 mmHg/ml, Emin=0.06 mmHg/ml, and rate of 75 beats per minute (bpm).
Figure 4. Graphs indicating the elastance function: (a) Normalized elastance; (b) Healthy heart elastance.
In the model, preload and pulmonary circulation are represented by the capacitance CR; the aortic compliance is represented by the capacitance CA, and the afterload is represented by the four-element Windkessel model [Citation18] comprising RC, Ls, CS, and RS. The mitral and aortic valves are represented by two non-ideal diodes consisting of a resistance RM and ideal diode DM, and resistance RA and ideal diode DA.
By selecting the state variables listed in as hemodynamic variables, and by using the basic circuit analysis methods, such as Kirchhoff’s voltage law (KVL) and Kirchhoff’s current law (KCL), the following state equations for the cardiovascular circuit model can be derived:
(4)
Table 1. Variables in the cardiovascular system model.
In above equation, r(ξ) represents the ramp function, . lists the various system parameters and their typical associated values. Three different methods were used to validate this model [Citation19].
Table 2. Model parameters.
2.3 Modeling of the iVAD
The Novacor LVAS was accurately modelled as the function of the pressure-volume relationship by Yi-choung et al. [Citation20]. The time varying elastance determines the relationship between pressure and volume of the ventricle and was defined by Suga and Sagawa [Citation16]. Similarly, the pulsation of the iVAD was defined as the time varying elastance increased the ventricular time varying elastance with ignoring resistance and inertance. Using a similar method, the elasticity of the iVAD was defined as follows:
(5)
in which Ep(t) represents the time varying elasticity of iVAD (mmHg/ml), Pp(t) is the iVAD’s output pressure (mmHg), Vp(t) is the iVAD’s output volume (ml), Vp0 is the theoretical volume in the ventricle at zero pressure.
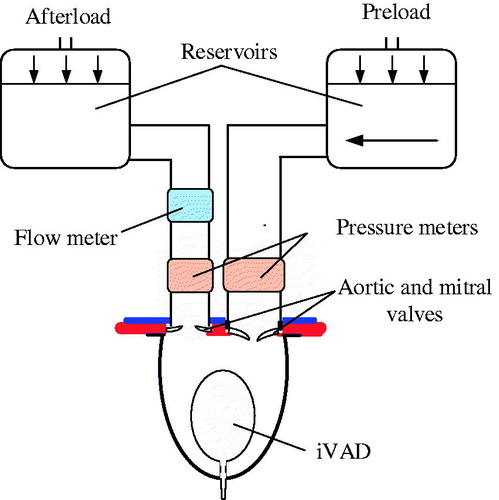
The iVAD was implanted in a mock circulation system as shown in . This system included one chamber (left ventricle) and two fluid reservoirs. This mock loop mimics the systemic circulation, which represents the load of the iVAD. The afterload ranged from 80 to 120 mmHg, and the preload was 20 mmHg. The iVAD operated at 75 to 120 bpm at 15 bpm intervals to generate dynamic pump pressure and volume.
Figure 5. Schematic of a mock cardiovascular system.
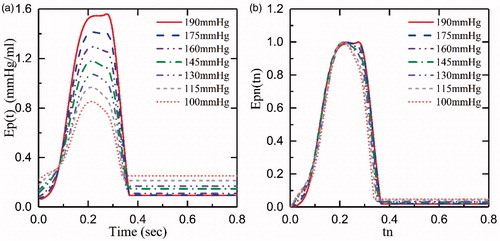
In this study, we only focused on the pump’s diastole function (the ventricular systole). shows the iVAD’s elastance (Ep(t) and the normalized elastance (normalized time and normalized amplitude, Epn(tn), which were obtained from experimental data at 75bmp and a drive pressure ranged from 100 mmHg to 190 mmHg. We concluded from the figure that the normalized elastance curves are similar. The normalized function was as follows:
(6)
in which Epmax represents the maximum of Ep(t), mmHg/ml; Epmin is the minimum of Ep(t), mmHg/ml; T Epmax and Epmin are related to the end-systolic pressure volume relationship and the end-diastolic pressure volume relationship but only in situations when the iVAD works. tn=0.8t/Ts, tn is the normalized time; Ts is the cardiac cycle (sec).
Figure 6. The elastance curves of the pump: (a) Ep(t) under different drive pressure; (b) Epn(tn).
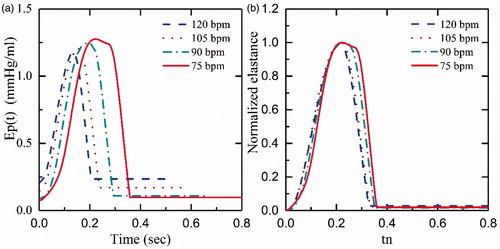
shows Ep(t) curves of the afterload from 80 mmHg to 120 mm Hg at 75bpm and 145 mmHg drive pressure. demonstrates that the afterload has less impact on Ep(t), which is in accordance with the data described by Kass et al. [Citation21]. In addition, we demonstrated the relationship between Ep(t) and different HR at the same drive pressure (145 mm Hg) and afterload (80 mm Hg) in . By increasing the HR from 75bpm to 120bpm, the maximum and the minimum of Ep(t) slightly decreased by 1.2 and increased by 0.2, respectively. However, as illustrated in , the shapes of the normalized curves are similar. Although a normalized elastance curve can be used to represent the elastance of iVAD at a different HR, there are minor errors compared with the original curve with the same Epmax and Epmin.
Figure 7. The Ep(t) and Epn(tn) of different afterload at 75bpm and 145 mmHg drive pressure: (a) Ep(t), iVAD’s elastance; (b) Epn(tn), the normalized elastance.
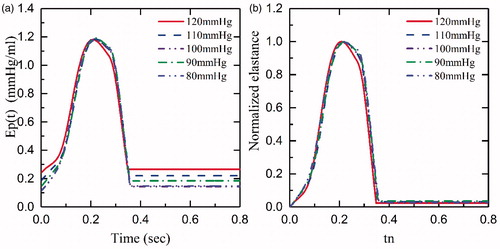
Figure 8. Ep(t), Epn(tn) curves of different heart rates: (a) Ep(t), iVAD’s elastance, (b) Epn(tn), normalized elastance.
In conclusion, although the Epn(tn) curves do not perfectly represent the Ep(t) of different HR, they do represent the pump’s elastance at a given HR. Therefore, a drive pressure of 145 mmHg was chosen to represent the characteristics of the elastance curve. The normalized function that refers to “double hill” as mentioned earlier, represents the left ventricle elastance. Cox et al. [Citation22] and Korakianitis et al. [Citation23] used the second order sine function to represent the elastance. We attempted to fit the normalized elastance with “double hill” function and sine function, however this was not successful. Too many errors were presented when “double hill” function fitting was used, and the sum of squares due to error (SSE) was 1.367, and the coefficient of determination (R-square) was 0.9729, when a piecewise equation of the fifth order sine function fitted the curve. After trying several function fittings, we found that the third order Gaussian function was the best fit for presenting our data. Therefore, the third order Gaussian function was used to represent the elastance of the iVAD. presents the Epn(tn) curve as well as the fitting curve of the third Gaussian function, which was as follows:
(7)
Figure 9. Epn(tn) showing 75 bpm and 145 mmHg curves: (a) Epn(tn); (b) fitting curve.

The function fits the curve well and shows values of R-square 0.9983 and SSE: 0.1868. a1, a2 and a3 represent the height of the peaks (a1=0.443, a2=0.325, a3=0.946); b1, b2 and b3 are the position of the centre of the peak (b1=0.274, b2=0.312, b3=0.195); c1, c2 and c3 are the standard deviation (c1=0.047, c2=0.0343, c3=0.0874). The root mean square (RMS) width is also presented.
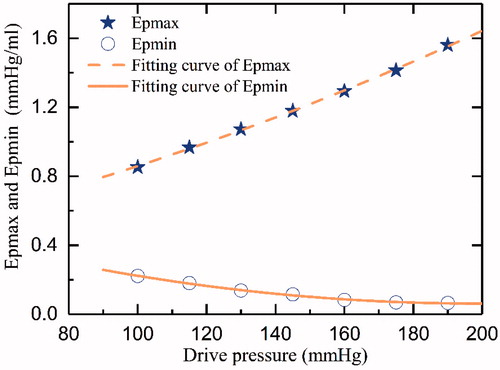
Moreover, shows the relationship between Epmax, Epmin, and the drive pressure. Two functions were used to estimate the data by the fitting method. The functions were as follows:
(8)
(9)
in which Pd represents the drive pressure (mmHg).
Figure 10. Epmax, Epmin curves of drive pressure.
2.4 Testing the iVAD
To establish the interaction between the iVAD and the cardiovascular system, the iVAD model was connected with the cardiovascular model for simulation purposes. shows the equivalent electric circuit of the combined cardiovascular model. The addition of the iVAD to the model adds an extra state variable Ep(t), which represents the pulsatile capacity of the iVAD. According to the criteria of American New York Heart Association, heart function is classified into levels I-IV (level I: Emax=1.05 mmHg/ml, level II: Emax = 0.835 mmHg/ml, level III: Emax=0.713 mmHg/ml, level IV: Emax=0.630 mmHg/ml). In this study, these four levels of heart function were chosen, and coupled for simulation. Basic hemodynamic parameters were measured to evaluate the function of the ventricle, such as LVP, AoP, stroke volume (SV), cardiac output (CO) and EF. Furthermore, pulse pressure and the energy equivalent pulse pressure EEP = ∫AF×AoP dt/∫AF dt, mmHg) [Citation2] were used to evaluate pulsatility. Pulse pressure was calculated from the pressure waveform of the AoP (pulse pressure = Systolic blood pressure (SBP) – Diastolic blood pressure (SBP)).
Figure 11. The cardiovascular cycle model combined with iVAD.
The simulation was performed using Matlab Simulink (The MathWorks inc. 2014a, academic). The computer configurations as CPU: Core i3-3240, 3.4 GHz, RAM: 12 GB, and 64-bit operating system. The state-space equations of the cardiovascular system model and coupled model were solved using the ode45 (Dormand-prince) solver. The maximum step size of the variable-step was 0.0001 s, the minimum step size was set to auto, and the relative error tolerance was set to 0.001. All simulations reached a periodic solution at a maximum of 20 s of simulation time. Results are given per cardiac cycle. All figures were prepared by Matlab.
3. Results
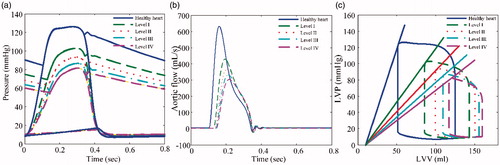
The hemodynamic waveforms and pressure–volume (PV) loops of HF (I-IV level) that were obtained from the simulation are shown in , which shows that the amplitudes of LVP, AoP, and aortic flow (AF) gradually decrease with increasing HF. Moreover, the PV-loops gradually shift to the right and the area of PV-loops show a dramatic reduction (Figure. c). The simulation results are consistent with the characteristics of HF, and experimental data reported by Liu et al. [Citation24].
Figure 12. Hemodynamic parameters of the 4 categories of heart failure: (a) Pressure, (b) Aortic flow, (c) Pressure-volume loops.
presents the hemodynamic curves of the simulation when the left ventricle was assisted by the iVAD under healthy heart conditions and 4 categories of HF. The drive pressure of the iVAD was 145 mmHg (Epmax=1.18, Epmin=0.109) at 75bpm. Compared with , the maximum values for LVP, AoP, and AF were significantly increased, and are similar to the values of a healthy heart. indicates that the PV-loops show a shift to the left, the area is larger, and the slope of the end-diastolic pressure-volume relationship (ESPVR) becomes larger. Characteristics of hemodynamic parameters of the left ventricle are presented in . The parameters were used to evaluate cardiac function, including SBP, DBP, mean aortic pressure (MAP), CO, EF, and MAXd(LVP)/dt. In summary, and show that, although the effects of assistance by iVAD were not significant in a healthy heart, HF (I-IV levels) were significant, especially hemodynamic parameters for level IV HF patients, which reached the levels of a healthy heart. The SBP increased from 81.34 mmHg to 132.1 mmHg (an increase of 62.4%), and DBP increased from 54.28 mmHg to 78.7 mmHg (an increase of 45%), respectively. In addition, the CO increased from 3.21 L/min to 5.16 L/min (an increase of 60.75%), respectively. From the perspective of hemodynamic parameters, the simulation results show that the iVAD has a sufficient effect on patients with HF. The more severe the HF, the more significant the effects were.
Figure 13. Hemodynamic parameters after iVAD assistance for the 4 categories of heart failure: (a) Pressure, (b) Aortic flow, (c) Pressure-volume loops.
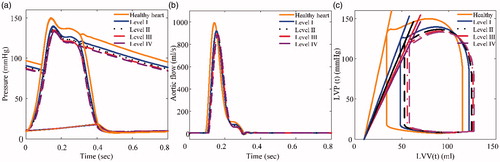
Table 3. Comparison of the simulation results of iVAD power off with iVAD power on.
4. Discussion
Compared with traditional pulsatile LVADs, an iVAD can overcome the shortcomings of size, weight, and multiple attachments. However, the larger drive size is still a challenge. Therefore, it is of utmost importance that the size gets improved like the drive unit of the C-Pulse heart assist system [Citation7], which is smaller and portable. In addition, compared with CF-LVADs, an iVAD can offer better pulsatile flow, which is similar to physiological flow, and operate at lower reciprocations per minute. How-ever, the afterload has a larger effect on the output flow of the iVAD compared to that of CF-LVADs. By increasing the afterload, the output flow of the iVAD decreases significantly.
During modeling of the iVAD, we found that the elastance function of the iVAD cannot be represented by the third order Gaussian function, due to the large number of errors when HR is less than 50bpm or more than 150bpm. When HR < 50 bpm, the balloon of the iVAD undergoes elastic deformation. In addition, when the HR > 150 bpm, the time of inflation is too short to reach the set steady-state pressure. Therefore, the function is only valid when HR is between 50bpm and 150bpm. Additionally, when the step size of the calculated model is set too high (for example 0.1s), the convergence time is reduced, and many details of the waveforms may be missed.
In the simulation experiments, the iVAD improved the values for LVP, SBP, DBP, and flow in the pathological heart. shows that, after assisting, the hemodynamics reached normal, healthy heart levels. The effects of iVAD on the right ventricle and the pulmonary circulation are not clear. Because in this study, the fifth-order lumped parameter dynamical model only embodies the systemic circulation compared with the complete cardiovascular system, which does not simulate the entire circulation. Especially, left atrial pressure changes slightly, thereby lacking pulmonary circulation. Based on the studies performed by Cox et al. [Citation22] and Moscato et al. [Citation25], we can qualitatively predict the hemodynamic effects of iVAD support. Generally, the cavity volume of the pathological ventricle is increased, which results in a decreased CO followed by a decreased perfusion (). Regardless of the neuron modulation of HR and peripheral resistance, a remarkable decrease was found in the end-diastolic volume, and increases were found for SV, CO, and SBP. According to the simulated data [Citation22], which lead to an increase of right ventricle preload, SV and right ventricular SBP, also the CO will increase to a new level. Hence, the right ventricle will not undergo failure when the left ventricle fails. In HF patients, the left atrial pressure increased due to an increased cavity volume and perfusion pressure. Increased pre-load may lead to pulmonary edema. After iVAD support, arterial blood flow into the left atrium increased. During diastole, deflation of iVAD will decrease the afterload of the left atrium, and there is sufficient volume for the inflow of atrial blood from left atrium. Therefore, left atrial pressure will decrease. However, when the deflation rate is too fast, the diastolic pressure in the left ventricle will create a vacuum, and blood in the left atrium and pulmonary veins will quickly flow into the left ventricle, causing left atrium and pulmonary vein collapse. Therefore, it is important to control the deflated rate. To further study the effects of iVAD assisting, a complete cardiovascular system model would be needed. Additionally, Ursino et al. [Citation26–28] studied the cardiovascular response, whereas Bozkurt et al. [Citation29] designed the baroreflex model to improve control of the LVAD pulsatility. These studies suggest that an increase in arterial pressure using iVAD assisting leads to a decrease in HR and system peripheral resistance, which are beneficial for recovery of the circulation.
shows the parameters of pulse pressure and EEP, which evaluate the ventricular pulsatility. Using iVAD support, pulse pressure and EEP are significantly increased. Compared with the pulsatile mode of the rotary pumps [Citation2], the pressure and EEP are increased. Thus, in respect of pulsatility, iVAD is better, and improved the pulsatility of the pathological ventricle.
Data derived from left ventricular PV loops inform about unloading, and the area represents left ventricular stroke work. Under CF-LVAD support [Citation30], PV loops shifted to the right, the area decreased, and cavity volume increased. This may be due to reduced SBP and SV, because of continuous unloading of the heart chamber by the pump. On the contrary, under iVAD support, PV loops shifted to the left and the area increased, because of differences in operation principles. In CF-LVAD, a parallel bypass assisted approach, the majority of blood pumps into the aorta via the bypass. The iVAD used a series of methods within the left ventricle, however the blood entered the aorta through the convention route. and demonstrated that the cavity volume decreased and the PV loop area increased due to the iVAD. However, the real PV loops area of pathological ventricle may be decreased due to an increasing LVP from the iVAD support. Thus, to reduce the impact on the sick ventricle, such as the load, the inflated phase of iVAD will have to be delayed. The iVAD only supports during a rapid ejection period and slow ejection phase, and does not work efficiently or decreases the pressure rise rate of inflation during the isovolumetric systole period. Moreover, the side effects that are created by this type of support may need to be further investigated in animal models.
5. Conclusions
In this study, our novel iVAD was tested in a mock circulatory system and the model used was established by using the theory of ventricular elastance. The coupled model was obtained by combining a fifth-order model of hemodynamics of the cardiovascular system with the iVAD model. The simulated results showed that the iVAD generated pulsatile flow that is similar to physiological flow and effectively improved the LVP, SBP, and CO of level I-IV HF patients, in which hemodynamics reached healthy levels. Especially, in level IV HF patients, the SBP and DBP reached 132.1 mmHg and 78.7 mmHg and increased by 62.4% and 45%, respectively. Moreover, the CO raised from 3.21 L/min to 5.16 L/min (an increase of 60.75%). Also, other hemodynamic parameters improved. The iVAD dramatically improved the stroke ability of a HF patient’s heart. Furthermore, effects of the right ventricle, pulmonary circulation, HR, and peripheral resistance were discussed under the iVAD support. Although the results are promising, additional animal experiments and clinical studies would be required to investigate the underlying mechanisms involved.
Disclosure statement
No potential conflict of interest was reported by the author(s).
References
- Reul HM, Akdis M. Blood pumps for circulatory support. Perfusion. 2000;15:295–311.
- Ando M, Nishimura T, Takewa Y, et al. Electrocardiogram-synchronized rotational speed change mode in rotary pumps could improve pulsatility. Artif Organs. 2011;35:941–947.
- Bozkurt S, van Tuijl S, Schampaert S, et al. Arterial pulsatility improvement in a feedback-controlled continuous flow left ventricular assist device: an ex-vivo experimental study. Med Eng Phys. 2014;36:1288–1295.
- Huang F, Ruan X, Fu X. Pulse-pressure-enhancing controller for better physiologic perfusion of rotary blood pumps based on speed modulation. Asaio J. 2014;60:269–279.
- Ising M, Warren S, Sobieski MA, et al. Flow modulation algorithms for continuous flow left ventricular assist devices to increase vascular pulsatility: a computer simulation study. Cardiovasc Eng Tech. 2011;2:90–100.
- Rame JE, Georgakopoulos D, Pomfret D, et al. Arterial and cardiac hemodynamics in advanced hf patients implanted with the c-pulse counterpulsation device: implications for myocardial recovery. Circulation. 2015;132:A15860-A15860.
- Zeriouh M, Sabashnikov A, Bowles CT, et al. Full-support LVAD implantation in a C-pulse heart assist system recipient with deteriorating chronic heart failure: is it feasible and safe? Asaio J. 2016;62:E55–EE7.
- Choi SW, Nam KW, Lim KM, et al. Effect of counter-pulsation control of a pulsatile left ventricular assist device on working load variations of the native heart. BioMed Eng Online. 2014;13:1–11.
- Wappenschmidt J, Autschbach R, Steinseifer U, et al. Rotary piston blood pumps: past developments and future potential of a unique pump type. Expert Rev Med Devices. 2016;13:759–771.
- Wappenschmidt J, Sonntag SJ, Buesen M, et al. Fluid dynamics in rotary piston blood pumps. Ann Biomed Eng. 2017;45:554–566.
- Ferrari G, Khir AW, Fresiello L, et al. Hybrid model analysis of intra-aortic balloon pump performance as a function of ventricular and circulatory parameters. Artif Organs. 2011;35:902–911.
- Khir AW, Bruti G. Intra-aortic balloon shape change: effects on volume displacement during inflation and deflation. Artif Organs. 2013;37:E88–E95.
- Slaughter MS, Cecere R, Sun B, et al. C-Pulse (R) system extra-aortic counterpulsation for heart failure: driveline infections and management. J Heart Lung Transplant. 2015;34:S224–S22S.
- Giridharan GA, Skliar M, Olsen DB, et al. Modeling and control of a brushless DC axial flow ventricular assist device. Asaio J. 2002;48:272–289.
- Wu Y, Allaire PE, Tao G, et al. Modeling, estimation, and control of human circulatory system with a left ventricular assist device. IEEE Trans Contr Syst Technol. 2007;15:754–767.
- SUGA H, SAGAWA K. Instantaneous pressure-volume relationships and their ratio in the excised, supported canine left ventricle. Circ Res. 1974;35:117–126.
- Stergiopulos N, Meister JJ, Westerhof N. Determinants of stroke volume and systolic and diastolic aortic pressure. Am J Physiol. 1996;270:H2050.
- Kind T, Faes TJ, Lankhaar JW, et al. Estimation of three- and four-element windkessel parameters using subspace model identification. IEEE Trans Biomed Eng. 2010;57:1531–1538.
- Simaan MA, Ferreira A, Chen S, et al. A dynamical state space representation and performance analysis of a feedback-controlled rotary left ventricular assist device. IEEE Trans Contr Syst Technol. 2009;17:15–28.
- Yu YC, Boston JR, Simaan MA, et al. Pressure-volume relationship of a pulsatile blood pump for ventricular assist device development. Asaio J. 2001;47:293–301.
- Kass DA, Maughan WL. From 'Emax' to pressure-volume relations: a broader view. Circulation. 1988;77:1203–1212.
- Cox LGE, Loerakker S, Rutten MCM, et al. A mathematical model to evaluate control strategies for mechanical circulatory support. Artif Organs. 2009;33:593–603.
- Korakianitis T, Shi YB. A concentrated parameter model for the human cardiovascular system including heart valve dynamics and atrioventricular interaction. Med Eng Phys. 2006;28:613–628.
- Ling-ling L, Lan L, Kin-xi Q. Modeling and simulation of a Fifithe-order lump parameter cardiovascular system. Chinese J Biomed Eng. 2012;31:13–19.
- Moscato F, Arabia M, Colacino FM, et al. Left ventricle afterload impedance control by an axial flow ventricular assist device: a potential tool for ventricular recovery. Artif Organs. 2010;34:736–744.
- Ursino M. Interaction between carotid baroregulation and the pulsating heart: a mathematical model. Am J Physiol Heart Circ Physiol. 1998;275:H1733–H1H47.
- Ursino M, Magosso E. Acute cardiovascular response to isocapnic hypoxia. II. Model validation. Am J Physiol Heart Circ Physiol. 2000;279:H166–HH75.
- Ursino M, Magosso E. Acute cardiovascular response to isocapnic hypoxia. I. A mathematical model. Am J Physiol Heart Circ Physiol 2000;279:H149–HH65.
- Bozkurt S, van de Vosse FN, Rutten MCM. Improving arterial pulsatility by feedback control of a continuous flow left ventricular assist device via in silico modeling. Ijao. 2014;37:773–785.
- Bozkurt S, Safak KK. Evaluating the hemodynamical response of a cardiovascular system under support of a continuous flow left ventricular assist device via numerical modeling and simulations. Comput Math Methods Med. 2013;2013:986430.