
Abstract
EEG-based motor imagery is very useful in brain-computer interface. How to identify the imaging movement is still being researched. Electroencephalography (EEG) microstates reflect the spatial configuration of quasi-stable electrical potential topographies. Different microstates represent different brain functions. In this paper, microstate method was used to process the EEG-based motor imagery to obtain microstate. The single-trial EEG microstate sequences differences between two motor imagery tasks – imagination of left and right hand movement were investigated. The microstate parameters - duration, time coverage and occurrence per second as well as the transition probability of the microstate sequences were obtained with spatio-temporal microstate analysis. The results were shown significant differences (P < 0.05) with paired t-test between the two tasks. Then these microstate parameters were used as features and a linear support vector machine (SVM) was utilized to classify the two tasks with mean accuracy 89.17%, superior performance compared to the other methods. These indicate that the microstate can be a promising feature to improve the performance of the brain-computer interface classification.
Keywords:
1. Introduction
There has been an increasing interest in the research of human brain during different types of motor imagery [Citation1–3], as well as EEG-based motor imagery [Citation4,Citation5]. These researches not only provided deep insights to human brain function, but also laid the foundation of brain-computer interface (BCI) technology which has been a new method for human machine interaction [Citation5]. EEG-based motor imagery was widely used, because it provides high temporal resolution in milliseconds [Citation6]. EEG microstate analysis treats multichannel EEG as a series of momentary quasi-stable scalp electric potential topographies [Citation6]. These quasi-stable potential topographies are referred to as microstates [Citation7]. So brain electrical activity could be modeled as being composed of a time sequence of non-overlapping microstates [Citation6,Citation8]. This method could be utilized to reduce the recorded multichannel EEG signals to a sequence of prototypical topographical maps, which could capture important spatio-temporal properties of the signal [Citation9,Citation10]. A number of studies applied EEG microstate analysis have been reported in schizophrenia [Citation11–14], panic [Citation15], depression [Citation16], sleep [Citation17], personality [Citation18] and Alzheimer’s disease [Citation19]. However, few study analyzed EEG-based motor imagery microstate.
In this paper, the multichannel EEG-based motor imagery of left and right hand movement imagination were processed by EEG microstate analysis which could extract rich information in both temporal and spatial domains. The microstate sequences of left and right hand motor imagery were compared across the average of 9 subjects. The aim of the research was to reveal the differences between different brain activities related to left and right hand motor imagery. This could provide a new spatial-temporal feature for BCI classification.
2. Materials and methods
2.1 Data description
The EEG data used in this paper were datasets 2a from BCI Competition IV [Citation20]. The data were recorded from 9 healthy subjects, each subject performed 6 sets of experiments. Each set consists of 48 trials (12 of imaging left hand movement, 12 for the right, 12 for both feet and 12 for tongue), a total of 144 trials per subject. The data were sampled with 250 Hz, bandpass-filtered between 0.5 Hz and 100 Hz and recorded by 22 electrodes, left mastoid as reference and the right mastoid as ground. In this paper, only 24 trials (12 of left hand movement and 12 of the right) were used in each set.
2.2 Data pre-processing
EEG Data were imported into MATLAB for preprocessing. ICA (EEGLAB toolbox version 13 b) was used to eliminate eye movement artifacts and other noise by most conservative criteria. Then the data were averaged re-referenced and bandpass filtered to 8-15 Hz which mainly focused on the mu rhythm range of motor imagery [Citation4]. Finally, the artifact-free data were imported to CARTOOL [Citation9] for the microstate analysis.
2.3 EEG spatio-temporal microstate analysis
A similar methodology in literature [Citation15] was used to obtain the microstates. In this strategy (), multichannel EEG signals of left and right hand motor imagery from all subjects were transformed into a series of momentary potential topographies at Global Field Power (GFP) peaks that highest signal-to-noise ratio (SNR) could be reached [Citation9,Citation10], as shown in .
Figure 1. From EEG signal to microstates. (A) Original potential topography maps were extracted. (B) Original maps were analyzed by a cluster analysis to obtain four optimal classes of microstates. (C) Microstates sequences were obtained by fitting four classes microstates back to all data.
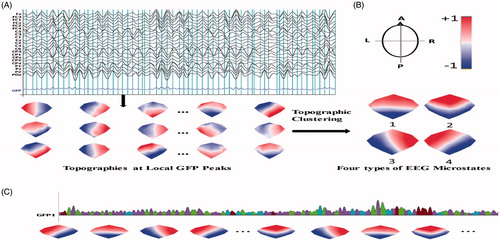
Then the original maps were processed by a modified spatial cluster analysis method known as the topographical atomize-agglomerate hierarchical clustering (TAAHC) [Citation6] to get microstate classes, as shown in . In TAAHC, four classes of microstate topography were used, because this number of classes nearly maximized the common variance over 9 subjects using a cross validation criterion in our data and this number has previously been found to be optimal [Citation6,Citation10,Citation22–23]. Using the clustered four microstate maps as templates, entire data were assigned to one of the 4 microstate classes according to maximal spatial correlation to the four microstate maps, as shown in . Using this methodology, every single-trial multichannel data were transformed to microstate sequences. There were about 75 microstates in a single trial data.
To compare the single-trial EEG microstate differences between two motor imagery tasks – imagination of left and right hand movement, four microstate parameters were computed.
Mean Duration (MD): The mean length of time that one microstate keeps stable.
Time Coverage Ratio (TCR): Percentage in time coverage of one type of microstate.
Occurrence Per Second (OPS): Frequency of occurrence of one microstate.
Transition Probability (TP): Percent of transition from one microstate to another.
3. Results
Each subject performed 144 trials (72 for the left hand motor imagery while 72 for the right hand), and 9 subjects performed a total 1296 trials (648 for the left while 648 for the right). For the parameters of microstate time series of all subjects between the two tasks, significant differences were tested with paired t-test. While P < 0.05, there is significance of difference.
Mean and standard deviation (SD) of microstate parameters (mean duration, time coverage ratio, and occurrence per second) for the two task as well as t-tests for group differences were shown in . One can find that microstate class 3 and class 4 showed significant differences of duration, occurrence and coverage between them.
Table 1. Microstate parameters.
For transition probability between the two tasks, Mean and SD for each task as well as t-tests for group differences was shown in . The result showed significant differences on transition probability of the one microstate to other states in left-hand motor imagery compared to right-hand (P < 0.05), except for the transition probability from class 1 to class 2 and from class 2 to class 1.
Table 2. Microstate classes transition probability[%].
3.1 Differences in mean duration
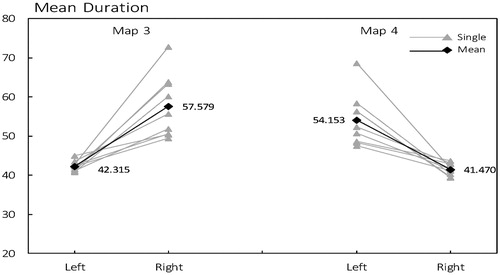
As shown in , individually, the duration of microstate class 3 was prominently longer in right compared to left, and is parallel to the mean values across all subjects (mean 42.315 ms in left and 57.579 ms in right). For microstate class 4, the situation was just on the contrary with higher mean in left (54.153 ms) than in right (41.470 ms).
Figure 2. Mean Duration of microstate class 3 and class 4 between left and right hand motor imagery. Gray line and triangle is the mean of each subject, dark line and diamond is the mean across all subjects.
3.2 Differences in occurrence per second
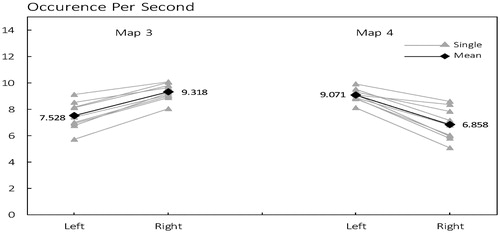
As shown in , microstate class 3 was observed with a mean frequency of 9.318 times per second in right, while would be reduced to 7.525 times per second in left; But microstate class 4 tend to have more occurrence in left (mean 9.071) than in right (mean 6.858).
Figure 3. Occurrence of microstate class 3 and class 4 between left and right hand motor imagery. Gray line and triangle is the mean of each subject, dark line and diamond is the mean across all subjects.
3.3 Differences in time coverage ratio
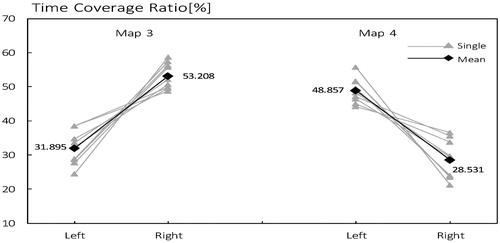
As shown in , the time coverage ratio of microstate class 3, not only within subject but also on the average level, is higher in right than in left (mean 53.208% and 31.895% respectively) too. On the contrary, TCR of microstate #4 is higher in left than in right (mean 48.857% and 28.531% respectively).
Figure 4. Time Coverage Ratio of microstate class 3 and class 4 between left and right hand motor imagery. Gray line and triangle is the mean of each subject, dark line and diamond is the mean across all subjects.
3.4 Transition probability between different microstates
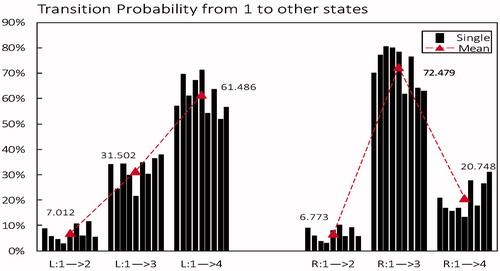
From microstate class 1 to other microstates: As shown in , in left, TP from microstate 1 to 4 is the highest (mean 61.486%); But in right, TP from microstate class 1 to class 3 is the highest (mean 72.479%). The difference demonstrates that microstate class 1 is more likely to transfer to state class 4 in left but more likely to transfer to state class 3 in right.
Figure 5. Transition probability from microstate class 1 to other states in left-hand motor imagery (L) compared to right-hand (R). Black column is the mean of each subject, red triangle is the average level across all subjects.
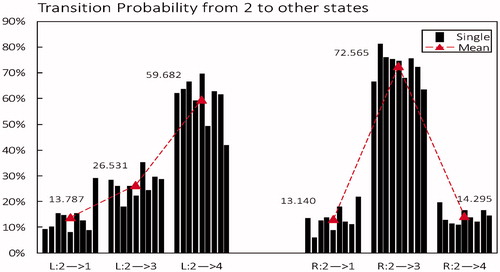
From microstate class 2 to other microstates: As shown in , For microstate class 2, as the case with microstate class 1 is more likely to transfer to state 4 in left (highest mean 59.682%) but more likely to transfer to state 3 in right (highest mean 72.565%).
Figure 6. Transition probability from microstate class 2 to other states in left-hand motor imagery (L) compared to right-hand (R). Black column is the mean of each subject, red triangle is the average level across all subjects.
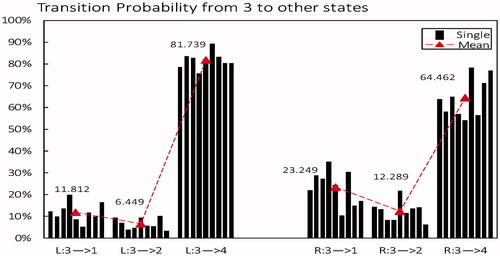
From microstate class 3 to other microstates: As shown in , whether in left or right, microstate class 3 is more likely to transfer to state 4, but with a higher mean value in left (81.739%) than in right (64.462%). Meanwhile, the decreased probability from 3 to 4 brought on an increased probability to 1 and 2 in right(mean 11.812% and 6.449% respectively) compared to left (mean 23.249% and 12.289% respectively).
Figure 7. Transition probability from microstate class 3 to other states in left-hand imaging movent (L) compared to right-hand (R). Black column is the mean of each subject, red triangle is the average level across all subjects.
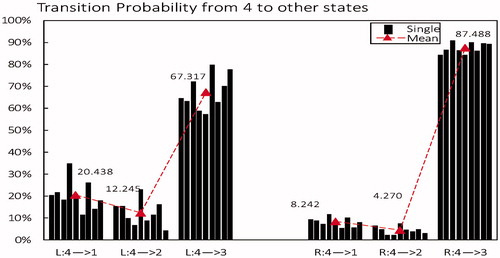
From microstate class 4 to other microstates: As shown in , differences in TP from microstate class 4 to other states between the two tasks were the opposite of those found in microstate 3. the decreased probability from state 4 to 3 (from 87.488% in right decreased to 63.317% in left) brought on an increased probability to 1 and 2 in left (mean 20.438% and 12.245% respectively) compared to right(mean 8.242% and 4.270% respectively).
Figure 8. Transition probability from microstate class 4 to other states in left-hand motor imagery (L) compared to right-hand (R). Black column is the mean of each subject, red triangle is the average level across all subjects.
3.5 Classification validation
Based on differences in microstate parameters between the two tasks, a linear kernel support vector machine (SVM) was used for the two tasks. The selected microstate parameter: MD, TCR, OPS of microstate class 3 and class 4, as well as TP of the one microstate to other microstates, except for the transition probability from class 1 to class 2 and from class 2 to class 1, were used as features for classification.
The performance of this classifier was estimated using a 10-fold cross-validation over the training data (288 trials, 144 for the left hand motor imagery while 144 for the right hand). Accuracy of the classification achieved 95.7%.
Then, this classifier was tested with 720 trials, 360 for each task. Because previous researchers have used several latest methods to classify the same data [Citation24], we present their classification accuracy and compared with ours (microstate is short for microstate method). From , microstate method has not only a higher mean accuracy but also a smaller SD (Standard Deviation), i.e. has a higher stability.
Table 3. Classification accuracy of different method and SD of 9 subjects.
4. Discussion
4.1 Kernel function effects for SVM
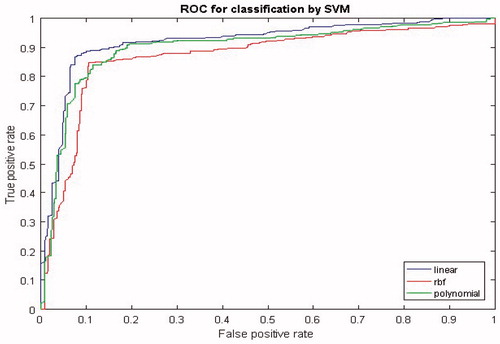
In this study, different kernel functions of SVM were compared. Linear kernel, κ(x,xi)=xTxi+c, polynomial kernel, κ(x,xi)=(xTxi+c)l, and radial basis function (RBF) kernel were employed, where c was an optional constant, l was the degree of polynomial and σ controlled the width of RBF function. The receiver operation characteristic (ROC) curve were computed, which showed the relationship between the true positive rate (sensitivity) and false positive rate (1 − specificity) for all possible threshold values. A ROC curve with an area of 1 indicated perfect classification performance where the sensitivity and specificity were both equal to one for all threshold values. shows the ROC curves of the SVM classifier that identified the two tasks of motor imagery with the linear, polynomial and RBF kernel functions. As one can see from , the linear kernel function performs best classification AUC (Area Under the Curve) 0.92 compared to the RBF AUC = 0.87 and polynomial AUC = 0.90 kernel functions.
Figure 9. ROC curves of the SVM classifier with the linear, polynomial and RBF kernel functions.
4.2 Microstate clustering methods
Microstate class templates could be computed using TAAHC and k-means. In [Citation25], they found that TAAHC and k-means clustering both give results with excellent test-retest reliability. The maps derived using both methods are highly similar. So, only TAAHC method as implemented by the CARTOOL was used in this study.
4.3 EEG rhythm
The ongoing brain electric activity of left-hand and right-hand motor imagery was transformed into temporal microstates of 4 classes that are distinguished by their different spatial distributions of electrical potential topography. So, the microstate parameters reflect the brain state difference between left-hand and right-hand motor imagery. Unlike the visual alpha rhythm, mu rhythm is away from visual impact, and can be changed by the activity of movement, movement preparation or imagery movement. Several studies have demonstrated that not only actual hand movement but also movement imagery leads to an energy change in the mu (8–13 Hz) and beta (13–28 Hz) rhythm known as event-related (de-)synchronization (ERD/ERS) [Citation4]. Microstates represent quasi-stable field topographies. Different motor imagery tasks have different effect on mu rhythm activity, so changes in brain mu rhythm activity in principle can alter microstate parameters. In our study, mu rhythm EEG microstates were focused. The significant differences have been found in microstate parameters between left-hand and right-hand motor imagery. The results further indicate that those four classes microstates that were extracted from motor imagery EEG truly reflect the temporal and spatial features of brain in these two activities. It appears that continuous brain electric activity is composed of a concatenation of building blocks. These building blocks can be represented by EEG microstates, which are defined by their quasi-stable potential landforms and reflect different modes, contents or steps of information processing [Citation26].
5. Conclusion
In this paper, the single-trial EEG microstate differences between two motor imagery tasks – imagination of left and right hand movement were analyzed. The microstate parameters - duration, time coverage and occurrence per second as well as the transition probability of the microstate sequences were shown significant differences. Based on differences in microstate parameters between the two tasks, a linear SVM were used to classify the two tasks. The classification results demonstrate that the microstate parameters of left and right motor imagery was different and could be used as features to classify which could greatly improve the performance.
Disclosure statement
No potential conflict of interest was reported by the authors.
Additional information
Funding
References
- Mulder T. Motor imagery and action observation: cognitive tools for rehabilitation. J Neural Transm. 2007;114:1265–1278.
- Sugata H, Hirata M, Yanagisawa T, et al. Alpha band functional connectivity correlates with the performance of brain–machine interfaces to decode real and imagined movements. Front Hum Neurosci. 2014;8:620.
- Vogt S, Di Rienzo F, Collet C, et al. Multiple roles of motor imagery during action observation. Front Hum Neurosci. 2013;7:807.
- Rahman MKM, Joadder MAM. A review on the components of EEG-based motor imagery classification with quantitative comparison. Appl Theory Comput Technol. 2017;2:1–36.
- Pfurtscheller G, Neuper C. Motor imagery and direct brain-computer communication. Proc IEEE. 2001;89:1123–1134.
- Pascual-Marqui RD, Michel CM, Lehmann D. Segmentation of brain electrical activity into microstates: model estimation and validation. IEEE Trans Biomed Eng. 1995;42:658–665.
- Lehmann D. Multichannel topography of human alpha EEG fields. Electroencephalogr Clin Neurophysiol. 1971;31:439–449.
- Lehmann D, Ozaki H, Pal I. EEG alpha map series: brain micro-states by space-oriented adaptive segmentation. Electroencephalogr Clin Neurophysiol. 1987;67:271–288.
- Brunet D, Murray MM, Michel CM. Spatiotemporal analysis of multichannel EEG: CARTOOL. Comput Intell Neurosci. 2011;2011:1–15.
- Michel CM, Seeck M, Landis T. Spatiotemporal dynamics of human cognition. News Physiol Sci. 1999;14:206–214.
- Koening T, Lehmann D, Merlo MC, et al. A deviant EEG brain microstate in acute, neuroleptic-naive schizophrenics at rest. Eur Arch Psychiatry Clin Neurosci. 1999;249:205–211.
- Andreou C, Faber PL, Leicht G, et al. Resting-state connectivity in the prodromal phase of schizophrenia: insights from EEG microstates. Schizophr Res. 2014;152:513–520.
- Nishida K, Morishima Y, Yoshimura M, et al. EEG microstates associated with salience and frontoparietal networks in frontotemporal dementia, schizophrenia and Alzheimer's disease. Clin Neurophysiol. 2013;124:1106–1114.
- Lehmann D, Faber PL, Galderisi S, et al. EEG microstate duration and syntax in acute, medication-naive, first-episode schizophrenia: a multi-center study. Psychiatry Res Neuroimaging. 2005;138:141–156.
- Kikuchi M, Koenig T, Munesue T, et al. EEG microstate analysis in drug-naive patients with panic disorder. PLoS One. 2011;6:e22912
- Strik W, Dierks T, Becker T, et al. Larger topographical variance and decreased duration of brain electric microstates in depression. J Neural Transm Gen Sect. 1995;99:213–222.
- Brodbeck V, Kuhn A, von Wegner F, et al. EEG microstates of wakefulness and NREM sleep. Neuroimage. 2012;62:2129–2139.
- Schlegel F, Lehmann D, Faber PL, et al. EEG microstates during resting represent personality differences. Brain Topogr. 2012;25:20–26.
- Strik WK, Chiaramonti R, Muscas GC, et al. Decreased EEG microstate duration and anteriorisation of the brain electrical fields in mild and moderate dementia of the Alzheimer type. Psychi-Atry Res Neuroimaging. 1997;75:183–191.
- Tangermann M, Müller KR, Aertsen A, et al. Review of the BCI Competition IV. Front Neurosci. 2012;6:1–31.
- Katayama H, Gianotti LR, Isotani T, et al. Classes of multichannel EEG microstates in light and deep hypnotic conditions. Brain Topogr. 2007;20:7–14.
- Lehmann D, Skrandies W. Reference-free identification of components of checkerboard-evoked multichannel potential fields. Electroencephalogr Clin Neurophysiol. 1980;48:609–621.
- Koenig T, Prichep L, Lehmann D, et al. Millisecond by millisecond, year by year: normative EEG microstates and developmental stages. Neuroimage. 2002;16:41–48.
- Yang Y, Chevallier S, Wiart J, et al. Time-frequency optimization for discrimination between imagination of right and left hand movements based on two bipolar electroencephalography channels. EURASIP J Adv Signal Process. 2014;1:1–18.
- Khanna A, Pascual-Leone A, Farzan F. Reliability of Resting-State Microstate Features in Electroencephalo-graphy. PLoS One. 2014;9:e114163.
- Lehmann D, Strik WK, Henggeler B, et al. Brain electric microstates and momentary conscious mind states as building blocks of spontaneous thinking: I. Visual imagery and abstract thoughts. Int J Psychophysiol. 1998;29:1–11.