
Abstract
Objectives: Coronary atherosclerotic plaques progress in a highly individual manner. Accurately predicting plaque progression will promote clinical management of atherosclerosis. The purpose of this study was to investigate the role of local biomechanics factors and vascular characteristics in coronary plaque progression and arterial remodeling.
Methods: Computed tomography angiography-based three-dimensional reconstruction of the native right coronary artery was performed in vivo in twelve patients with acute coronary syndrome at baseline and 12-month follow-up. The reconstructed arteries were divided into sequential 3-mm-long segments. Wall shear stress (WSS) and von Mises stress (VMS) were computed in all segments at baseline by applying fluid-structure interaction simulations.
Results: In total, 365 segments 3-mm long were analyzed. The decrease in minimal lumen area was independently predicted by low baseline VMS (−0.73 ± 0.13 mm2), increase in plaque burden was independently predicted by small minimal lumen area and low baseline WSS (6.28 ± 0.96%), and decrease in plaque volume was independently predicted by low baseline VMS (−0.99 ± 0.49 mm3). Negative remodeling was more likely to occur in low- (55%) and moderate-VMS (40%) segments, but expansive remodeling was more likely to occur in high-VMS (44%) segments.
Conclusions: Local von Mises stress, wall shear stress, minimal lumen area, and plaque burden provide independent and additive prediction in identifying coronary plaque progression and arterial remodeling.
1. Introduction
Although the whole coronary artery is exposed to the same systemic risk factors, each coronary plaque presents an independent natural progression history [Citation1]. Clinically, the most interest plaques are those may rapidly progress and become unstable. If these unstable plaques rupture, the subsequent thromboembolic event can be fatal. Hence, early identification of unstable plaques has very important significance and may promote the development of prevention strategies for reducing major cardiovascular events. Local vascular biomechanical factors and regional vascular characteristics play a major role in the behavior of individual plaques. Indeed, current computational fluid dynamics (CFD) studies and intravascular ultrasound (IVUS) studies have demonstrated that wall shear stress (WSS, a biomechanical factor), plaque burden, and lumen area (vascular characteristics) are associated with coronary disease progression [Citation2–6].
Most CFD studies consider WSS (fluid stress) to be the only biomechanical predictor of plaque progression; however, recent evidence suggests that von Mises Stress (VMS, structural stress) can also promote the atherosclerotic process and lead to plaque rupture [Citation7–11]. Additionally, coupled analysis of flow dynamics and structural deformation called fluid-structure interaction (FSI) can make estimates of these stresses more accurate.
As the gold standard for coronary quantitative analysis, IVUS has been widely used for identification of areas of local plaque development and progression [Citation3,Citation12], but it cannot be used in routine serial evaluation of atherosclerosis because it is invasive, costly, and not free of complications. With the development of computed tomography angiography (CTA), it is possible to evaluate quantitatively the progression of coronary atherosclerotic plaque in a noninvasive manner [Citation12–15]. To date, no longitudinal CTA-based study has been performed to assess the relationship between plaque progression and biomechanical factors.
Therefore, in this study we applied FSI analysis to investigate the affect of biomechanical factors and vascular characteristics in the coronary plaque progression and arterial remodeling based on noninvasive CTA images. The results from this study will provide insights on predicting plaque progression and then promote clinical management of atherosclerosis.
2. Methods
2.1. Study population
Twelve patients were retrospectively selected in the study, who were treated at Beijing Anzhen Hospital between April 2010 and May 2013. Inclusion criteria: age >18 years, presentation with an acute coronary syndrome (ACS, unstable angina or myocardial infarction), and right coronary artery (RCA) not planned for PCI. Exclusion criteria: previous PCI of RCA, coronary artery bypass surgery, renal failure, and significant hematologic disease. The study was approved by the ethical review committee of Anzhen hospital and written informed consent were provided by all patients.
2.2. Coronary CTA acquisition
At baseline and follow-up, coronary CTA was implemented using dual-source computed tomography (Somatom® Definition, Siemens, Forchheim, Germany) in accordance with the Society of Cardiovascular Computed Tomography guidelines [Citation16]. Scan parameters were as follows: beam collimation 64 × 0.625 mm, pitch factor 0.2–0.26, reconstruction slice thickness of 0.4 mm, tube voltage of 120 kV, and tube current ranging from 300 to 650 mAs. Using bolus tracking technique to synchronize the arrival of coronary constrast and the beginning of the scan. Axial CT images were rebuild with 0.5–0.75 mm slice thickness, 0.3–0.4 mm slice increment, and a moderate smooth convolution kernel. Motion-free datasets, mainly in the mid or end of diastole, were collected.
2.3. Coronary CTA data analysis
Coronary CTA analysis was manually performed on open-source software OsiriX (Pixmeo SARL, Bernex, Switzerland) by an experienced observer using a blinding method. The specific measurement process was as follows. First, manually extract the centerline starting at the ostium; generate the curved and straightened multiplanar reformatted (MPR) images based on the centerline; then render contiguous cross-sectional reconstructions using 1 mm slice thickness. For the accuracy detection of plaque and outer coronary wall boundaries, we set the window width to 155% of the average CT value within the lumen and the window level to 65% [Citation17,Citation18]. The whole reconstructed artery was divided into consecutive 3-mm segments from the ostium [Citation1,Citation2,Citation5]. All anatomically available segments free of side branches and located 1 mm away from adjacent side branches were measured; poor quality segments because of movement artifact were excluded from analysis. To ensure that the measurement segments were identical at baseline and follow-up, the coronary tree were segmented based on fixed anatomic landmarks, such as the main arterial branches.
Study imaging endpoints. We calculated the following parameters within each 3-mm-long segment at baseline and 12-month follow-up to determine the change in vascular characteristics:
Minimal lumen area (MLA): the narrowest lumen area in each segment
Plaque burden (PB): [(total vessel area – total lumen area)/total vessel area] × 100 in each segment
Plaque volume (PV): (total vessel area – total lumen area)/n ×3 mm in each segment, where n = number of cross-sections (4 for each segment) [Citation19].
Coronary remodeling. Remodeling was assessed based on vessel area at follow-up minus at baseline in serial studies [Citation12,Citation13,Citation20]. Positive Δvessel area was defined as positive remodeling, negative Δvessel area was defined as negative remodeling, and no significant change in vessel area was defined as absence of remodeling. In addition, positive remodeling were subdivided into expansive (Δvessel area divided by Δplaque area >1) or incomplete (Δvessel area divided by Δplaque area was between 0 and 1).
2.4. Analysis of FSI, WSS, and VMS
The three-dimensional model of the main artery of interest (right coronary artery) and arterial branches were reconstructed from baseline CTA images following the methodology proposed by Torii [Citation21]. The lumenal surface with stenosis was reconstructed with the open-source software VMTK (Orobix, Bergamo, Italy). As it's difficult to accurately identify the outer wall boundary from the CTA images by using three-dimensional reconstruction software, the wall was manually constructed as following. First, we constructed a lumen surface without stenosis by removing all plaques. Then, we extruded this surface outward by 0.5 mm to acquire the outer wall surface [Citation22]. Finally, the coronary artery wall was constructed based on the stenosis lumen surface (the inner wall surface) and the outer wall surface. An example of the artery model is shown in . The inlet and outlets were extended by five times of the diameter of the in/outlet cross sections, respectively. The reconstructed geometries were meshed with tetrahedron mesh for both the fluid and solid domains.
Figure 1. An example of fluid-structural interaction analyzed at baseline. The three-dimensional lumenal surface of the right coronary artery is created using coronary CTA. Inlet velocity and outlet pressure are entered into the fluid-structure interaction model to calculate wall shear stress and von Mises stress values.
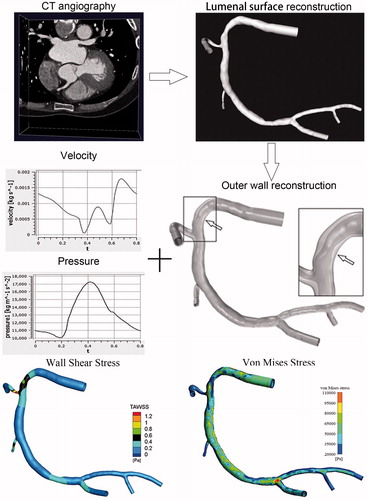
To create a more realistic simulation of the intravascular blood flow environment, we performed a two-way FSI simulation by implicit coupling of ANSYS CFX and ANSYS Mechanical (ANSYS, Canonsburg, PA, USA). The wall was assumed as a linear-elastic, isotropic, and homogeneous material with a density of 1150 kg/m3 and a Young’s modulus of 5E5 Pa. The blood was assumed to be incompressible Newtonian fluid with a density of 1050 kg/m3 and a dynamic viscosity of 0.0035 Pa × s. As the coronary flow profile was unable to measure directly, a typical inflow velocity waveform was assumed and the velocity across the inlet cross-sectional profile was uniform [Citation23]. A blood pressure waveform was applied at the outlet [Citation21,Citation24]. Finally, no-slip condition was assumed for the wall. Two continuous periods were simulated and the results of the second period were used for analysis.
After the pulsatile flow field in the region of interest was computed, we calculated time-averaged WSS and peak VMS of the lumenal surface. Although WSS and VMS are continuous, dynamic variables, for the purpose of this study they were divided into three grades (low, 0–33.3%; moderate, 33.3–66.7%; and high, 66.7–100%) based on the percentiles of their values for each individual subject. An example of the coronary CFD analysis process and WSS and VMS are displayed in .
2.5. Statistical analysis
Continuous variables are presented as mean ± standard error of the mean (SEM) or median and interquartile range, as appropriate. Categorical variables are presented as counts and percentages. To assess interobserver and intraobserver variability of coronary CTA parameters, a subset of four randomly selected coronary arteries was analyzed twice by the same observer, with a greater than 30-day interval between analyses, and once by a second observer. The interobserver and intraobserver variability are presented as intraclass correlation coefficients. In order to adjust the systematic error due to the clustering effect of coronary arterial segments within patients, the statistical methods were used as follows. First, the relationship between continuous independent variables and categorical dependent variables was assessed using mixed effect variance analysis with the patient to be the random factor. The Scheffé method was used for adjusting the p values for multiple comparisons. Second, the association between continuous independent variables and continuous dependent variables was evaluated by using linear mixed modeling. Third, the relationship between ordered categorical dependent variables and continuous independent variables was analyzed by mixed effect ordered logistic regression, and the Huber-White sandwich estimator was used to correct the clustering effect of coronary arteries within patients. When the p value in the univariate analysis was less than 0.15, the baseline continuous variables would considered to bring into the respective multivariate models. Subsequently, in the backward-stepping algorithm analysis, the independent variables with p < 0.15 were selected in the final model. All statistical analyses were two-tailed tests and it was statistical significant when p was less than 0.05. All statistical analyses were performed with Stata 13 (StataCorp LP, College Station, TX, USA) and IBM SPSS 22 (IBM Corp., Armonk, NY, USA).
3. Results
3.1. Baseline patient demographics
The native right coronary arteries of 12 patients were evaluated with ACS. The patients’ baseline characteristics are shown in . For left coronary arteries, four patients had previous PCI at baseline and the other eight underwent implantation of at least one stent a few days after undergoing baseline CTA. All patients’ right coronary arteries were native. At hospital discharge, all patients received routine secondary prevention, including antiplatelet, lipid-regulation, and antihypertensive therapies. The follow-up scan was performed a mean of 15 ± 8 months (median 12 months, IQR: 9–20 months) after the initial examination.
Table 1. Baseline demographics and clinical characteristics.
Three hundred sixty-five 3-mm-long segments of the reconstructed right coronary arteries were analyzed. Each segment was characterized by WSS and VMS values (defined as the averaged value in each 3-mm segment), MLA, plaque volume, plaque burden, and remodeling pattern. In order to analyze the serial anatomic changes, the baseline of each arterial segment was compared with that at follow-up.
3.2. Effect of baseline vascular characteristics on plaque progression
3.2.1. Change in MLA
The decrease in MLA at follow-up was independently related to baseline low VMS and small plaque volume (). Using baseline WSS as a categorical variable, low-WSS segments demonstrated a decrease in MLA (−0.79 ± 0.16 mm2) compared with moderate-WSS segments (0.09 ± 0.12 mm2; p < 0.001) or high-WSS segments (1.01 ± 0.38 mm2; p < 0.001) (). Similarly, low-VMS segments demonstrated a decrease in MLA (−0.73 ± 0.13 mm2) compared with moderate-VMS segments (−0.07 ± 0.16 mm2; p = 0.004) or high-VMS segments (0.35 ± 0.21 mm2; p < 0.001) ().
Figure 2. Effect of baseline WSS and VMS on vascular outcomes in coronary artery segments at follow-up. (A) WSS and change in minimal lumen area. (B) VMS and change in minimal lumen area. (C) WSS and change in plaque burden. (D) VMS and change in plaque burden. (E) WSS and change in plaque volume. (F) VMS and change in plaque volume. The p values refer to the univariate analysis and are adjusted for the clustering of segments within patients and for multiple comparisons. Error bars represent SEM. MLA = minimal luminal area; PB = plaque burden; PV = plaque volume; SEM = standard error of the mean; VMS = von Mises stress; WSS = wall shear stress.
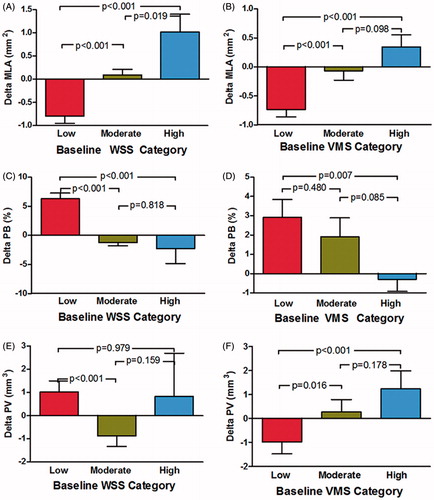
Table 2. Independent baseline predictors of the change in anatomic outcomes in 3-mm segments (n = 365).
3.2.2. Change in plaque burden
The increase of plaque burden at follow up was independently correlated with baseline small MLA and low WSS (). Over the 12-month follow-up, plaque burden increase was observed in baseline low-WSS segments (6.28 ± 0.96%) compared with moderate-WSS segments (−1.12 ± 0.57%; p < 0.001) and high-WSS segments (−2.32 ± 2.53%, p < 0.001) (). However, both low- and moderate-VMS segments demonstrated an increase in plaque burden compared with high-VMS segments (2.92 ± 0.92%, p = 0.007; and 1.91 ± 0.97%, p = 0.085, respectively) ().
3.2.3. Change in plaque volume
The increase in plaque volume at follow-up was independently associated with baseline large VMS and small plaque burden (). Baseline low-WSS segments demonstrated an increase in plaque volume (1.02 ± 0.48 mm3) compared with moderate-WSS segments (−0.88 ± 0.45 mm3, p < 0.001), but not with high-WSS segments (0.83 ± 1.86 mm3, p = 0.979) (). However, a decrease in plaque volume was observed in low-VMS segments (−0.99 ± 0.49 mm3) compared with moderate-VMS segments (0.27 ± 0.53 mm3, p = 0.016) and high-VMS segments (1.23 ± 0.76 mm3, p < 0.001), both of which demonstrated increased plaque volume ().
3.3. Effect of baseline vascular characteristics on arterial remodeling
Arterial remodeling pattern at follow-up was associated with VMS (p = 0.012) (). As shown in , negative remodeling was more likely to occur in low- and moderate-VMS segments and low- and moderate-WSS segments, but expansive remodeling was more likely to occur in high-VMS segments.
Figure 3. (A) Frequency of serial remodeling patterns in low-, moderate-, and high-WSS segments. (B) Frequency of serial remodeling patterns in low-, moderate-, and high-VMS segments. The p values refer to the ordered logistic regression analysis and are adjusted for the clustering of segments within patients. The primary variable of interest (wall shear stress) is not removed, even if not significant, from the backward stepwise process of logistic regression analysis. CI = confidence interval.
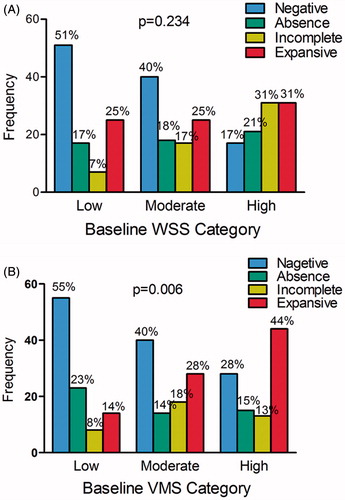
Table 3. Independent baseline predictors of arterial remodeling in 3-mm segments (n = 365).
3.4. Interobserver and intraobserver variability
In a subset of four randomly selected arteries at baseline and follow-up (n = 294 segments), the interobserver and intraobserver variabilities for MLA were 0.94 and 0.99, respectively. Reproducibility for plaque burden was lower (interobserver correlation: 0.69; intraobserver correlation: 0.92). For plaque volume, the interobserver and intraobserver variabilities were 0.81 and 0.97, respectively.
4. Discussion
The present investigation is unique in that it employs fluid-structure interaction analysis based on noninvasive CTA images to assess the potential pathophysiological mechanisms that may affect the natural history of coronary artery disease progression. The goal of this natural-history investigation was to identify the roles of both biomechanical factors and plaque characteristics in coronary plaque progression and arterial remodeling in native coronary arteries in patients with ACS. This may add VMS to the list of risk factors and represent a new direction of research. We found that VMS was an independent predictor of the change in MLA, change in plaque volume, and arterial remodeling, and that WSS was an independent predictor of change in plaque burden.
4.1. Role of WSS and vascular characteristics in plaque progression and arterial remodeling
Recently, great efforts have been made to discover the mechanisms governing coronary plaque progression. In a multi-patient IVUS-based follow-up study, Samady showed that low-WSS segments resulted in vessel and lumen area reduction, as well as constrictive (negative) remodeling, and that high-WSS segments generated vessel and lumen area increasing as well as expansive remodeling [Citation4]. In another study, the same researchers showed that significant plaque progression located at coronary segments with both plaque burden >40% and low WSS [Citation6]. In the PREDICTION study, which is the largest and most comprehensive serial anatomic natural-history study, Stone demonstrated that: 1) baseline large plaque burden was related to more disease progression; 2) both plaque burden and low WSS were correlated with lumen area decrease and plaque burden increase [Citation5]. The observation in the present study obtained similar results. We found that the effect of baseline WSS on vascular outcomes at follow-up () was consistent with that in the PREDICTION study. Additionally, as did Samady et al. [Citation4], we observed that negative remodeling was more likely to occur in low-WSS segments ().
4.2. VMS as a predictor of plaque progression and arterial remodeling
Most previous studies have focused on WSS, and few longitudinal studies investigating the role of VMS in the progression of atherosclerosis in coronary arteries exist. In an IVUS-based study, Tang et al. showed that VMS correlated negatively with coronary wall thickness at one-time point [Citation25], However, they did not investigate the relationship between VMS and coronary plaque progression. In the present investigation, we demonstrated that baseline VMS was an independent variable of plaque progression and arterial remodeling in the routine natural history of coronary artery disease. Baseline low VMS was associated with decrease in plaque volume, decrease in MLA, and negative remodeling at follow-up, whereas baseline high VMS was associated with increase in plaque volume and MLA and with expansive remodeling. Furthermore, given that there was no clear correlation between VMS and WSS, the role of VMS in plaque progression is complementary to the low-WSS hypothesis, which is not explain why plaques are still developing under high-WSS conditions.
4.3. Progression/regression analysis using coronary CTA
Coronary CTA can assess coronary atherosclerosis quantitatively under IVUS-like parameters. Previous comparative studies of IVUS and CTA have demonstrated that CTA can appropriately evaluate coronary plaque size, lumen size, and remodeling [Citation26–28]. In the Natural History of Coronary Atherosclerosis by Multislice Computed Tomography study, Papadopoulou et al. showed that CTA can assess the progression of coronary atherosclerosis, but they did not investigate the association between baseline vascular characteristics and plaque progression [Citation13]. In the present study, we successfully used CTA to evaluate coronary plaque progression and found that baseline MLA, plaque burden, and plaque volume were associated with plaque progression and arterial remodeling.
4.4 Limitations
Several limitations require consideration during the interpretation of the results of the present study. First, as this is a single-center study and included only a small population, baseline patient clinical characteristics on anatomic outcomes was not performed for multivariate analysis. Second, as this was not a drug response study, and we did not investigate the effect of drugs on vascular outcomes. Third, accurate coregistration of individual segments at two time points is challenging; however, a single experienced investigator performed all CTA analyses and carefully identified and used the same anatomic landmarks as described in the methods section. Fourth, although the assessment of coronary plaque composition is beneficial in predicting acute coronary events, we did not take plaque composition into account because the accuracy of CTA in distinguishing plaque composition has recently been called into question [Citation29,Citation30]. Finally, as it is difficult to visualize the outer wall boundary of the coronary artery on CTA images, we assumed an artificially constructed vessel wall based on the lumen surface.
5. Conclusions
The findings of the present study extended the current understanding of the impact of local vascular factors in predicting coronary plaque progression. The present study demonstrated that plaque burden progression and lumen obstruction can be predicted by local biomechanical factors and regional vascular characteristics. The magnitude of local low WSS, low VMS, large plaque burden, MLA, and plaque volume determined the subsequent natural history of coronary atherosclerosis progression and arterial remodeling. More patient follow-up data are needed to investigate further the effects of VMS on plaque progression.
Disclosure statement
No potential conflict of interest was reported by the authors.
Additional information
Funding
References
- Koskinas KC, Feldman CL, Chatzizisis YS, et al. Natural history of experimental coronary atherosclerosis and vascular remodeling in relation to endothelial shear stress: a serial, in vivo intravascular ultrasound study. Circulation. 2010;121:2092–2101.
- Chatzizisis YS, Jonas M, Coskun AU, et al. Prediction of the localization of high-risk coronary atherosclerotic plaques on the basis of low endothelial shear stress: an intravascular ultrasound and histopathology natural history study. Circulation. 2008;117:993–1002.
- Stone GW, Maehara A, Lansky AJ, et al. A prospective natural-history study of coronary atherosclerosis. N Engl J Med. 2011;364:226–235.
- Samady H, Eshtehardi P, McDaniel MC, et al. Coronary artery wall shear stress is associated with progression and transformation of atherosclerotic plaque and arterial remodeling in patients with coronary artery disease. Circulation. 2011;124:779–788.
- Stone PH, Saito S, Takahashi S, et al. Prediction of progression of coronary artery disease and clinical outcomes using vascular profiling of endothelial shear stress and arterial plaque characteristics: the PREDICTION Study. Circulation. 2012;126:172–181.
- Corban MT, Eshtehardi P, Suo J, et al. Combination of plaque burden, wall shear stress, and plaque phenotype has incremental value for prediction of coronary atherosclerotic plaque progression and vulnerability. Atherosclerosis. 2014;232:271–276.
- Cardoso L, Weinbaum S. Changing views of the biomechanics of vulnerable plaque rupture: a review. Ann Biomed Eng. 2014;42:415–431.
- Liang X, Xenos M, Alemu Y, et al. Biomechanical factors in coronary vulnerable plaque risk of rupture: intravascular ultrasound-based patient-specific fluid-structure interaction studies. Coronary Artery Dis. 2013;24:75–87.
- Fan R, Tang D, Yang C, et al. Human coronary plaque wall thickness correlated positively with flow shear stress and negatively with plaque wall stress: an IVUS-based fluid-structure interaction multi-patient study. Biomed Eng Online. 2014;13:32.
- Sadat U, Teng Z, Gillard JH. Biomechanical structural stresses of atherosclerotic plaques. Expert Rev Cardiovasc Ther. 2010;8:1469–1481.
- Sadat U, Teng Z, Young VE, et al. Association between biomechanical structural stresses of atherosclerotic carotid plaques and subsequent ischaemic cerebrovascular events–a longitudinal in vivo magnetic resonance imaging-based finite element study. Eur J Vasc Endovasc Surg. 2010;40:485–491.
- Mintz GS, Garcia-Garcia HM, Nicholls SJ, et al. Clinical expert consensus document on standards for acquisition, measurement and reporting of intravascular ultrasound regression/progression studies. Euro Intervention. 2011;6:1123–1130.
- Papadopoulou SL, Neefjes LA, Garcia-Garcia HM, et al. Natural history of coronary atherosclerosis by multislice computed tomography. JACC Cardiovasc Imag. 2012;5:S28–S37.
- Maurovich-Horvat P, Ferencik M, Voros S, et al. Comprehensive plaque assessment by coronary CT angiography. Nat Rev Cardiol. 2014;11:390–402.
- Hamirani YS, Kadakia J, Pagali SR, et al. Assessment of progression of coronary atherosclerosis using multidetector computed tomography angiography (MDCT). Int J Cardiol. 2011;149:270–274.
- Abbara S, Arbab-Zadeh A, Callister TQ, et al. SCCT guidelines for performance of coronary computed tomographic angiography: a report of the Society of Cardiovascular Computed Tomography Guidelines Committee. J Cardiovasc Comput. 2009;3:190–204.
- Nakazato R, Shalev A, Doh JH, et al. Aggregate plaque volume by coronary computed tomography angiography is superior and incremental to luminal narrowing for diagnosis of ischemic lesions of intermediate stenosis severity. J Am Coll Cardiol. 2013;62:460–467.
- Leber AW, Becker A, Knez A, et al. Accuracy of 64-slice computed tomography to classify and quantify plaque volumes in the proximal coronary system: a comparative study using intravascular ultrasound. J Am Coll Cardiol. 2006;47:672–677.
- Badak O, Schoenhagen P, Tsunoda T, et al. Characteristics of atherosclerotic plaque distribution in coronary artery bifurcations: an intravascular ultrasound analysis. Coronary Artery Dis. 2003;14:309–316.
- Sipahi I, Tuzcu EM, Schoenhagen P, et al. Static and serial assessments of coronary arterial remodeling are discordant: an intravascular ultrasound analysis from the Reversal of Atherosclerosis with Aggressive Lipid Lowering (REVERSAL) trial. Am Heart J. 2006;152:544–550.
- Torii R, Wood NB, Hadjiloizou N, et al. Fluid-structure interaction analysis of a patient-specific right coronary artery with physiological velocity and pressure waveforms. Commun Num Meth Eng. 2009;25:565–580.
- Zhu H, Friedman MH. Relationship between the dynamic geometry and wall thickness of a human coronary artery. Arterioscl Throm Vas. 2003;23:2260–2265.
- Feldman CL, Ilegbusi OJ, Hu Z, et al. Determination of in vivo velocity and endothelial shear stress patterns with phasic flow in human coronary arteries: A methodology to predict progression of coronary atherosclerosis. Am Heart J. 2002;143:931–939.
- Siogkas PK, Sakellarios AI, Exarchos TP, et al. Blood flow in arterial segments rigid vs deformable walls simulations. J Serb Socie Comput Mech. 2011;5:69–77.
- Tang D, Yang C, Canton G, et al. Correlations between carotid plaque progression and mechanical stresses change sign over time: a patient follow up study using MRI and 3D FSI models. Biomed Eng Online. 2013;12:105.
- Hoffmann U, Moselewski F, Nieman K, et al. Noninvasive assessment of plaque morphology and composition in culprit and stable lesions in acute coronary syndrome and stable lesions in stable angina by multidetector computed tomography. J Am Coll Cardiol. 2006;47:1655–1662.
- Voros S, Rinehart S, Qian Z, et al. Prospective validation of standardized, 3-dimensional, quantitative coronary computed tomographic plaque measurements using radiofrequency backscatter intravascular ultrasound as reference standard in intermediate coronary arterial lesions: results from the ATLANTA (assessment of tissue characteristics, lesion morphology, and hemodynamics by angiography with fractional flow reserve, intravascular ultrasound and virtual histology, and noninvasive computed tomography in atherosclerotic plaques) I study. JACC Cardiovasc Int. 2011;4:198–208.
- Papadopoulou SL, Neefjes LA, Schaap M, et al. Detection and quantification of coronary atherosclerotic plaque by 64-slice multidetector CT: a systematic head-to-head comparison with intravascular ultrasound. Atherosclerosis. 2011;219:163–170.
- Cormode DP, Roessl E, Thran A, et al. Atherosclerotic plaque composition: analysis with multicolor CT and targeted gold nanoparticles. Radiology. 2010;256:774–782.
- van der Giessen AG, Toepker MH, Donelly PM, et al. Reproducibility, accuracy, and predictors of accuracy for the detection of coronary atherosclerotic plaque composition by computed tomography: an ex vivo comparison to intravascular ultrasound. Invest Radiol. 2010;45:693–701.