
 ?Mathematical formulae have been encoded as MathML and are displayed in this HTML version using MathJax in order to improve their display. Uncheck the box to turn MathJax off. This feature requires Javascript. Click on a formula to zoom.
Abstract
Near infrared spectroscopy is the promising and noninvasive technique that can be used to detect the brain functional activation by monitoring the concentration alternations in the haemodynamic concentration. The acquired NIRS signals are commonly contaminated by physiological interference caused by breathing and cardiac contraction. Though the adaptive filtering method with least mean squares algorithm or recursive least squares algorithm based on multidistance probe configuration could improve the quality of evoked brain activity response, both methods can only remove the physiological interference occurred in superficial layers of the head tissue. To overcome the shortcoming, we combined the recursive least squares adaptive filtering method with the least squares support vector machine to suppress physiological interference both in the superficial layers and deeper layers of the head tissue. The quantified results based on performance measures suggest that the estimation performances of the proposed method for the evoked haemodynamic changes are better than the traditional recursive least squares method.
1. Introduction
Near infrared spectroscopy (NIRS) has been a low cost and effective technique for stimulus evoked function and activity research by non-invasively measuring the hemodynamic changes in specific brain regions, which can be classified to three different NIRS techniques including continuous wave NIRS (CW-NIRS), frequency domain NIRS (FD-NIRS) and time domain NIRS (TD-NIRS), has attracted growing interest [Citation1,Citation2]. Compared with other functional brain activity measurement technologies such as electroencephalography (EEG) and functional magnetic resonance imaging (fMRI), NIRS has its particular advantages such as safety, fewer physical restrictions, portability and greater practicality. In addition to these advantages, NIRS is also associated with a major problem that is the physiological interference, which mainly relates to perturbations caused by cardiac and respiratory events and is often sufficient to suppress the desired activation signal [Citation3,Citation4]. Previous research works have been made to reduce the physiological interference and improve the performance of brain activity measurements. Tachtsidis and Scholkmann presented the original perspective of possible physiological origins for the interference signal and summarized some effective and useful approaches to remove the physiological interference [Citation5]. Zhang and Brown et al. adopted the adaptive filtering model with multidistance probe configuration to remove the physiological interference, which is least mean squares (LMS) method based and using short distance source–detector NIRS signal as the reference signal [Citation6]. Furthermore, Zhang and Sun et al. adopted the recursive least squares (RLS) method to improve the convergence rate and the performance of physiological interference suppression [Citation7].
However, both methods are only effective to reduce the physiological interferences in the superficial head tissue layers, the physiological interferences in deeper tissue layers still obscure the desired haemodynamic changes of functional brain activation. To overcome this shortcoming, we combined RLS algorithm and least squares support vector machine (LSSVM) to remove the residual physiological interference signal. LSSVM is the novel machine learning method that defines a tradeoff between the complexity of approximating function and the approximation quality of given data through replacing empirical risk minimization (ERM) principle with structural risk minimization (SRM) principle, which is inspired by statistical learning theory and widely applied to text classification, image processing, time series forecasting and regression analysis [Citation8,Citation9]. Furthermore, it should be underlined that the above mentioned method is proposed for CW-NIRS with multidistance probe configuration and could not be approved directly for TD-NIRS and FD-NIRS, which work in different ways.
2. Theory
2.1. Multidistance multilayer model and the modified lambert–Beer law
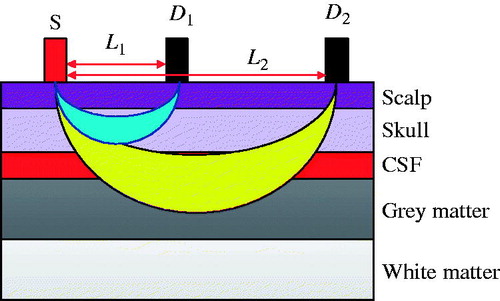
A five-layer, human head tissue model coupled with a multidistance NIRS probe was employed to explore light propagation in head tissue, which is illustrated in . The head model contains Grey and white matter, cerebrospinal fluid, skull, and scalp. The two-wavelength integrated light source (S) was placed on the surface of scalp and two separated detectors with different distances from the light source was used to measure the intensity of light emerging from the tissue after diffuse reflectance. The different source-detector distances allow us to distinguish different photon penetration depths, which follows the banana-shaped propagation path inside the head tissue [Citation10]. The detector with short distance (D1) was used to measure the oxyhemoglobin and deoxyhemoglobin concentration changes in superficial tissue layers and the detector with long distance (D2) was used for both superficial and deeper tissue layers.
Figure 1. Diagram of five-layer head tissue model and NIRS probe configuration.
According to the modified Lambert-Beer law (MLBL), the concentration changes of oxyhemoglobin and deoxyhemoglobin in tissue can be represented as following [Citation11,Citation12].
(1)
(1)
where Δ[HbO2] is the concentration changes of oxyhemoglobin, Δ[HHb] is the concentration changes of deoxyhemoglobin, R is the distance between the light source and the detector,
is the molar extinction coefficients of oxyhemoglobin for wavelength λ,
is the molar extinction coefficients of deoxyhemoglobin for wavelength λ, DPFλ is the differential pathlength factor for wavelength λ, and
is the changes of optical density for wavelength λ.
2.2. Recursive least-squares adaptive filtering
For the physiological interference removal in NIRS, the RLS adaptive filtering based on a transversal filter with finite impulse response and the RLS optimization, was used to remove the physiological interference in superficial tissue layer. The differential signal e(t) at the sampling time t can be expressed as:
(2)
(2)
where d(t) is the Δ[HbO2] (or Δ[HHb]) calculated from detector D2 based on the MLBL, which contains the evoked brain activity haemodynamic changes in Grey matter and the physiological interference in superficial tissue. X(t)= [x(t) x(t-1) … x(t-M)]T, where x(t) is theΔ[HbO2] (or Δ[HHb]) calculated from detector D1 based on the MLBL, which contains the physiological interference in superficial tissue and is used as the reference signal, M is the order of the adaptive filter and x(t-M) is the M-step delay signal of x(t). W(t)= [w0(t) w1(t) … wN(t-M)]T is the weight coefficient vector of adaptive filter.
To reduce the physiological interference, the RLS adaptive filtering algorithm was used to remove the correlated components of reference signal x(t) from signal d(t) by minimizing the following mean square error [Citation13].
(3)
(3)
where χ is the weighting factor (0<χ < 1). By solving the above optimization problem, we can get the optimal weight coefficient vector W*(t). And the optimal difference signal e*(t) can be obtained based on EquationEquation (2)
(2)
(2) as following expression, which is also the optimal estimation of the evoked responds of brain activity based on RLS adaptive filtering algorithm.
(4)
(4)
2.3. Least squares support vector machine
Though we can suppress the physiological interference in superficial tissue layers of the head by RLS adaptive filtering method, the residual physiological interference that arises from deeper tissue layers remain in the filtered signal e*(t), and the evoked responds signal e*(t) can be expressed as follows:
(5)
(5)
where E(t) is desired signal related to the evoked brain functional activity appeared in Grey matter, ν(t) is the noise signal that contain the residual physiological interference. The problem of solving E(t) from EquationEquation (5)
(5)
(5) is equivalent to a nonlinear regression problem, which can be solved by least squares support vector machine algorithm. Namely, the LSSVM is intended to estimate E(t) by the following function:
(6)
(6)
And the corresponding optimization problem can be expressed as:
(7)
(7)
where w is the weight vector, function φ(·) constructed in an implicit way can map the input signal into a higher dimensional space, γ is the regularization parameter, b is the bias term. The optimization problem formulated in EquationEquation (7)
(7)
(7) can be solved by constructing the Lagrangian function with Lagrange multipliers αi, and the resulting LSSVM estimation function becomes:
(8)
(8)
where the function K (·, ·) is kernel function that should satisfy the Mercer’s condition, and the typical choices of kernel function include polynomial kernel, sigmoid kernel and RBF kernel [Citation8,Citation14]. The kernel function used for the LSSVM is the RBF kernel, which is the popular used kernel and compactness compared with other feasible kernel for developing the LSSVM estimation function [Citation15].
3. Haemodynamic change and physiological interference data generation based on monte carlo simulation
To verify the effectiveness of the proposed algorithm, Monte Carlo simulations for the five-layered head tissue model with a two wavelengths light source (750 nm and 830 nm) and two separated light detectors (D1 with 5 mm source–detector distance and D2 with 45 mm source–detector distance) as shown in were performed. The Monte Carlo code used in this paper is the extension of general three-dimensional photon simulation codes developed by Wang et al. [Citation16]. The parameters used in the Monte Carlo simulation, which include absorption coefficient, transport scattering coefficient, tissue thickness, baseline concentration of oxyhemoglobin and deoxyhemoglobin for different tissue layer, can be found in related literature [Citation12]. The haemodynamic changes in different tissue layer were simulated as combination of functional evoked haemodynamic responses and the physiological interference. The task-related haemodynamic responses were defined by the convolution of the stimulation function and the prototypical haemodynamic impulse function, which only appeared in Grey matter. The physiological interference in all five tissue layers was defined by the combination of cardiac fluctuation function and respiratory fluctuations function, and additional sweat phenomenon function was generated only in scalp layer. More detail about related functions and parameters can be found in the literature [Citation7].
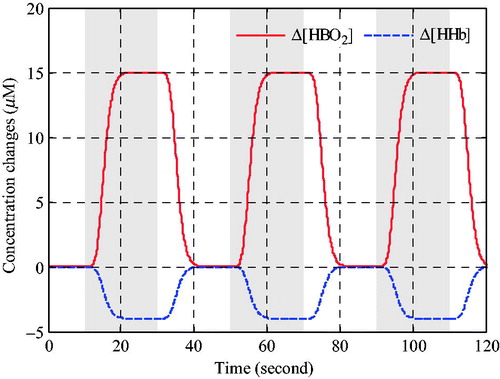
The three epochs block design experiment were simulated, and each epoch was consisted of 200 rest sampling points and 200 stimulation sampling points with 10 Hz sampling rate. The ideal task-related haemodynamic response without physiological interference simulated in the Grey matter was shown in , and the shaded regions indicate the periods of evoked stimulation.
Figure 2. Ideal task-related haemodynamic changes in the Grey matter.
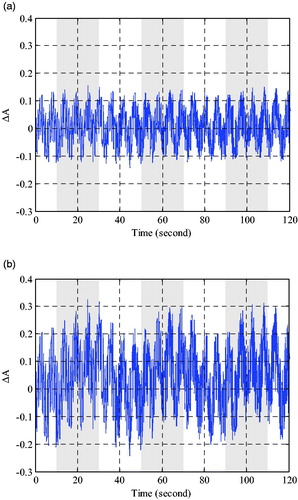
The simulated optical signal of 750 nm and 830 nm can be measured by two different distances detector based on Monte Carlo simulations. To simplify the description, the changes of optical density with long source-detector distance are shown in , the changes of optical density with short distance are similar. As shown in , the optical density changes are severely disturbed by the physiological interference, which is not effectively expressed the brain functional activity.
Figure 3. Simulated signals for optical density changes for long source-detector distance. (a) Optical density changes for 750 nm. (b) Optical density changes for 830 nm.
4. Results and discussion
The concentration changes of oxyhemoglobin and deoxyhemoglobin at different distances detector were calculated with the change of optical density at wavelength 750 nm and 830 nm based on MLBL, which was described in EquationEquation (1)(1)
(1) . As shown in , the concentration changes of oxyhemoglobin were presented, where the time series signal calculated from source–detector with long distance based on MLBL was shown in , and the result calculated from source–detector with short distance based on MLBL was shown in . Similarly, the results of concentration changes of deoxyhemoglobin were presented in .
Figure 4. The time series signal of Δ[HbO2] calculated based on MLBL. (a) The results for long source-detector distance. (b) The results for short source-detector distance.
![Figure 4. The time series signal of Δ[HbO2] calculated based on MLBL. (a) The results for long source-detector distance. (b) The results for short source-detector distance.](/cms/asset/35e7966c-3642-478e-b709-2b20f1d9f771/icsu_a_1557901_f0004_c.jpg)
Figure 5. The time series signal of Δ[HHb] calculated based on MLBL. (a) The results for long source-detector distance. (b) The results for short source-detector distance.
![Figure 5. The time series signal of Δ[HHb] calculated based on MLBL. (a) The results for long source-detector distance. (b) The results for short source-detector distance.](/cms/asset/cc207131-3e3e-48ac-865c-55bb6bad2bfc/icsu_a_1557901_f0005_c.jpg)
As shown in and Citation5(a), the time series results from source–detector with long distance should contain the evoked hemodynamic response in Grey matter layer and global interferences in superficial and deeper tissue layers. The results from source–detector with short distance contain the global interferences in superficial tissue layers as shown in and Citation5(b). The RLS algorithm can be used to remove the global interferences in superficial tissue layer and get the estimation of evoked hemodynamic response in Grey matter. Usually, the magnitudes of concentration changes of oxyhemoglobin and deoxyhemoglobin calculated from the RLS algorithm were underestimated, which was called partial volume effect (PVE) [Citation17]. To compare the results quantitatively with the ideal evoked haemodynamic response, the PVE can be compensated by the ratio of the optical pathlength of activated volume to the optical pathlength of sampling volume for the Monte Carlo simulations. Furthermore, the proposed method can be used to remove the residual physiological interference. To assess and evaluate the performance of proposed method, the related results were presented in and Citation7.
Figure 6. Performance comparison of oxyhemoglobin concentration changes estimation in Grey matter. (a) Evoked haemodynamic changes calculated by RLS algorithm. (b) Evoked haemodynamic changes calculated by proposed algorithm.
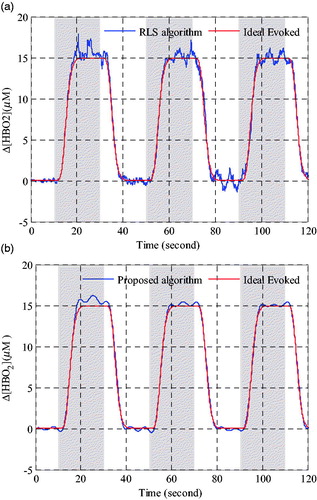
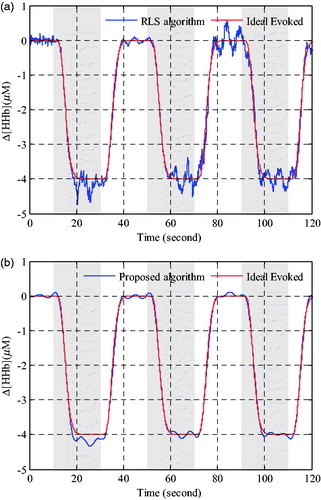
As seen from the , it is obvious that the oxyhemoglobin concentration changes calculated with the proposed algorithm is better than that calculated by the RLS method, which residual interference is relatively smaller and more close to the ideal evoked haemodynamic response signal. In , the results of deoxyhemoglobin concentration changes are similar to oxyhemoglobin concentration changes shown in . Both the time series results of Δ[HbO2] andΔ[HHb] shown in and Citation7 demonstrated that the proposed method exhibited a better processing performance in physiological interference reduction than the RLS method.
Figure 7. Performance comparison of deoxyhemoglobin concentration changes estimation in Grey matter. (a) Evoked haemodynamic changes calculated by RLS algorithm. (b) Evoked haemodynamic changes calculated by proposed algorithm.
To quantified evaluate the estimation performance of proposed method, the performance measures including the mean absolute error (MAE), the root mean square error (RMSE), the max absolute error (MaxAE) and the min absolute error (MinAE) are considered. The calculation equations for MAE, RMSE, MaxAE and MinAE are shown as following:
(9)
(9)
(10)
(10)
(11)
(11)
(12)
(12)
where, N is the number of samplings,
is the estimated evoked haemodynamic changes at time t,
is the ideal evoked haemodynamic changes at time t. provides the MAE, RMSE, MaxAE and MinAE values of different methods for the comparison of the haemodynamic concentration changes estimation. Based on the performance measures values in , it can be found that the proposed method could consistently provide lower MAE, RMSE, MaxAE and MinAE values. For instance, if we observe the RMSE forΔ[HbO2] andΔ[HHb] in , the proposed method can improve the estimation results by 38.5% and 48.8% comparing with RLS method. The quantified results obtained from indicate that the proposed method could significantly improve the estimation performance.
Table 1. Estimation accuracy of different methods for the haemodynamic concentration changes.
5. Conclusions
In this paper we combined the RLS adaptive filtering with LSSVM to extract the high precision evoked brain activity signals based on multi-distance probe configuration, which could remove the interference signal arising both in the superficial regions and deeper regions of the brain tissue from the target signals. To assess the effectiveness and performance of proposed algorithm, the Monte Carlo simulations were used to derive the optical signals of evoked haemodynamic responses with physiological interference in both superficial layers and deeper layers of head tissue. Then the raw signals of oxyhaemoglobin and deoxyhaemoglobin could be obtained by MLBL based on multidistance measurement, which roughly expressed the haemodynamic response information of evoked brain activity. The clear evoked trends of deoxyhaemoglobin and oxyhaemoglobin can be acquired by proposed method, and the quantified results showed that the proposed method based on multi-distance measurement configuration exhibits better estimation performance and smaller residual interference than the reference RLS method for the reconstruction of the evoked brain activity response. Furthermore, the proposed method has the potential to improve the measurement ability of NIRS techniques and promote the applications of NIRS techniques in the related medical and clinical fields such as stroke rehabilitation, traumatic brain injury and tumor detection.
Acknowledgments
The authors are grateful for the support from the National Natural Science Foundation of China [Grant No. 61401117, 61201017 and 61301012], the National Science Foundation of USA [Grant No. CNS-1552163] and the Fundamental Research Funds for the Central Universities [Grant No. HIT.IBRSEM.2014082].
Disclosure statement
No potential conflicts of interest were disclosed.
References
- Jobsis F. Noninvasive, infrared monitoring of cerebral and myocardial oxygen sufficiency and circulatory parameters. Science 1977;198:1264–1267.
- Ferrari M, Quaresima V. A brief review on the history of human functional near-infrared spectroscopy (fNIRS) development and fields of application. NeuroImage 2012;63:921–935.
- Obrig H, Neufang M, Wenzel R, et al. Spontaneous low frequency oscillations of cerebral hemodynamics and metabolism in human adults. NeuroImage 2000;12:623–639.
- Zhang Y, Brooks DH, Franceschini MA, et al. Eigenvector-based spatial filtering for reduction of physiological interference in diffuse optical imaging. J Biomed Opt. 2005;10:011014–01101411.
- Tachtsidis I, Scholkmann F. False positives and false negatives in functional near-infrared spectroscopy: issues, challenges, and the way forward. Neurophoton. 2016;3:031405.
- Zhang Q, Brown EN, Strangman GE. Adaptive filtering for global interference cancellation and real-time recovery of evoked brain activity: a Monte Carlo simulation study. J Biomed Opt. 2007;12:044014.
- Zhang Y, Sun JW, Rolfe P. RLS adaptive filtering for physiological interference reduction in NIRS brain activity measurement: a Monte Carlo study. Physiol Meas. 2012;33:925–942.
- Suykens JAK, De Brabanter J, Lukas L, et al. Weighted least squares support vector machines: robustness and sparse approximation. Neurocomputing 2002;48:85–105.
- Yang X, Tan L, He L. A robust least squares support vector machine for regression and classification with noise. Neurocomputing 2014;140:41–52.
- Rolfe P. In vivo near-infrared spectroscopy. Annu Rev Biomed Eng. 2000;2:715–754.
- Delpy DT, Cope M, van der Zee P, et al. Estimation of optical pathlength through tissue from direct time of flight measurement. Phys Med Biol. 1988;33:1433–1442.
- Zhang Y, Sun J, Rolfe P. Monte Carlo study for physiological interference reduction in near-infrared spectroscopy based on empirical mode decomposition. J Mod Opt. 2010;57:2159–2169.
- Merched R, Sayed AH. Extended fast fixed-order RLS adaptive filters. IEEE Trans Signal Process. 2001;49:3015–3031.
- Burges CJC. A tutorial on support vector machines for pattern recognition. Data Mining Knowledge Discov. 1998;2:121–167.
- Malik BA. Determination of glucose concentration from near infrared spectra using least square support vector machine. 2015 International Conference on Industrial Instrumentation and Control (ICIC); Pune (India): IEEE; 2015. p. 475–478.
- Wang L, Jacques SL, Zheng L. MCML—Monte Carlo modeling of light transport in multi-layered tissues. Comput Methods Prog Biomed.1995;47:131–146.
- Yamashita Y, Maki A, Koizumi H. Wavelength dependence of the precision of noninvasive optical measurement of oxy-, deoxy-, and total-hemoglobin concentration. Med Phys. 2001; 28:1108–1114.