
 ?Mathematical formulae have been encoded as MathML and are displayed in this HTML version using MathJax in order to improve their display. Uncheck the box to turn MathJax off. This feature requires Javascript. Click on a formula to zoom.
Abstract
Continuous wave near-infrared spectroscopy (CW-NIRS) can be used to measure cerebral activity because it is noninvasive, simple and portable. However, the performance of the continuous wave near-infrared spectroscopy is distorted by the presence of extracerebral layer. Change of optical parameters in gray matter layer will then be inappropriately converted into the brain activity response. In the current study, a five-layer structure model constitute of scalp, skull, cerebrospinal fluid, gray matter and white matter, have been applied to fabricate human brain tissue. The phantom is made by the mixture of the Intralipid, India ink and agar. The optical parameters of gray matter layer can be flexibly adjusted to simulate the change of the deep brain tissue. The near infrared optical measurement system was designed to detect the changes in the absorption coefficients of the gray matter and quantitative analyze the influence of the extracerebral layers. Monte Carlo technique for the equivalent multi-layered brain tissue models is then performed to compensate partial volume effect introduced by the extracerebral layers. The results of the experiments suggested that the extracerebral layers influence the measurement and the influence of the extracerebral layers can be suppressed by correcting partial volume effect using Monte Carlo simulations.
1. Introduction
Functional near infrared spectroscopy (fNIRS) technology can be used to analyze the functional brain activity in the process of cerebral oxygen metabolism information-oxyhemoglobin and hemoglobin concentration changes [Citation1]. Compared with similar brain function detection methods such as: functional magnetic resonance imaging, positron emission tomography, magnetoencephalography, and electroencephalography, continuous wave near infrared spectroscopy (CW-NIRS) has the advantages of convenience, easy implementation, high time resolution, cheap and safe. The most elementary NIRS measurement consists of injecting light at one surface location and collecting remitted light at another location some distance away. At present, methods for such type of measurement using NIRS can be classified to three categories including CW-NIRS [Citation2], frequency domain NIRS (FD-NIRS) [Citation3], and time domain NIRS (TD-NIRS) [Citation4]. In some applications, the detected objects are all based on an assumption that the medium is homogeneous, which is not true in the case of actual tissue structure. Consequently, the results, even quantified, are not wholly consistent with the true values of the tissue of interest.
In the fNIRS measurement, a coupled unit of source and detector positioned in some distance on a head surface is used. One significant limitation of fNIRS is that the light must interact with blood in regions other than the cerebral cortex. For the light to reach the brain during its travels, it must pass through all intervening layers of the head. These layers include the scalp, skull and cerebrospinal fluid which have their own vasculature that definitely influence the optical measurements. Thus, the influence of extracerebral layer should be experimentally and theoretically studied. Previously, Monte Carlo simulations have been used to study multi-layered model and analyze the measurement for near infrared spectroscopy [Citation5,Citation6]. However, a real five-layered model has not been investigated the problem introduced by extracerabral layers as far as we know.
In the current paper, we present a diffuse reflectance model, suitable for modeling reflectance from brain tissues that are present in intracerebral and extracerebral layer. The model is based on a five-layer model that consisted of scalp, skull, cerebrospinal fluid, gray matter and white matter. By changing the absorption coefficients of the gray matter, different intensity could be acquired by the NIRS detection system. The optical properties of the gray matter could be retrieved using modified Lambert-Beer law. The influences of the extracerebral layer on the measurement characteristics, especially on a fundamental relationship between optical density and absorption, are quantitatively investigated by five-layered phantom experiments. Then, Monte Carlo simulation is used as the feasibility way of correcting the influence of extracerebral layer by compensating partial volume effect.
2. Theory
2.1. Lambert-Beer law
The Lambert–Beer law allows for the calculation of the absorption coefficient changes of a medium from the associated variations in the intensity. According to the Lambert-Beer law, when light passes through the pure absorption medium, the intensity attenuation can be expressed as:
(1)
(1)
where A is the optical density at a given wavelength, I0 is incident light intensity and I is the output light intensity recollect at the detector respectively, μa is the absorption coefficients for a substance in a specific wavelength λ, r is the distance from source to detector.
For the biological tissues, which belong to the highly scattering media, Lambert-Beer is no longer effective. Because the photon path length in the tissue increases due to multiple scattering effects, which greatly increases the probability of photons are absorbed. Therefore, the modified Lambert-Beer's law is proposed in order to reflect the influence of scattering and optical loss.
(2)
(2)
In the formula, G represents the loss caused by the background, DPF (Differential Path length Factor, DPF) as the differential path factor, is the scaling factor [Citation7] that relates the average path length () light travels in the medium to the source-detector distance r. The value of DPF is not easy to obtained, usually by frequency modulation spectroscopy, time resolved spectroscopy and Monte Carlo simulation method.
If the absorption coefficient changes by Δμa in each layer, the corresponding ΔA of the detected light can be calculated by:
(3)
(3)
Thus the changes of absorption coefficients can be converted by using the attenuation of the optical density. For brain measurements with CW-NIRS, a more realistic brain model should contain scalp, skull, cerebrospinal fluid, gray matter and white matter layers. For the specified wavelength λ and the source-detector distance r, measured optical density change can be written as [Citation8]:
(4)
(4)
where, Δμa,sc, Δμa,sk, Δμa,csf, Δμa,gm, and Δμa,wm represent the abosorption coefficients at wavelength λ in each layer with the subscripts sc, sk, csf, gm and wm indicating the layer for scalp, skull, cerebrospinal fluid, gray and white matters, respectively. ,
,
,
and
represent the partial optical pathlength in each layer for a source-detector distance r, respectively. When the photon irradiate in the tissue, the statistical transmission path of a large number of photon contribute into the "banana" shape. The transmission distance is much greater than the source detector spacing, which is called the mean optical pathlength. In a multi-layer brain model, the photon propagation path in each layer is defined as the partial optical pathlength. Actually, the mean optical pathlength of the head can be measured by time- or frequency-based experiments and a partial optical pathlength cannot be directly measured by such experiment. Monte Carlo simulation is a possible method to calculate the partial optical pathlength.
2.2. Monte Carlo simulation
Monte Carlo simulation is based on modelling a large number of possible trajectories of photons as they travel through biological tissues. We performed Monte Carlo simulations for the different five-layered brain tissues (). The light propagation in the head model was predicted by Monte Carlo simulation to obtain the mean optical path length in the head and the partial optical pathlength in the brain.
The partial optical pathlength refer to the sensitivity of the optical signal to absorption changes in a particular area of the tissue. In multi-layered brain tissue of the models, the partial optical pathlength PPLi(r) in the i layer medium represents the average path length of the photon transported in the layer, the total photon path in the layer is the weighted average of the results of its receiving weight, expressed as
(5)
(5)
where: wj is the photon package weight of the detected photon j at the detector, r is the source-detector distance, PPLi,j(r) is the optical pathleng of the j photon package in the i layer at the source-detector distance r. The total number of the photons is N.
The mean optical pathlength PL(r) is the weighted average of the total path that the detected photons transport in the head, it can be expressed as
(6)
(6)
Where: is the total path length of the j photon propagation in the M tissue layers.
3. Experiments
3.1. Near infrared optical measurement system
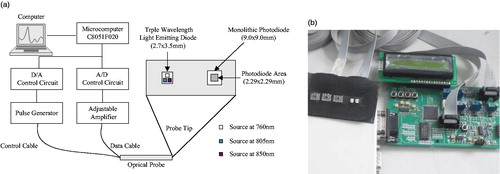
Near infrared optical measurement system as shown in , is composed of a sensor probe, the host system and the upper computer. The sensor probe adopts the diffuse reflection structure and the objective is to sample the photoelectric signal while measuring optical properties of the tissue. The microcomputer as the control center is used to control the sensor probe, digital to analog conversion, analog to digital conversion, pulse generator and adjustable amplifier. The computer can acquire the data by communicating with the microcomputer and then further process the signal. Briefly, the optical probe is comprised of light-emitting diodes SMT760/805/850 produced by EPITEX as light sources at three wavelengths, 760 nm, 805 nm and 850 nm and sensitive photodiodes OPT101 as the detectors (see ). The source and detectors may be arranged to meet the requirements of the in vitro experiment. Thus, both transmission and backscatter situations can be accommodated. In order to carry out measurements by diffuse reflectance the radiation sources and the detector were positioned side-by-side on the surface of the detected area.
Figure 1. Multi-layered brain structure for Monte Carlo simulations.
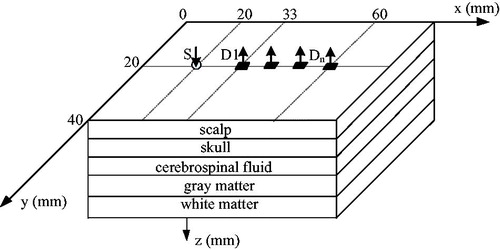
Figure 2. Optical measurement system of NIRS. (a) Diagram, (b) Probe and measuring circuit.
3.1. In vitro experiment
The first experimental step is to prepare the materials for making the brain tissue phantom. The model fabrication materials include: Intralipid solution, India Ink, agar, distilled water and the mold for making brain layer. The mold is made with organic glass, with the length of 80 mm, width 60 mm and different thickness for the brain tissue. The material and the mold are shown in .
Figure 3. Prepared material for making head model.
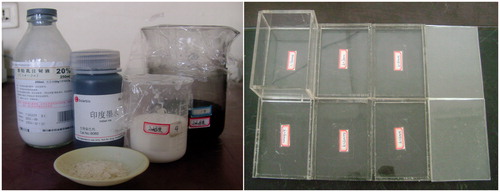
In the process of model making, spectrophotomeFter is used to adjust the India Ink to obtain different absorption coefficient, electronic balance is used to weigh the quality of agar, pipette is used to precisely measure Intralipid solution and India Ink volume, the cylinder is utilized to measure the distilled water, the electric cooker is for heating solution agar, and constant temperature environment could be maintained with the incubator.
3.2. Fabrication process
The brain tissue optical properties are achieved by the solution of Intralipid, India Ink and distilled water mixing in different proportions. The step is as follows: (a) absorption coefficient of the India Ink is very large, thus we use spectrophotometer to measure the absorption coefficient so as to further dilution. Then we can obtain the dilute India Ink solution and its absorption coefficient is known. With this solution the absorption coefficient µa in each layer can be acquired later by adding different volume India Ink solution. (b) The concentration of Intralipid solution is 20%. We can obtain 10% Intralipid solution by adding equivalent distilled water into 20% Intralipid solution. According to the light scattering properties of 10% Intralipid solution [Citation9], the scattering coefficient of Intralipid µs and anisotropy factor g, can be used to calculate the effective scattering coefficient µs′. (c) Measure the agar with electronic balance and dissolve 1% agar into the distilled water. We use electric cooker to heat the distilled water to above 85 degrees to help agar to be dissolved. (d) After the temperature of agar solution falls to about 60 degrees, add different volume of India Ink and 10% Intralipid solution according to optical properties of each layer and stir evenly and slightly to avoid bubbles. (e) After the temperature of the solution falls to about 40 degrees, pour the solution into the tissue mold. A plastic film is then used to cover the surface of the solidification for retaining water, preventing the air and bacteria from entering, and prolonging the storage time. (f) Then the solutions together with the molds were put in an incubator chamber and set the temperature to 5 degrees, where it is solidified under accelerated-cooling conditions. (g) After each solution is solidified, take it out from the mold and put it to incubator chamber for use later.
According to the optical properties of the head, brain tissue models are made with the parameter [Citation8,Citation10,Citation11] shown in . To simulate optical properties in deep layer due the brain activity, the absorption coefficients of gray matter vary as the 5 percent of the base value presented in . That means the baseline is 0.038 for the absorption coefficient of gray matter, the other parameter for gray matter absorption is 5%, 10%, 15%, 20%, 25% larger than the baseline. To guarantee the experiment go on smoothly, two same samples are made for one parameter model. shows some of the sample for brain tissue.
Figure 4. Tissue model of head for in vitro experiment.
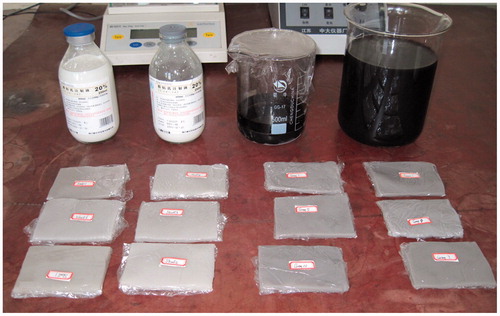
Table 1. Optical parameters for five-layered head model.
4. Results and discussions
4.1. The measurement of absorption coefficients changes
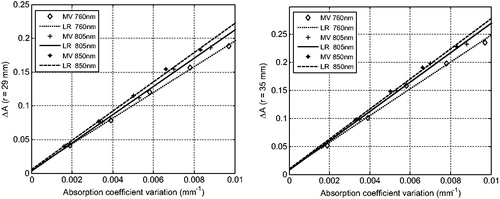
The absorption coefficient results of the diffuse reflectance can be measured by changing the brain tissue models. Due to the presence of the extracerebral brain layer, the near infrared spectroscopy must penetrate into the gray matter and then can be used to sense the changes of optical properties of this layer. During the experiment, the optical density changes are not obvious to be detected when the source detector is too close [Citation9]. We have adjusted the source-detector distance to 29 mm, 35 mm.
According to the definition of absorbance, the relationship between the detected optical density and the absorption ability can be used to calculate the absorption coefficients changes of the gray matter. The results are shown in . The scatter plot in the figure represent the measured value (Measured Value, MV) and the line is the linear regress for the measured data (Linear Regression, LR). ) is the measurement results for the source detector spacing of 29 mm and ) is the measurement results for the source detector spacing of 35 mm. From the figure, it can be seen that the absorbance changes and the absorption coefficient changes are linear relationship, which is consistent with the modified Lambert-Beer's law. However, the measured absorption coefficients changes are smaller than the true value because of the partial volume effect [Citation12].
Figure 5. Change of absorbance induced by absorption coefficient variation in gray matter. a) souce-detector distance of 29 mm; b) souce-detector distance of 35 mm.
4.2. The partial optical pathlength with Monte Carlo simulation
The Monte Carlo simulations for the five-layered brain tissue is an extension of the general multi-layer, three dimensional program developed by Wang et al [Citation13]. In this study, we launched 108 photons at the origin of the semi-infinite medium and detect the photons at the specified detector position. For Monte Carlo simulations, the region of gray matter that light travels is often smaller than the volume of the whole head interrogated; hence the detected light travels through the gray matter that contributes to the signal which is shorter than the mean optical pathlength. Thus we use Monte Carlo simulations to analyze the light propagation in the head model and thereby we can calculate the mean optical path length and the partial optical path length for different S-D spacing. is partial optical pathlength in the gray matter for different source-detector spacings.
Table 2. the partial optical pathlength in gray matter for different source-detector distance.
The mean optical pathlength can also be calculated with Monte Carlo simulations. Then the partial volume effect can be compensated using the partial optical pathlengh and the mean optical pathlength for different source-detector spacings. The corrected value is shown is . The standard (Std) values represent the true absorption coefficient changes by adjusting the model with India ink. The measured results include the source-detector spacings of 29 mm and 35 mm and the wavelength of 760 nm, 805 nm and 850 nm. The results demonstrate that the errors between the corrected values and the standard value are very small.
Table 3. Results for measurement of absorption coefficients variation of gray matter.
According to the results in , extracerebral layers of the head cause the measured absorption coefficient changes in gray matter much smaller than the real value because the optical pathlength in gray matter is much smaller than the total pathlength between the source and detector. After correcting the partial volume effect with Monte Carlo simulations, the measured value is very close to the real value. For example, we can see from the data in the first row for 760 nm, the standard value (real value) is 0.0019 mm−1, and the measured value for 29 mm and 35 mm is both 0.0021. The measured values are larger than the standard value about only 0.0002 mm−1. Actually, the measured values are averaged larger than the standard value about 6% for the whole data set. We speculate the 6% error is mainly from the absorption of agar, the optical parameters used for introlipid and the instrument error.
5. Conclusions
We investigate the influence of extracerabral layers for optical properties measurement for the head in this paper. In fact, Monte Carlo simulations for five-layered model have been used for physiological interference study [Citation10] before. However, a real five-layered model has not been implemented to study the partial volume effect introduced by extracerabral layers as far as we know. Thus we fabricate the head model includes the scalp, skull, cerebrospinal fluid, gray matter and white matter. To simulate the brain activity, we change the absorption coefficient in the gray matter and then utilize the optical measurement system to measure the optical density changes. We adopt different source-detector spacing to achieve the sensitive position for source and detector distance. The source-detector distance of 29 mm and 35 mm are chosen for the suitable distance according to the results. The measured data for the changes in the absorption changes of gray matter is quite consistent with modified Lambert-Beer law.
Due to the presence of extracerebral layer, the accuracy of near-infrared spectroscopy is degraded due to the difference between the partial optical pathlength and the mean optical pathlength. Thus we adopt Monte Carlo simulations to obtain partial optical pathlength and mean optical pathlength to compensate the partial volume effect. After correcting the partial volume effect, the measured data can be compared with the true value directly for different wavelength and different source-detector spacings. The results indicate the performance of functional near infrared spectroscopy is influenced by the extracerebral layer when we want to know the optical properties of deep layer. However, if the anatomic structure of the brain could be predicted or measured with other technologies, Monte Carlo simulations are a possible way to be implemented to correct the measured data. Therefore, we verified with the in-vitro experiments with five-layered model that the partial volume effect can influence the detection for optical parameters in gray matter and the possible correction method with Monte Carlo simulations.
Disclosure statement
No potential conflicts of interest were disclosed.
Additional information
Funding
References
- Ferrari M, Quaresima V. A brief review on the history of human functional near-infrared spectroscopy (fNIRS) development and fields of application. NeuroImage. 2012;63:921–935.
- Scholkmann F, Metz AJ, Wolf M. Measuring tissue hemodynamics and oxygenation by continuous-wave functional near-infrared spectroscopy-how robust are the different calculation methods against movement artifacts? Physiol Meas. 2014;35:717–734.
- Dehaes M, Grant PE, Sliva DD, et al. Assessment of the frequency-domain multi-distance method to evaluate the brain optical properties: Monte Carlo simulations from neonate to adult. Biomed Opt Express. 2011;2:552–567.
- Torricelli A, Contini D, Pifferi A, et al. Time domain functional NIRS imaging for human brain mapping. Neuroimage. 2014;85:28–50.
- Carp S, Boas DY, Sajjadi A, et al. Recovery of brain blood flow changes from diffuse correlation spectroscopy data using a layered Monte Carlo forward model, Biomedical Optics. Poster Session II (BM3A). 2014.
- Selb J, Ogden TM, Dubb J, et al. Comparison of a layered slab and an atlas head model for Monte Carlo fitting of time-domain near-infrared spectroscopy data of the adult head. J Biomed Opt. 2014;19:016010.
- Strangman G, Franceschini MA, Boas DA. Factors affecting the accuracy of near-infrared spectroscopy concentration calculations for focal changes in oxygenation parameters. Neuroimage. 2003;18: 865–879.
- Umeyama S, Yamada T. Monte Carlo study of global interference cancellation by multidistance measurement of near-infrared spectroscopy. J Biomed Opt. 2009;14:064025.
- Van Staveren HJ, Moes CJ, van Marie J, et al. Light scattering in intralipid-10% in the wavelength range of 400-1100 nm. Appl Opt. 1991;30:4507–4514.
- Okui N, Okada E. Wavelength dependence of crosstalk in dual wavelength measurement of oxy- and deoxy-hemoglobin. J Biomed Opt. 2005;10:011015.
- Zhang Q, Brown EN, Strangman GE. Adaptive filtering for global interference cancellation and real-time recovery of evoked brain activity: a Monte Carlo simulation study. J Biomed Opt. 2007;12:044014
- Shang Y, Gurley K, Yu G. Diffuse Correlation Spectroscopy (DCS) for assessment of tissue blood flow in skeletal muscle: recent progress. Anat Physiol. 2013;3:128.
- Wang LH, Jacques SL, Zheng LQ. MCML-Monte Carlo modeling of light transport in multi-layered tissues. Comput Methods Programs Biomed. 1995;47:131–146.