
 ?Mathematical formulae have been encoded as MathML and are displayed in this HTML version using MathJax in order to improve their display. Uncheck the box to turn MathJax off. This feature requires Javascript. Click on a formula to zoom.
Abstract
Simple fractal dimensions have been proposed for use in the analysis of the characteristics of digitized tongue pictures and tongue coating texture, which could further the establishment of objectified classification criteria under the conditions of expanding sample size. However, detailed descriptions on simple fractal dimensions have been limited. Therefore, BP (back propagation) neural network model classifiers could be designed by further calculation of the multiple fractal spectrum characteristics of digitized tongue pictures in order to classify and recognize the thin/thick or greasy characteristics of tongue coating. The fractal dimensions of sample data of 587 digitized tongue pictures were collected in a standard environment. A statistical analysis was conducted on the calculation results of the sample data, and the sensitivity of the fractal dimensions to the thin/thick and greasy characteristics of digitized tongue pictures was observed. As the overlap region resulted from a range of values of a single parameter, another 8 characteristic parameters of the multiple fractal spectra of the digitized tongue pictures were further proposed as the elements in the input layer of the three-layers BP neural network. Automatic recognition classifiers were designed and trained for the characteristics of digitized tongue pictures and tongue coating textures. The simple fractal dimension was sensitive to the thin/thick and greasy characteristics of digitized tongue pictures and could better judge the characteristics of the thickness of the tongue coating. A classifier with characteristic parameters of multiple fractal spectra as the input vectors identified by the BP neural network models could effectively increase the accuracy rate judged by the characteristics of the tongue coating texture.
Introduction
Tongue diagnosis, as one of the special diagnostic methods in traditional Chinese medicine (TCM), is a part of inspection diagnosis [Citation1]. It is defined as a comprehensive diagnosis method for syndrome differentiation based on tongue color, tongue coating, tongue shape and sublingual veins [Citation2]. The presentation of the tongue is believed to be closely associated with in vivo viscera, qi and blood as well as body fluids; tongue appearance can be used not only as an auxiliary diagnostic indicator for multiple diseases but also as an indicator for the self-monitoring of daily health [Citation3]. In modern times, computer science and technology have matured, and the computer-assisted digitized management and analysis of tongue pictures has become one of the hot topics in the objectification of TCM tongue diagnosis [Citation4,Citation5]. Its study contents mainly include color-orientated analysis of tongue color and tongue coating color [Citation6], geometrical morphology-focused analysis of tongue shapes [Citation7], and texture structure-dominated analysis of tongue coat texture [Citation8]. Currently, the analysis of tongue shapes and coating texture structures is limited by disadvantages in the digitized analysis of the objectification of tongue pictures because consensus cannot easily be made in field of standard classification due to a lack of complete mathematical data support in relative studies [Citation9]. In the study fields of the objectification of TCM tongue diagnosis, there are less specific studies to analyze the tongue coating texture in tongue pictures [Citation10]. Representative studies include the analysis of tongue coating texture in tongue pictures based on Gabor wavelet transform proposed by Dapeng Zhang [Citation11,Citation12] from the Harbin University of Institute, the analysis and recognition of characteristics of tongue coating texture in tongue pictures based on the nutrition statistical method proposed by Jiatuo Xu [Citation13,Citation14] from the Shanghai University of Traditional Chinese Medicine, and the analysis of characteristics of greasy tongue coat texture in tongue pictures based on subspace method proposed by Baoguo Wei [Citation15] from the Beijing University of Technology.
Background
An analysis of the texture of tongue coating in a digital tongue focuses on analyzing and identifying the thin/thick and greasy characteristics of the tongue coating (i.e., whether the tongue coating is thin or thick and whether the tongue coating is greasy) by managing digitized tongue pictures [Citation16]. During the observation and analysis of digitized tongue pictures it was found that the tongue pictures with a thick tongue coating were rough. The thinner the tongue coating was, the smoother the tongue pictures would become, whereas the tongue pictures of curdy and greasy tongue coatings were marked by granules with uneven sizes. Therefore, the density of the tongue coating could reflect the level of crudeness and greasiness in tongue coatings [Citation17]. Tang Rongsheng [Citation11] extracted the characteristics of tongue coating textures using Gabor wavelets based on the pretreatment of removing the samples’ reflective spots and tested the classification results using sample training classifiers; the results indicated that the combined use of different classifiers could enhance the classification results. Wei Baoguo [Citation15] applied the subspace method to judge the density of tongue coating texture structures with the projection length as the classification characteristics and comprehensively judged the types of curdy and greasy tongue coating in digitized tongue pictures combined with the characteristics of the roughness of tongue coating texture. It could be concluded from the summarization and analysis of the study results of tongue coating texture in tongue pictures at the present stage that the roughness and density of tongue coating texture were closely associated with the thin/thick and greasy characteristic parameters of tongue coating. However, the establishment of a standard classification still lacks strong support from objective data as the description of the roughness of the tongue coating texture in tongue pictures mainly depends on the distinguishability of the tongue pictures collected [Citation18]. Meanwhile, with the development of nonlinear science, fractal dimension, a powerful new instrument, has been developed in the analysis of medical pictures. In 1984, A.P. Pentland proved that the fractal characteristics on the surfaces of objects were consistent with the fractal characteristics of normal vectors and their components on surface; the belief then was that if a rough surface had fractal characteristics, so did the gray surfaces of the pictures produced [Citation19]. Based on this theory, numerous scholars have further studied pictures-related fractal theories or used this theory as a basic instrument to explore the related issues in all fields of application [Citation20–23]. Currently, in the analysis of image texture and pattern recognition, many reports on analysis and study using fractal theories have been found. The self-similar concept of fractal theory coincides with the TCM theory of “correspondence between man and universe,” a basic syndrome differentiation mode in TCM [Citation24]. Therefore, fractal dimensions and a stable data size can be used to describe the roughness of a tongue coating texture analyze the thin/thick and greasy characteristics of tongue coating and the division of classification criteria.
Methods
Digitized tongue pictures
According to ISO 20498-2, the collection light environment was set as follows: illuminance, 6500 lux; color rendering index, 95; and color temperature, 6500 K. The geometrical conditions of the lighting source arranged the light paths based on 45°/0° (angle of illumination/angel of observation), and the sizes of the collected pictures were (512–768) × 512 [Citation25].
The primary subjects for the collection of tongue pictures were undergraduates with healthy body indexes. The age distribution was 19–22 years old. For the effective data, 499 digitized tongue picture samples were developed under standard collection conditions, and each tongue picture had an investigation table of artificial analysis of tongue picture texture from TCM experts. To analyze the characterized tongue pictures, another 88 collected tongue pictures with obvious texture characters were collected clinically, among which 44 had a thick tongue coating and 44 had a curdy and greasy tongue coating.
Simple fractal dimensions spectrums
Fractal dimension is a quantitative description for fractal characteristics, and there are numerous calculation methods for simple fractal dimensions with irregular fractions, such as the grayscale-based difference method, the calculation method based on self-similar fractal Brownian motion models, the basic differential box-counting method, the wavelet decomposition-based fractional-dimensional approach, and the covering blanket method [Citation26]. Compared with other algorithms, the differential box-counting method and its derived algorithms are sensitive to tongue coating textures with a low degree of roughness, and they are sharper in changes when the roughness is low, meeting the requirements for the judgment of tongue coating texture [Citation27]. Meanwhile, Wang Diji [Citation28] calculated the time consumed by different algorithms in calculating the fractal dimensions of pictures in the same group and concluded that the basic differential box-counting method was advantageous in terms of lower average calculation time and lower algorithm complexity.
Determination of simple fractal dimensions of digitized tongue pictures
On the basis of pretreatment such as the subarea division of digitized tongue pictures collected in a standard environment [Citation29], the digitized pictures of tongue coating texture were converted to grayscale pictures to extract the gray value corresponding to each pixel. The gray values were converted to effective plot areas to form gray surfaces through interval mapping. Tetragonal prisms were set to cover the gray surfaces, the heights of which were determined by the difference in maximum and minimum gray values on gray surfaces in the coverage areas of tetragonal prisms. The subface of a tetragonal prism was taken as δ*δ, and the body of a tetragonal prism was moved step by step to all pixel points. Ω(δ) was defined as the total volume obtained by summing the volumes of all tetragonal prisms. The size of δ was changed gradually, and a series of Ω(δ) could be obtained if δ was 1, 1/2, 1/4 and so on. shows the 3-dimentional (3D) surfaces of the tetragonal prism-covered gray surfaces corresponding to different numerical values of δ. N(δ) = Ω(δ)/δ3. lnN(δ)-ln(1/δ) curves were constructed, and the slopes of linear parts were considered to be fractal dimension D.
Figure 1. Changes of gray surfaces during fractal calculation, (a) δ = 1, (b) δ = 1/2, (c) δ = 1/4, (d) δ = 1/8.
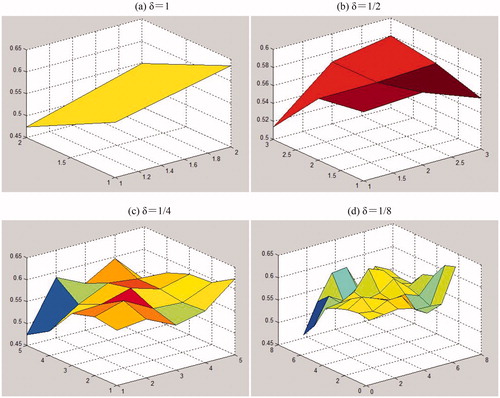
According to the definition of fractal dimensions, the smaller the subarea size, the more accurate the fractal dimension of the calculated picture would be. δ could be designed into the size of a pixel point minimally as it did not have fractal property after entering into the dimensions of pixel points to form the 2-dimension (2D) sets, and its upper limit could be set as the length of a pre-treated picture.
Multiple fractal spectrums
The basic differential box-counting method does not consider the counts of box pixels, and it is easy to lose detailed information as it only applies average descriptions to the study subjects overall. Multiple fractal dimensions, also termed as fractal measures, can comprehensively reflect the probability distribution set of pixels counts in the box after normalization. The width of multiple fractal spectra can quantify the degree of roughness of the characteristics on the surface, the maximum and minimum probability subsets of multiple fractal spectra, and the ratios of the number of maximum and minimum surface heights. The application of multiple fractal spectra can supplement the disadvantages of simple fractal dimensions, which lack detailed information description [Citation30].
Determination of characteristic parameters of multiple fractal spectrums of digitized tongue pictures
When there were overlapped areas in the value domains of characteristic parameters of different types of sample data, a classification could not be made using value domains by selecting only one characteristic parameter. However, multiple fractal spectra could obtain a group of probability distribution sets using the pixel count in the normalized box and effectively compensate for the disadvantages (e.g., lack of detailed information) of simple fractal dimensions.
1. Probability measure
Pretreated digitized tongue pictures were covered by tetragonal grids using ε as the dimension (ε ≤ 1: the size of the whole picture was 1). The pixel count with fractal properties in each ε-dimension grid was recorded as Nij, and the total number of grids with fractal properties in the whole fractal dimension pictures was recorded as ∑Nij. The probability measure, also known as the occupying rate of fractal dimension pictures in each ε-dimension grid, could be obtained using the following formula:
Thereby, the distribution of a probability measure Pij(ε) of the physical quantities in the discussed fractal structures could be obtained.
2. Partition function
The partition function Xq(ε) of the multiple fractal system was defined as , i.e., the partition function was defined as the weighted summation of q power of probability measure Pij, in which q could be from −∞ to +∞. q was termed as the weight factor, and different q represented the ratios of different probability measure Pij in partition function Xq(ε) to exert a specific contribution of probability measure Pij to Xq(ε). In practical application, |q| ≤ 100 was advisable. In this study, |q| ≤ 60 was applied.
Based on the characteristics of fractal structures, Xq(ε) also had certain scale relationships in scale-free self-similar areas, i.e., there were power-function relationships in Xq(ε) scale parameter ε. Hence, the quality index could be obtained from lnXq-lnε curve slopes, as shown in the following formula.
3. Characteristic parameters of multiple fractal spectra
Generalized dimensions D(q) and multiple fractal spectra f(α) could be calculated using the quality index τ(q), as shown by following formula:
Fractal spectra f(α)−α of randomized fractal pictures were obtained, in which 8 parameters were used as characteristic quantities.
αmin: The minimum value of singular exponent α;
αmax: The maximum value of singular exponent α;
fmin: Value of multiple fractal spectrum f(α) corresponding to αmin;
fmax: Value of multiple fractal spectrum f(α) corresponding to αmax;
Spectral width: Value of αmax−αmin;
Spectral difference: Value of fmax−fmin;
αd: Value of singular exponent α that resulted in a maximum value of f(α);
B: One of the parameter in the quadratic fit curve of f(α), also termed as the degree of asymmetry.
Design of classifiers
Three layers of the BP neural network mode structures were established [Citation31], i.e., the input layer, hidden layer and output layer. The network coefficient was initialized first followed by input of the training data. Then, programs were used to calculate the deviation between the practical input values and expected input values, after which the network coefficient was modified according to the satisfactory degree of deviation. The network deviation limit was initially set up, iteration training was performed on the BP neural network, and the deviation was controlled and regulated so that the network input could always be convergent to the deviation limit to finish the establishment of the network models.
In this study, the characteristic parameters of multiple fractal spectra were used to judge the characteristics of tongue coating texture, e.g., whether the tongue coating was thin or thick and whether the coat was greasy in the tongue pictures. Therefore, the number of input layer units of the BP neural network was set as 8, and the number of output layer units was 1. The experiment indicated that if the number of units in hidden layer was too low, the network could not have the necessary learning capacity; if the number was excessive, it would increase the complexity of the network structures greatly. Therefore, the selection of the number of units in the hidden layer should also be emphasized by neural network researchers. Based on the method verified by Shen Huayu [Citation32] to determine the number of units in the hidden layer, the number of units in the hidden layer was set to be 9 and the initially set learning rate was 0.1 in this study [Citation33].
Results
Analysis of simple fractal dimensions of digitized tongue pictures
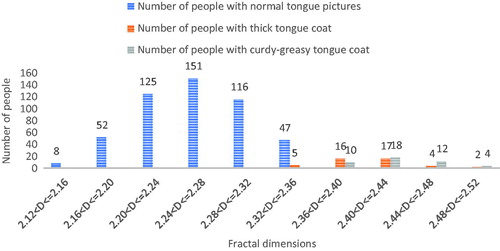
A pretreatment including subarea division and size normalization was conducted to digitized tongue pictures for texture analysis, and the differential box-counting method was applied for the calculation of the fractal dimensions of 2 D pictures. The fractal dimensions of digitized tongue picture samples from healthy students were 2.14–2.36 and in normal distribution, whereas the fractal dimensions of digitized tongue pictures with obvious pathological characteristics were notably distinguished from those of normal populations, in which the fractal dimensions of 39 out of 44 tongue picture samples with thick tongue coating were >2.36, and those of 44 tongue picture samples with greasy tongue coat were 2.36–2.52. The detailed parameter distribution is shown in .
Figure 2. Distribution conditions of fractal dimensions of tongue coating texture in 499 normal tongue pictures and 88 thick/greasy tongue pictures.
Preliminary conclusions were obtained specific to the distribution characteristics of the sample data:
Whether the tongue coat was thick or thin was determined by the fractal dimensions of digitized tongue pictures based on the criterion of whether the bottom of the tongue coating was visible or invisible. A thin tongue coating was defined as a coating through which the underlying tongue nature was visible. Meanwhile, a thick tongue coating was defined as a coating through which the underlying tongue nature invisible [Citation15]. Therefore, the simple fractal dimensions of digitized tongue pictures determined by the box dimension method could better judge whether the tongue coat was thick or thin, and minimal sample overlapping occurred when the fractal dimensions were 2.32–2.36.
Whether the tongue coat is greasy was determined by the fractal dimensions of the digitized tongue pictures based on the changes in size and density of the granules on the tongue coating. A greasy coating was mainly marked by fine and densified granules that were fused to be flaky on the tongue coating, and they were thick in the middle of tongue and thin around the tongue [Citation15]. The fractal dimensions of greasy tongue coating samples overlapped partially with the fractal dimensions of the thick tongue coating, and most curdy and greasy tongue coat samples were distributed in middle-to-high data areas in the fractal dimensions of the thick tongue coating sample, when the fractal dimensions were >2.36 because of the lack of partial detailed information as average descriptions were made only for tongue coating texture when the box dimension method was used to determine the simple fractal dimensions of the digitized tongue pictures [Citation34].
Analysis of characteristic parameters of multiple fractal spectrums of digitized tongue pictures
Programs were made to draw the multiple fractal spectra and obtain the characteristic quantities. shows the testing results of the characteristic parameters of multiple fractal spectra of two samples of digitized tongue pictures with different characteristics. shows normal tongue coating samples while shows the greasy tongue coating samples.
Figure 3. Testing results of characteristic parameters of multiple fractal spectrums of digitized tongue pictures.
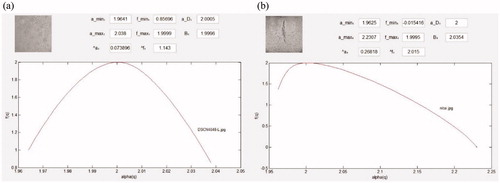
As shown in , the symmetry of the quadratic fit curves of the multiple fractal spectra of the normal tongue pictures is better than the quadratic fit curves of the multiple fractal spectra of greasy tongue pictures. To analyze the degrees of contribution of different characteristic parameters in multiple fractal spectra to the classification and recognition, the balanced sample size was set as the premise, i.e., different types of equivalent sample data in the sample database were collected to obtain the distribution value domains of all characteristic parameters of different types of samples. The sample size of each type was set as 20 in this study. The distributions of the value domains of the sample characteristic parameters are shown in and .
Figure 4. Statistics of comparison results between normal tongue pictures and greasy characteristic parameter spectrums.
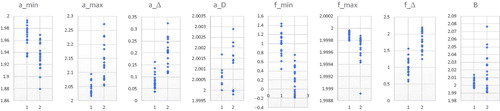
Figure 5. Statistics of comparison results of characteristic parameter spectrums between thin and thick tongue coating.
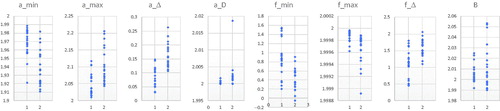
In , type 1 samples are normal tongue pictures, while type 2 samples have a greasy tongue coating. Take spectral width α_Δ = αmax−αmin for example. As shown in the figure, the distribution value domains of 20 normal tongue pictures were ∼0.03–0.17 and focused in 0.03–0.15; Meanwhile, the distribution value domains of 20 greasy tongue coating samples were ∼0.11–0.27 and emphasized in 0.11–0.25, and the spectral width value was about 0.33 in individual greasy tongue coating samples.
In , type 1 samples have a thin tongue coating while type 2 samples have a thick tongue coating. Take spectral width α_Δ = αmax−αmin for example. As shown in the figure, the distribution value domains of 20 thin tongue pictures were ∼0.03–0.15 and were focused in 0.05–0.13. Meanwhile, the distribution value domains of 20 thick tongue coating samples were ∼0.11–0.25 and emphasized in 0.11–0.23, and the spectral width value was ∼0.27 in individual greasy tongue coating samples.
In conclusion, although the categories could be judged preliminarily by analyzing the distribution conditions of all parameter value domains, ideal efficacy could not be achieved under the condition that the sample size could not be expanded persistently. If anyone characteristic parameter was used for classification using the value domain judgement method, there were overlapping areas in all parameter valve domains in different types of samples. Therefore, a proper recognition method should be selected.
Design of classifiers and analysis of results
Usually, the performance of a machine learning algorithm will be affected if the training samples are unbalanced. Therefore, the training samples need to be balanced before training. In this study, after pretreatment including region segmentation and size normalization to the digitized tongue pictures collected in a standard environment, 30 normal tongue pictures, 30 thick tongue coating samples and 30 greasy tongue coating samples were randomly collected and stored in a tongue picture training sample database while the other samples were stored in a test sample database. The training samples are balanced. The sample size for a single test was set to be 20. To ensure experimental accuracy, test samples were randomly collected from the digitized tongue picture test sample database after the number of all types of samples for testing were determined. Then, the following three situations were examined to observe the classification efficacy under 3 different sample balance degrees:
The number of type 1 test samples is larger than that of type 2 test samples.
The number of type 1 test samples is equal to the number of type 2 test samples.
The number of type 1 test samples is less than that of type 2 test samples.
Correct recognition was defined as the coincidence of the predicted and practical types and vice versa. The tansig function and logsig function were set as the activation functions for the hidden layer and the output layer, respectively.
1. Analysis of greasy characteristics of tongue coatings
A total of 30 normal samples (type 1 samples) and 30 greasy tongue coating samples (type 2 samples) were collected from the training sample database of digitized tongue pictures and used as training samples, with the total training sample size of the two kinds of tongue pictures of 60. shows the statistical classification results of the test samples under conditions of 3 degrees of sample balance:
Figure 6. Statistics of accuracy rates of classifiers in identifying greasy characteristics of tongue coating based on multiple fractal spectrums.
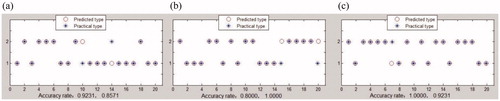
The overall precision rate of recognition was 89.01%, in which 12 out of 13 type 1 samples were identified correctly with a precision rate of 92.31%, and 6 out of 7 type 2 samples were identified correctly with a precision rate of 85.71%;
The overall precision rate of recognition was 90.00%, in which 8 out of 10 type 1 samples were identified correctly with a precision rate of 80.00%, and 10 out of 10 type 2 samples were identified correctly with a precision rate of 100.00%;
The overall precision rate of recognition was 96.16%, in which 7 out of 7 type 1 samples were identified correctly with a precision rate of 100.00%, and 12 out of 13 type 2 samples were identified correctly with a precision rate of 92.31%.
2. Analysis of thick/thin characteristics of tongue coatings
A total of 15 normal samples and 15 thin-greasy tongue coating samples were collected from the training sample database of digitized tongue pictures and used as training samples of thin tongue coating (type 1 samples), and 15 thick tongue coating samples and another 15 thick-greasy tongue coating samples were collected and used as training samples of thick tongue coating (type 2 samples); the total training sample size of the two kinds of tongue pictures was 60. shows the statistical classification results of the test samples under conditions of 3 degrees of sample balance:
Figure 7. Statistics of accuracy rates of classifiers in identifying thin/thick characteristics of tongue coating based on multiple fractal spectrums.
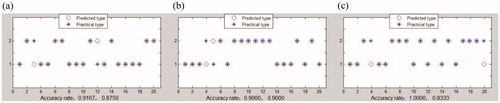
The overall precision rate of recognition was 90.49%, in which 11 out of 12 type 1 samples were identified correctly with a precision rate of 91.67%, and 7 out of 8 type 2 samples were identified correctly with a precision rate of 87.5%;
The overall precision rate of recognition was 90.00%, in which 9 out of 10 type 1 samples were identified correctly with a precision rate of 90.00%, and 9 out of 10 type 2 samples were identified correctly with a precision rate of 90.00%;
The overall precision rate of recognition was 91.67%, in which 8 out of 8 type 1 samples were identified correctly with a precision rate of 100.00%, and 10 out of 12 type 2 samples were identified correctly with a precision rate of 83.33%.
Discussion
In this study, fractal dimension has been used to describe the roughness of tongue coating texture, to achieve the analysis of thin/thick and greasy characteristics of tongue coating and the division of classification criteria. Mathematical support for the objective development of tongue diagnosis in TCM has been put forward. Although, Gabor wavelet transform provides a mathematically complete description, and it is more advisable for the extraction and recognition of the overall characteristics of tongue body due to its relatively significant edge effect [Citation11,Citation12]. However, Rong Liang [Citation35] noted that the clinical analysis of tongue pictures should focus on capturing abnormal information; thus, the characteristics of tongue coating texture cannot be judged intelligently by the overall characteristics of tongue body surface. As to this issue, a subspace method was proposed by Baoguo Wei [Citation15] in which the tongue body areas are divided into subareas with fixed size, and then each subarea would be classified and recognized. This study aimed to capture the abnormal information, therefore, the tongue body was divided into 5 subareas, namely, the apex linguae, middle tongue, root of the tongue, left side of the tongue and right side of the tongue, to achieve the analysis and recognition of characteristics of tongue coating texture in each subarea. The basic concept of the gray-scale differential statistical method proposed by Jiatuo Xu [Citation14] is to describe the pixels of texture pictures and the gray change conditions between adjacent pixels, which is extremely close to the concept of the differential box-counting method (the measure of pixel point was set as bottom margin δ of a tetragonal prism) used in this study. The gray-scale differential statistical method is mainly used to analyze the characteristics of tongue coating texture by judging the ranges of 4 parameter value domains, namely contrast (CON), angle-direction secondary moment (ASM), entropy (ENT) and means (MEAN). However, this study proposed to use the differential boxing-counting approach for the calculation of simple fractal dimensions of digitized tongue pictures, and to consider simple fractal dimensions as effective reference data for the computer-assisted automatic recognition of thin/thick characteristics of tongue coatings. The study results indicated that the accuracy of classification criteria could be further enhanced under the conditions of persistent enhancement of sample data size. If the sample data size could not be expanded persistently, this study proposes that 8 characteristic parameters of multiple fractal spectra of digitized tongue pictures could be collected as input vectors, and three layers of BP neural network classifiers could be designed to establish a neural network model for the judgement of dyadic characteristics of tongue coating texture, e.g., whether the tongue coat is thin or thick and whether it is curdy or greasy. It was concluded from the preliminary statistics and verification of laboratory data that multiple fractal spectrum parameters of digitized tongue pictures had better mathematic quantitative analysis theory and an ideal classification accuracy rate if they were used as the input vectors of the three-layer BP neural network classifiers, the coincidence rate with the judgement of clinical TCM doctors of which reached 90–93%.
In this study, the tongue body was divided into 5 subareas based on corresponding organ distribution, and the characteristics of each subarea was recognized; however, the thin/thick and greasy characteristics of the tongue coating in an overall tongue picture were not judged, which conformed to the doctors thought of capturing abnormal information during the clinical analysis of tongue pictures. However, doctors can make a comprehensive judgement of the whole characteristics of tongue pictures based on the characteristics of each subarea spontaneously when observing tongue pictures. Therefore, the reference weights of thin/thick and greasy characteristics of tongue coatings in appointed subareas can be further added through sample training on the basis of current studies to achieve the comprehensive judgement of the whole characteristics of tongue pictures.
Conclusion
The characteristics of digitized tongue pictures and tongue coating texture can be described by simple fractal dimensions, a kind of stable data size. The study results indicated that the accuracy of classification criteria could be further enhanced under the conditions of persistent enhancement of sample data size. If the sample data size cannot be expanded persistently, the characteristic parameters of multiple fractal spectra of digitized tongue pictures can be used as a mathematical basis with high efficacy in the classification and recognition of thin/thick and greasy characteristics of tongue coatings. Eight characteristic parameters of multiple fractal spectra of digitized tongue pictures were used as the input vectors of the three-layer BP neural network classifiers, and their coincidence rate with the judgement of clinical TCM doctors reached 90–93%.
Acknowledgements
The funding organizations had no role in the design of the study, the collection, analysis, and interpretation of the data, or the writing of the manuscript.
Disclosure statement
The authors declare that they have no competing interests.
Additional information
Funding
References
- Ji DF. Syndrome differentiation of traditional Chinese medicine tongue pictures. Tianjin: Tianjin Science & Technology Translation Publishers; 2008.
- Song TB. Atlas of traditional Chinese medicine tongue coat. Beijing: People’s Medical Publishers; 2003.
- Zhu WF. Diagnostics of Chinese Medicine. Shanghai: Shanghai University of Chinese Medicine Publishers; 2006.
- Shen LS. Collection and analysis of tongue pictures in traditional Chinese medicine. Beijing: Beijing University of Technology Publishers; 2007.
- Huang SQ, Zhang YL, Zhou J, et al. Research progress on the objectification, quantitation and standardization of tongue manifestation in traditional Chinese medicine. China J Traditional Chinese Med Pharmacy 2017;4:1625–1627.
- Zhuo L, Zhang P, Qu P, et al. A K-PLSR-based color correction method for TCM tongue images under different illumination conditions. Neurocomputing 2016;174:815–821.
- Zhang J, Hu G, Zhang X. Extraction of tongue feature related to TCM physique based on image processing. Int Comp Conf Wavel Active Media Technol Info Proc IEEE 2016;6:251–255.
- Xu WM, Wang CC, Hu JQ. Research progress and problems analysis of objective measurement of Tongue Fur. World Chinese Med 2017;12:1997–2000.
- Zhang J, Qian J, Wang RJ, et al. Research status of objective characteristics of TCM digitized tongue. World Sci Technology-Modernization Traditional Chinese Med. 2014;11:2420–2424.
- Jiang SH, Lin J. Review on objective and essential research of tongue image. Shanghai J Traditional Chinese Med. 2016;7:94–97.
- Tang RS. Traditional Chinese medicine-based texture analysis of thickness of tongue coating[dissertation]. Harbin Inst Technol. Harbin: Harbin Institute of Technology; 2007.
- Zhai TT, Xia CM, Wang YQ, et al. Recognition of greasy or curdy tongue coating based on Gabor wavelet transformation. Com Appl Softw. 2016;33:162–166.
- Tu LP, Xu JT, Zhang ZF. Study on the recognition method of the greasy tongue coating. Proc Twelfth Annual Conf Chinese Med Diagnosis. 2011;7:75–79.
- Xu JT, Sun Y, Zhang ZF. Analysis and discrimination of tongue texture characteristics by difference statistics. J Shanghai Univ Traditi Chin Med. 2003;17:55–58.
- Wei BG, Shen LS, Cai YH, et al. Research on curdy and greasy tongue fur analysis for traditional Chinese medicine. Acta Electronica Sinica. 2003;31:2083–2086.
- Tsung-Chieh L, Lun-Chien L, Wu FC. Traditional Chinese medicine for metabolic syndrome via TCM pattern differentiation: Tongue diagnosis for predictor. Evid-Based Compl Alt Med. 2016;10:1–8.
- Liu CY. Texture based tongue classification and its application[dissertation]. Harbin: Harbin Institute of Technology; 2006.
- Qi Z, Xu JT, Zhang ZF, et al. Progress in clinical application of tongue inspection objectivity based on digital image processing technique. China J Traditional Chinese Med Pharm. 2015;8:2849–2851.
- Pentland AP. Fractal-based description of natural scenes. IEEE Trans Pattern Anal Mach Intell. 1984;PAMI-6:661–674.
- Zhou CX, Chen GM, Tan YQ. Fractal measurement and characterization on roughness of coarse aggregate surface texture. J Harbin Inst Tech. 2009;41:85–89.
- Keller JM, Chen S, Crownover RM. Texture description and segmentation through fractal geometry. Comput Vision Graph. 1989;45:150–166.
- Liu Y, Lin J, Chen K. A stable algorithm of box fractal dimension and its application in pore structure. Rare Metal Mat Eng. 2015;44:800–804.
- Feng G, Wang M, Wang M, et al. Connotations of pixel-based scale effect in remote sensing and the modified fractal-based analysis method. Comput Geosci. 2017;103:183–190.
- Zhang QM. Introduction of mathematic traditional Chinese medicine. Beijing: Chinese Ancient Book Publishers; 2011.
- Qi Z, Tu L, Chen J, et al. The classification of tongue colors with standardized acquisition and ICC profile correction in traditional Chinese medicine. Biomed Res Int. 2016;1:1–9.
- Sun X, Wu ZQ, Huang Y. Fractal principle and application. Beijing: Publishers of University of Science and Technology of China; 2006.
- Foroutan-Pour K, Dutilleul P, Smith DL. Advances in the implementation of the box-counting method of fractal dimension estimation. Appl Math Comput. 1999;105:195–210.
- Wang DJ, Zhao HY, Peng H. Extraction and application of texture characteristics based on fractal dimensions. J Shihezi Univ 2007;25:650–653.
- Li ZL, Su YT. A kind of method for separation between tongue coating and nature based on clustering. Acta Scientiarum Naturalium Univ Nankaiensis 2017;4:52–56.
- Wang ZL. Multiple fractal spectrums and the calculation. J B Univ Aeronautics Astronautics 2006;23:256–258.
- Geng GH, Sun W, Luo P. Recognition of neural network models. Softw Guide 2008;7:81–83.
- Shen HY, Wang ZX, Gao CY. Determining the number of BP neural network hidden layer units. J Tianjin Univ Technol 2008;2:13–15.
- Ding S, Su C, Yu J. An optimizing BP neural network algorithm based on genetic algorithm. Artif Intell Rev. 2011;36:153–162.
- Ding J, Cao G, Meng D. Classification of tongue images based on doublet SVM. Int Symp Syst Soft Reliab IEEE. 2016:77–81.
- Chen SH, Liang R. Tongue texture analysis: problems and solutions. World Sci Technology-Modernization Traditional Chinese Med 2006;8:22–25.