
 ?Mathematical formulae have been encoded as MathML and are displayed in this HTML version using MathJax in order to improve their display. Uncheck the box to turn MathJax off. This feature requires Javascript. Click on a formula to zoom.
Abstract
Acoustic nonlinear parameter β, was of great interest in tissue characterization in recent years. Nonlinear imaging methods have been reported to provide improved spatial and contrast resolution. We introduce a nonlinear imaging method derived from nonlinear wave equation based on Gaussian-form solution assumption, which can be applied in pulse-echo mode on diagnostic ultrasound. Through making the use of two pulse transmission, only nonlinear effects are reserved and other effects like scattering, diffraction and linear attenuation can be eliminated. For validation of this method a set of simulation results are generated with a nonlinear simulator. Simulated images also indicate that our method clearly describes the spatial distribution of B/A in the medium.
1. Introduction
In recent years, ultrasound nonlinear parameter imaging has attracted significant attention for tissue characterization purposes [Citation1–4]. During the propagation of an ultrasound wave, the nonlinear effects, which include distortion of the waveform, harmonics generation and additional attenuation, degrade the accuracy and quality of ultrasound image [Citation5]. The quantification of nonlinear effects in tissue can be evaluated through the measurement of acoustic nonlinear parameter (). Moreover, compared with linear parameters like acoustic impedance and sound of speed using in B-mode, acoustic nonlinear parameter is more sensitive to tissue composition and pathological feature.
On the basis of nonlinear effects, a number of nonlinear imaging methods have been proposed in the last decade. In tissue harmonic imaging (THI), image reconstruction is made from second harmonic wave generated from nonlinear effects and the acquired tissue image shows improved quality with higher SNR over traditional linear imaging [Citation1]. However, the acoustic nonlinear parameter B/A imaging methods in transmission mode require supersensitive acoustic hydrophones [Citation6,Citation7] while the methods in reflection mode need an acoustic reflector plane to reflect acoustic wave back completely [Citation8]. These conditions are device limitations for in vivo applications.
Three measurement methods of nonlinear parameter in homogeneous media were extended to heterogeneous media in [Citation2]. The extended comparative method (ECM) presented the best result in the simulation [Citation2]. A method proposed to improve the estimation of nonlinear parameter with ECM by a high frame rate imaging approach based on plane wave transmission [Citation3]. However, they need an area where the nonlinear parameter is constant throughout the entire image depth as reference medium.
Ruud et al. investigated a tissue nonlinearity imaging method based on a 1-D solution of the nonlinear lossy Westervelt wave equation [Citation4]. In that paper, acoustic nonlinear parameter is related to the ratio of fundamental and second harmonic envelopes. They combined the ratio and an expression of the harmonic pressure filed derived by analyzing the Green’s function based contrast source solution of 1-D nonlinear lossy Westervelt equation. It has a limitation that variations in speed of sound may affect the estimation.
In [Citation9], Mehrdad Nikoonahad and Liu introduced a method for nonlinear parameter measurement based on single frequency pulse-echo signals. It utilized the spatial integral of echo signal received by transducer array to estimate acoustic nonlinear parameter in tissue with a nonlinear least square fitting. Based on Nikoonahad’s method, a two-pulse transmission approach under an assumption of wave nonlinear propagation with small or infinitesimal amplitudes was described by Fatemi and Greenleaf [Citation10]. Their acoustic nonlinear imaging method requires the ratio of two-transmission pulse to be at least 9.6 dB that is beyond the ability of commercial ultrasound device.
In this paper, we first consider the nonlinear propagation of ultrasound wave. Then a nonlinear parameter imaging method is introduced with Gaussian-form solution assumption and pulse-echo mode in clinical ultrasound device. This method can be easily realized in commercial clinical device. “Wave Propagation in Nonlinear Media” section includes a brief review of nonlinear propagation theory. Our method is given in “Nonlinear Imaging Method” section and then we evaluate its performance through three simulations and an experiment in vitro in “Simulations” and “Experiment” sections, respectively. The results of simulations and experiment are illustrated in “Results” section.
2. Method
2.1. Wave propagation in nonlinear media
Nonlinear propagation can be described by KZK equation and Westervelt equation. Kuznetsov, Zabolotskaya and Khokhlov (KZK) investigated a nonlinear wave equation [Citation11,Citation12] in terms of sound pressure. Compared with Bargers’ equation model, the diffraction phenomenon was considered in KZK equation. Westervelt used pressure as a variable and reported a second-order wave equation which depicted acoustic pressure varying with space, time, and medium characteristics [Citation13]. The relationship between KZK and Westervelt equation was discussed by Tjotta and Tjotta [Citation14]. They derived a nonlinear differential equation in terms of density
(1)
(1)
where
denote velocity, density, viscosity, nonlinear parameter, respectively.
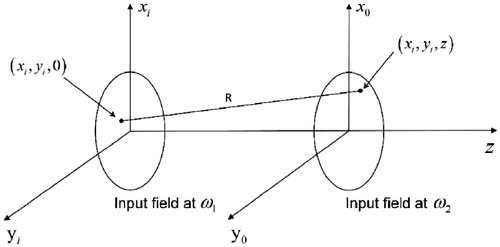
An approximate solution of the equation under narrow-band condition in a hypothetical Gaussian form was given by Mehrdad Nikoonahad and Liu [Citation9]. By assuming an ultrasound acoustic pressure field in cylindrical coordinates in , they stated a paraxial approximation of the solution can be written as:
(2)
(2)
where
describes the density variation with spatial distribution in fundamental frequency, H1 denotes the diffraction term [Citation9],
denote attenuation coefficient, wave number, amplitude of the fundamental frequency component at
respectively. The sech(.) term represents the extra fundamental attenuation due to nonlinear effects. The second harmonic component has a similar form.
Figure 1. Cylindrical coordinates of ultrasound acoustic pressure field.
2.2. Nonlinear imaging method
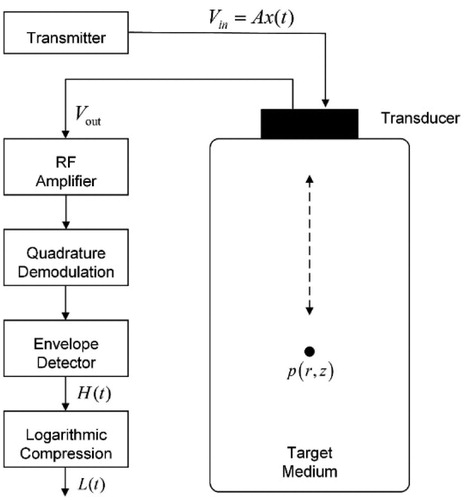
In this section, we represent the ultrasound pulse-echo mode widely used in clinical imaging equipment. The system is described in . In this mode, the nonlinear medium is assumed to be isotropic and a particle located at point p(r, z) is on the center axis of the probe. The probe locates at the surface of the target medium and transmit an ultrasound beam stimulated by excitation pulse Ax(t) from signal generator. After linear and nonlinear propagation, the impulse response is amplified by signal amplifier and envelope detected.
Figure 2. Pulse-echo mode in clinical ultrasound system.
In common ultrasonic transducer array probes, the output signal of transducers can be calculated by a sound field integral on receive aperture. Based on Equationequation (2)(2)
(2) the fundamental component of the output signal can be given by:
(3)
(3)
Where C denotes a constant representing the efficiency of transducer which can be measured by experiment, G1 denotes the fundamental diffraction term [Citation9]. Vin denotes excitation pulse voltage, which can be defined in the following form
(4)
(4)
where A denotes the peak voltage of excitation pulse, x(t) denotes sinusoidal excitation.
Substitute Equationequations (4)(4)
(4) into Equationequation (3)
(3)
(3) and the envelope of fundamental echo after amplification and quadrature demodulation (see in ) is written as
(5)
(5)
where N denotes amplifier gain of the system.
We can see from this formulation, many factors impact the envelope of fundamental response including amplifier gain, output pulse, additional attenuation due to nonlinear effects and generation of echo envelope in medium. These effects decide the information in ultrasound fundamental echo envelope together.
For the purpose of appropriate display, the envelope of response signal needs logarithmic compression to reduce the dynamic range in which the I(t) is written as
(6)
(6)
where D denotes a linear term depending on expected dynamic range and G denotes the overall gain of system.
We introduce an ultrasound nonlinear imaging method based on the nonlinear propagation theory and the pulse-echo mode. This method requires two-pulse transmission with different peak-to-peak exciting voltages. The medium is assumed to be motionless. The nonlinear information of the medium can be deduced from the difference between the envelope of the echo signal.
Assumed that the excitation pulse with peak voltage A1 and A2 generated in two-pulse transmission are given by
(7)
(7)
(8)
(8)
According to Equationequation (5)(5)
(5) , the received envelopes of two fundamental response are H1 and H2, respectively. We adjust the signal amplifier gains of ultrasound system in H1 and H2 to be
(9)
(9)
where N1 and N2 denote amplifier gains, A2 and A1 denote peak voltage of excitation pulse in two-pulse transmission, respectively.
We here introduce a nonlinear imaging function which utilizes the fundamental envelope of the two transmissions as:
(10)
(10)
Substitute Equationequations (7)(7)
(7) and Equation(8)
(8)
(8) into Equationequation (5)
(5)
(5) and then substitute Equationequation (5)
(5)
(5) into Equationequation (6)
(6)
(6) . The difference of echo envelope between two transmissions can be deduced as:
(11)
(11)
By combining Equationequations (8)(8)
(8) and Equation(9)
(9)
(9) , we derive the ultrasound nonlinear imaging function as:
(12)
(12)
where
(13)
(13)
which is related to probe transfer efficiency, depth and medium density. Therefore, the amplifier gains and excitation pulse effects in two-pulse transmission are eliminated which means only the nonlinear effects will dominate the result of this function.
EquationEquation (12)(12)
(12) demonstrates that in the case of known A1 and A2, L(t) represents the level of additional nonlinear attenuation of fundamental frequency component due to the nonlinear effects. Moreover, we can see from Equationequation (12)
(12)
(12) that the amplifier gain, medium acoustic impendence, scatter characteristic, diffraction effects and other factors are not relevant to the result. Hence, the nonlinear imaging function, L(t), varies with
and exposes the depth (time) distribution of nonlinear feature in the medium.
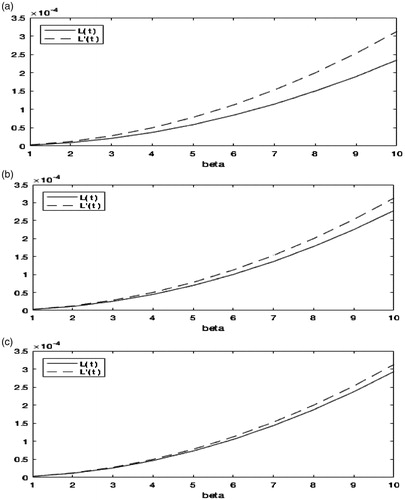
In [Citation10], the authors described an absolute imaging method (L`(t)) which assumed A1/A2 is at least 9.6 dB so that This means the hyperbolic term can be ignored. However, in clinical ultrasound device, it is difficult for data acquisition and processing at more than 9.6 dB power level. Based on our imaging function, the ratio has no special limitation which makes it more easily to be realized. The calculated curves of L(t) (solid line) and L`(t) (dashed line) are plotted in . The difference between two functions increase with a decrease in peak voltage ratio. At a voltage ratio of 6 dB, this difference is too obvious to be ignored. In other words, the deviation between two functions will affect the imaging results while both are implemented on diagnostic ultrasound.
Figure 3. (a) Theoretical curves of L(t) (solid line) and L`(t) (dashed line) at 6 dB, (b) Theoretical curves of L(t) (solid line) and L`(t) (dashed line) at 9.6 dB, (c) Theoretical curves of L(t) (solid line) and L`(t) (dashed line) at 12 dB.
2.3. Simulations
In order to verify the relationship between our imaging function and the nonlinear parameter we utilize an ultrasound image-simulation tool (CREANIUS) [Citation15] for nonlinear parameter imaging. Its simulated RF signal contains the computation results of fundamental and second-harmonic components due to nonlinear propagation in the medium.
This section presents three simulations based on imaging function L(t). Probe parameters used in our simulations are summarized in . Q, D in Equationequation (12)(12)
(12) were set to 0.25 and 1, respectively.
Table 1. Summary of the probe parameters.
2.3.1. L(t) versus different nonlinear parameter values
To verify our imaging method, a homogeneous phantom composed of 10,000 scatters is used to simulate. the ultrasound attenuation coefficient is set to 0.5 dB/MHz/cm. Hanning windowed 4-cycle sinusoidal burst at 3 MHz are transmitted into the medium. The initial acoustic pressures are set to 200kpa, 100kpa, 66kpa and 50kpa, respectively, which means the ratio (A1/A2) to be 6 dB, 9.6 dB and 12 dB.The nonlinear parameter in simulation ranged from 1 to 10.
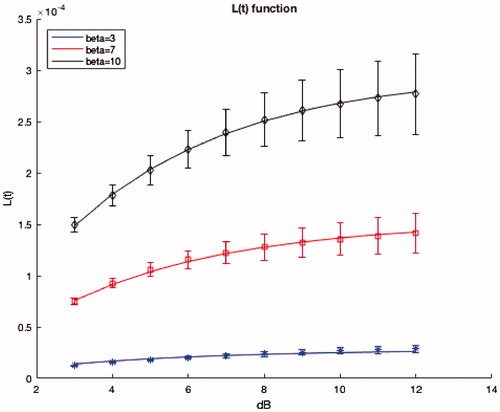
2.3.2. L(t) versus different excitation power values (A1/A2)
To investigate variations of nonlinear imaging function versus different voltage peak ratio, we implement another simulation, in which the equals to 3, 7, 10, respectively. In this simulation, the ratio (A1/A2) changes from 3 to 12 dB.
2.3.3. Half-space phantom simulation
Due to the similarities among linear parameters, the difference between two mediums is difficult to be detected in conventional B-mode image. According to our imaging function L(t), the generated nonlinear image of two mediums shows the difference clearly. We setup a simulation to check or prove is it’s correct.
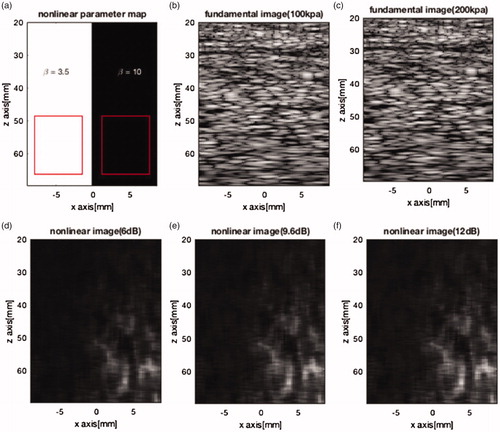
In this part, we generate a nonlinear image for a half-space phantom with 100,000 scatters. The nonlinear map of half-space phantom is shown in and it is consisted of two kind of mediums with different nonlinear parameters. The left half of nonlinear parameter is set to 3.5 and the right half is 10. The initial acoustic pressures are set to 200kpa, 100kpa, 66kpa, 50kpa, respectively, which means A1/A2 ratios are 6 dB, 9.6 dB, 12 dB, respectively. The fundamental B-mode images and nonlinearity images are shown in .
Figure 4. (a) Nonlinear map of half-space phantom with different acoustic nonlinear parameters () used in L(t) simulations. (b) and (c) The fundamental images of half-space phantom where the initial acoustic pressures are 100 kpa and 200 kpa, respectively. (d), (e) and (f) Nonlinear images of half-space phantom based on the nonlinear imaging function L(t) where the ratios A1/A2 are 6 dB, 9.6 dB and 12 dB, respectively.
2.4. Experiment
In this section, an agar phantom with fresh pig tissue inside is applied to investigate the performance of our method. The fresh pig tissue used in this experiment consists of two parts which are the porcine muscle and fat tissue. In , the right part is a 5 cm thick piece of fat tissue. The left part is a 3 cm thick piece of muscle tissue. This porcine tissue is sealed in a gelatin where the agar content is 1.5%. The whole phantom is immersed in a warm water tank where the water temperature is controlled at 38 °C. At this temperature, the nonlinear parameter for the porcine muscle and fat tissue are 4.7 and 6.5, respectively [Citation16]. The experimental environment is shown in .
Figure 5. Conventional B-mode image (a) and nonlinearity image (b) of pig tissue.
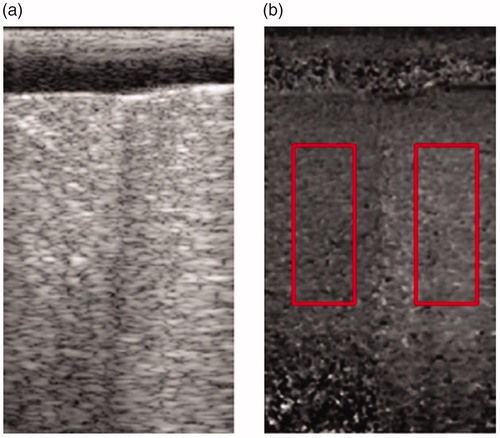
Figure 6. The experimental environment picture.
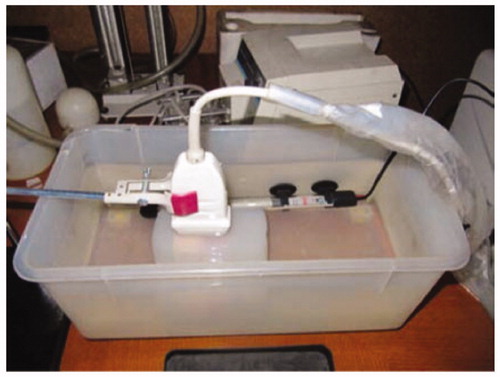
An ultrasound instrument iMago C21 developed by Saset Healthcare is used to obtain the experimental data. The center frequency of the linear transducer array is 3.5 MHz and its sampling frequency is 40 MHz. The scanning depth and width are 80 mm and 38 mm. The excitation voltages in two-pulse transmission are 40 V and 80 V, respectively. For the obtained echo signals, the conventional B-mode method and the two-pulse transmission method are used to generate the tissue ultrasound images. The imaging results are illustrated in .
3. Results
3.1. Simulation results
3.1.1. L(t) versus different nonlinear parameter values
In , solid lines represent the calculated results of Equationequation (12)(12)
(12) and discrete results represent the results of L(t) calculated from the simulated ultrasound images.
Figure 7. Evaluation of the nonlinear imaging function L(t) with nonlinear parameter
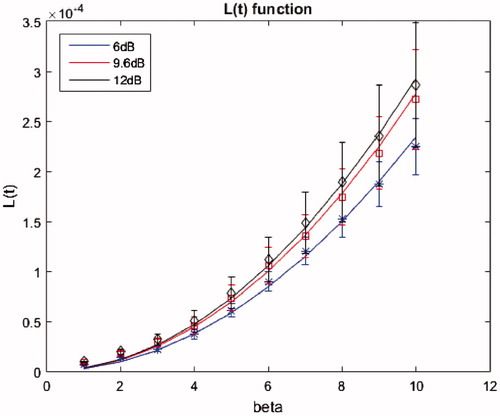
When the nonlinear parameter is above 4, the growth of imaging function L(t) shown in seems to be approximately linear as well as in the 6 dB peak voltage ratio case, though its slope is lower than 9.6 dB and 12 dB. It proves the possibility of nonlinear imaging to distinguish the nonlinear feature of different medium on clinical ultrasound device.
3.1.2. L(t) versus different excitation power values (A1/A2)
It can be seen from , the imaging function L(t) monotonically increases at the peak voltage ratio. The variation amplitude for the curve is greater than the
and
In addition, the difference among the curves of
7 and 10 shows a rising tendency under the same dB condition. Which means that if using L(t) to imaging in homogenous medium, the image contrast will increase with the growth of the ratio.
Figure 8. Evaluation of the nonlinear imaging function L(t) with peak voltage ratio (dB). Solid lines show the theoretical results, discrete results represent the simulation results calculated from simulated images.
3.1.3. Half-space phantom simulation
In , there is no visible difference which can be seen from the two mediums, because their linear parameters like acoustic impedance, attenuation and sound speed etc. are set to be the same. During the wave propagation in the medium of higher acoustic nonlinear parameter, the fundamental component decreases faster while the harmonic component increases more rapidly. According to Equationequation (12)(12)
(12) , this leads to the bigger result of nonlinear imaging function L(t). In , the left part is darker than the right part which is consistent with the nonlinear parameter map shown in .
By comparing , it can be observed that the contrast of image is improved by the growth of A1/A2 ratio. Further, two rectangular regions in are selected to calculate the image contrasts, respectively. From , we find that the ratio of right part and left part with higher A1/A2 are a little bigger than with lower A1/A2. Which means that the nonlinear image function with low A1/A2 ratios can also be used to tissue characterization.
Table 2. Comparison of nonlinear function L(t) with different A1/A2 ratios.
3.1. Experiment results
shows the conventional B-mode image of the phantom ROI. At the top of the image, the boundary between agar gel and pork tissue are obvious. However, it is difficult to distinguish the two parts of porcine muscle and fat tissue. shows the ultrasound nonlinear image based on the two-pulse transmission. It can be seen that the fat tissue at the right part is brighter than the muscle tissue at the left part which means the nonlinearity at the right part is more obvious due to the higher B/A parameter.
To quantify the difference between two methods, we choose two rectangular regions shown in to calculate the average values in different region and the ratio of right part to left part. In conventional B-mode image, the average value for the right part is 160 and the left is 154. The ratio of right part to left part is 1.039, which shows that in conventional B-mode image, there is no significant difference between porcine muscle and fat tissue. While in nonlinear image generated by our method, the average value for the right part and left part are 47.034 and 37.057. The ratio of right part to left part is 1.269, so that we can observe the difference between the porcine muscle and fat tissue clearly in . The experimental result shows that the two-pulse transmission method can differentiate the porcine muscle and fat tissue which are indistinguishable in conventional B-mode image.
4. Discussion and conclusion
From the simulation and experiment results, it has been proved that this method can generate images of high contrast and can be applied without any extra equipment like metal plate. However, false shadows may appear in output image. The method developed in “Nonlinear imaging method” assume that the object is motionless. The object’s movement between two pulse-transmission can cause misalignment of two echo signals. In addition, false nonlinear shadows can also be resulted from nonlinearity in the front-end electronics of the system, especially at high transmission power. It has to be concerned in clinical use.
Performance and utility of the nonlinear imaging method can be limited by several factors, including attenuation, diffraction and resolution. Tissue attenuation can decrease the intensity of the incident wave, which will reduce the nonlinearity effects in tissue. A focused beam only increases the nonlinearity effects in a limited range around the focus. Therefore, to increase nonlinearity effects, the depth of focus has to be traded off. The resolution of nonlinear imaging method is related to shadows. Localizing nonlinear shadowing can improve the axial resolution of nonlinear imaging method.
Nonlinear imaging techniques are of great interest with tissue characterization. In this paper, we proposed a nonlinear imaging method that allow us to distinguish the nonlinear feature of different medium and implemented a preliminary research. This method is based on the nonlinear propagation theory and pulse-echo mode commonly used in commercial ultrasound device. It is designed for use in real-time clinical instruments.
Disclosure statement
No potential conflict of interest was reported by the authors.
Additional information
Funding
References
- Pieur F, Johansen TF, Holm S, et al. Fast simulation of second harmonic ultrasound field using a quasi-linear method. J Acoust Soc Am. 2012;131:4365–4375.
- Varray F, Basset O, Tortoli P, et al. Extensions of nonlinear B/A parameter imaging methods for echo mode. IEEE Trans Ultrason Ferroelectr Freq Control. 2011;58:1232–1244.
- Toulemonde M, Varray F, Basset O, et al. High frame rate compounding for nonlinear B/A parameter ultrasound imaging in echo mode–simulation results. Paper presented at: ICASSP; 2014 May 4–9; Florence, Italy.
- Sloun RV, Demi L, Shan C, et al. Ultrasound coefficient of nonlinearity imaging. IEEE Trans Ultrason Ferroelect Freq Control. 2015;62:1331–1341.
- Choi H, Woo PC, Yeom J-Y, et al. Power MOSFET linearizer of a high-voltage power amplifier for high-frequency pulse-echo instrumentation. Sensors. 2017;17:764.
- Zhang D, Gong X. Experimental investigation of the acoustic nonlinearity parameter tomography for excised pathological biological tissues. Ultrasound Med Biol. 1999;25:593–599.
- Harris G, Liu RY. Finite amplitude method for measurement of nonlinearity parameter B/A using plane-wave tone bursts. Paper presented at: IEEE Ultrasonics Symposium Proceedings; 2007 Oct 28–31; New York, USA.
- Gong X, Zhang D, Liu J, et al. Study of acoustic nonlinearity parameter imaging methods in reflection mode for biological tissues. J Acoust Soc Am. 2004;116:1819–1825.
- Nikoonahad M, Liu DC. Pulse-echo single frequency acoustic nonlinearity parameter (B/A) measurement. IEEE Trans Ultrason Ferroelect Freq Control. 1990;37:127–134.
- Fatemi M, Greenleaf JF. Real-time assessment of the parameter of nonlinearity in tissue using “nonlinear shadowing”. Ultrasound Med Biol. 1996;22:1215–1228.
- Kuznetsov VP. Equation of nonlinear acoustics. Sov Phys Acoust. 1971;16:467–470.
- Zabolotskaya E, Khokhlov R. Quasi-plane waves in the nonlinear acoustics of confined beams. Sov Phys Acoust. 1969;15:35–40.
- Westervelt PJ. Parametric acoustic array. J Acoust Soc Am. 1963;35:535–537.
- Tjotta N, Tjotta S. Nonlinear equations of acoustics, with application to parametric acoustic arrays. J Acoust Soc Am. 1981;69:1644–1652.
- Varrary F, Toulemonde M, Basset O, et al. Fast simulation of nonlinear radio frequency ultrasound images in inhomogeneous nonlinear media: CREANUIS. Paper presented at: Proceedings of Acoustics 2012 Nantes Conference; 2012 April 23–27; Nantes, France.
- Wells PNT. Ultrasonic imaging of the human body. Rep Prog Phys. 1999;62:671–722.