
 ?Mathematical formulae have been encoded as MathML and are displayed in this HTML version using MathJax in order to improve their display. Uncheck the box to turn MathJax off. This feature requires Javascript. Click on a formula to zoom.
Abstract
As a recent research hot issue, obtaining the accurate 3 D organ models of Visible Human Project (VHP) has many significances. Therefore, how to extract the organ regions of interest (ROI) in the large-scale color slice image data set has become an urgent issue to be solved. In this paper, we propose a method framework based on OneCut algorithm and adjacent image geometric features to continuously extract the main organ regions is proposed. This framework mainly contains two parts: firstly, the OneCut algorithm is used to segment the ROI of target organ in the current image; secondly, the foreground image (obtained ROI) is corroded into several seed points and the background image (other region except for ROI) is refined into a skeleton. Then the obtained seed points and skeleton can be transmitted and mapped onto the next image as the input of OneCut algorithm. Thereby, the serialized slice images can be processed continuously without manual delineating. The experimental results show that the extracted VHP organs are satisfactory. This method framework may provide well technic foundation for other related application.
1. Introduction
Visible Human Project (VHP) was established by National Institutes of Health (NIH) in USA. In the twenty-first century, research on Visible Human Project has many significances. For example, we can utilize the models of VHP organs to simulate the surgery process; we can test a new drug for an organ based on the suitable physical properties. Based on this, the Virtual Human Project and Human Physiome Project can be realized. Although USA, Korea and China have completed the collection of the very large-scale VHP image data set and thousands of human body slices have been obtained, how to extract the regions of interest (human organs) in the slice images has still been an important challenge [Citation1–3]. The accuracy and efficiency are two worth exploring issues.
In recent years, only a few papers have touched upon the related research work. They are mainly training based methods or hard-work based methods, which are mainly applicable to single color images. When it comes to the segmentation of serialized slice image, with the large data sets, the segmentation of the visible human cannot be done efficiently.
A number of methods have been proposed at present, which are appropriate to the segmentation of colour images. Each method has its advantages. The Color Structure Code (CSC) [Citation4] segmentation algorithm is tolerant to threshold sensitivity. The image segmentation algorithm which is based on fuzzy connectedness [Citation5] makes it easier to capture the regions of interest. It used to be inaccurate because of the fuzzy edge, and this method is insensitive to the noise. In addition, the k-means method [Citation6] and fuzzy c-means method [Citation7] both have high accuracy and practicability. The achievement of color image segmentation based on region growth [Citation8] is relatively easy. And meanwhile its results are also acceptable. For the graph cut method [Citation9] without auto mode, while facing the immense data set of serialized slice images, the segmentation would be intricate. And, so does the interactive image segmentation methods which also capture the target area manually. The Support Vector Machine (SVM) [Citation10] based segmentation algorithm can realize the auto mode in some sense. Interactive image segmentation methods [Citation11] can achieve manually extraction the regions of interest. We can see each method has its character and superiority. However, there is an obvious defect that all these methods can only process a single image. For the multiple images, we must manually process them by these methods piece by piece.
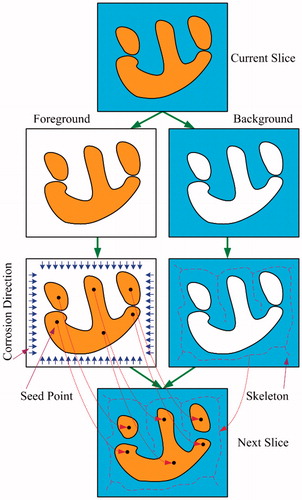
In this paper, a method framework based on OneCut and adjacent image geometric features is proposed to segment the visible human body slice images. OneCut method is easier to implement and that it is more effective at separating colors than compared to other concave (submodular) separators. In this framework, the OneCut algorithm is utilized for extracting the organ region of interest in the current slice, while the multiple seed point for foreground and the skeleton for the background are extracted for transmitting the geometrical information for the next slice image, as shown in . From the experimental result, it can be seen that the accuracy and efficiency of this method framework is satisfactory.
Figure 1. Key flow chart of our framework.
2. Methods
2.1. OneCut method
For the current slice image, a segmentation strategy called OneCut is utilized to extract the regions of interest. In OneCut strategy, an image can be mapped into a graph which is undirected. The graph can be expressed as Φ is the vertex set and Ψ is the edge set [Citation12–14]. Each pixel in the image can be seen as a vertex. Divide vertices and edges into two types. The first kind of edge is formed by connecting every two adjacent vertices in the image. In addition to ordinary vertices, there are two terminal vertices: source vertex α and sink vertex β. α is the set of foreground seed points and β is the set of background seed points. Each ordinary vertex and these two terminal vertices are connected separately to form the second kind of edge.
The energy of an image can be expressed as:
(1)
(1)
(2)
(2)
is the label of the pixel n. If the pixel is within the foreground,
is 1. If the pixel is within the background,
is 0. H(M) is the regional item. K(M) is the boundary item. σ is the weight coefficient of the regional term relative versus the boundary term, which determines the degree that they affect the energy of the image. The energy function G(M) represents the sum of all the edge weights, and the goal of image segmentation is to optimize the energy function to minimize its value.
Regional item in the energy function G(M) is:
(3)
(3)
where
is the probability that pixel x belongs to label
We want to assign the label
which has the highest probability to the pixel x. We can take the negative logarithm of probability to obtain the lowest energy. Therefore, the weight of the second type of edges can be described as:
(4)
(4)
(5)
(5)
where
is foreground;
is background;
is the intensity of pixel x;
is the possibility that pixel pertains to the foreground;
is the possibility that pixel pertains to the background.
Boundary item in the energy function G(M) is:
(6)
(6)
(7)
(7)
(8)
(8)
where
and
are a pair of adjacent pixels and
is the penalty of discontinuity between
and
is the camera noise. So, the function K(M) can represent the noise distribution between adjacent pixels. If
and
are more similar in intensity, the value of
is bigger. And if there is a large difference in intensity between
and
is close to 0. That is, if the intensity of the two adjacent pixels is similar, they are likely to be in the same foreground or the same background. If they are very different in intensity, the two pixels are likely to be in the edge of the foreground and background [Citation14,Citation15,Citation16]. That means they are likely to be separated. From Formula (8), we can see that when the difference between the two adjacent pixels is greater,
is smaller. In other words, the energy of the image is smaller.
As a result, the weight of the edge connected by every two adjacent vertices is determined by K(M). The weight of each edge connected by the ordinary vertex and source vertex is determined by
The weight of each edge connected by the ordinary vertex and sink vertex
is determined by
Lastly, remove some edges from the graph so that the source vertex
is not connected to the sink vertex
If the total weights of the deleted edges are the smallest, the minimum cut is obtained. The minimum cut corresponds to the minimum energy of the image. The minimum cut divides vertices into two disjoint subsets A and B, where
These two subsets correspond to the foreground and background pixel sets.
In the specific process procedure, we can use the mouse as a paintbrush, then we can draw the foreground auxiliary line and the background auxiliary line in the first image. The auxiliary line is a set of pixels; the foreground auxiliary line and the background auxiliary line are respectively used as the foreground seed points and the background seed points.
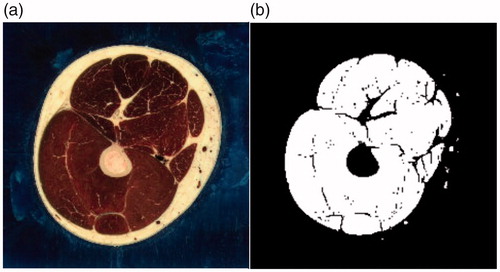
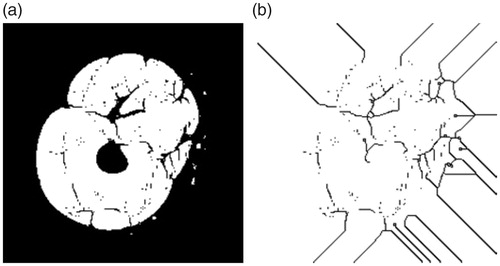
By OneCut strategy, a single slice image is segmented as shown in .
Figure 2. Single slice segmentation of vatus. (a) Before segmentation; (b) After segmentation.
2.2. Automatic seed points extraction for foreground
2.2.1. Scanning model
After capturing the area of interest for the current slice image, key geometric information should be calculated for the next image. Firstly, seed points for the foreground will be automatically extracted. In the slice images, if the color value of the pixel is equal to 0 (remember as 1), then we consider it as the target region of interest. Otherwise, if the color value of the pixel is equal to 255 (remember as 0), then we consider it as the background region.
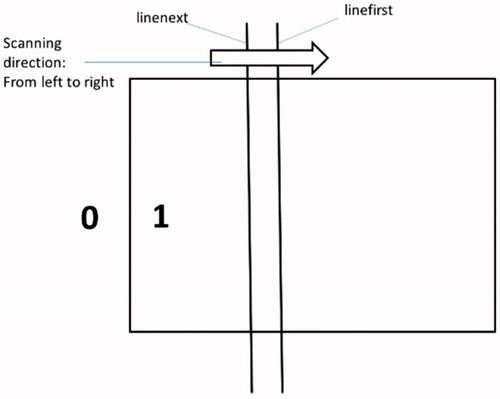
Two scan lines (linefirst and linenext) are utilized to extract the correct seeds in the scanning procedure. In the scanning direction, if the first pixel is “0” and the next is “1”, we call it the “pixel point boundary”. And the “scan boundary” is the column or row from which the scanning procedure starts. After each turn of scanning, the “scanning boundary” of four directions (top, bottom, left, and right) move one pixel. The process of scanning is presented in .
Figure 3. The process of scanning from left to right.
2.2.2. Scanning procedure
Each scanning procedure has four sub-processes (1. left → right; 2. top → bottom; 3. right → left; 4. bottom → top) and is implemented by looping the horizontal and vertical scan functions. For example, while scanning from left to right, the vertical scanning function would be called to compare the adjacent two pixel points pointed by the current scanning line. The cycle compares the pixels of each line of the scanning line in pairs. At the end of the cycle, the scanning line moves from left to right.
2.2.2.1. Vertical scanning function and horizontal scanning function
In the vertical scanning function, we compare the two adjacent pixels of the current row with the two adjacent columns of the scanning line horizontally. If linefirst = = 0, linenext = = 1 and the pixel point of the current row of the column which the linefirst is pointing at is not the seed point, the pixel of the current row of the column which the linefirst is pointing at will be set to zero. In other cases, there would not be any changes. Then compare the next row as above.
In the horizontal scanning function, we compare the two adjacent pixels of the current column with the two adjacent rows of the scanning line vertically. If linefirst = = 0, linenext = = 1 and the pixel point of the current column of the row which the linefirst is pointing at is not the seed point, the pixel of the current column of the row which the linefirst is pointing at will be set to zero. In other cases, there would not be any changes. Then compare the next column as above.
2.2.2.2. The round of scanning procedure
The four processes of a scan round are same. In this paper, we take process a as an example.
Linenext starts from the left edge of the pixel matrix. Linefirst points to the adjacent column which linenext points to. Then the loop procedure calls the vertical scanning function. After comparing each pixel pairs in the row, we move the scanning lines and continue (Each scanning line moves two columns to the right). When line linefirst has moved to the last column of the pixel matrix, process an end.
After process a, the left edge moves one column to the right. In order to avoid double calculation, the two scanning lines will not repeat the previous scan path.
2.2.2.3. Termination conditions
A flag is set to be 1 before each scanning round. Only if its value is 0, the next round begins. In the four sub-processes of the current scanning round, when there is a new seed point found (the pixel’s color value is changed), the flag’s value is set to be 0. This means that there are still new seed points to be found. Otherwise, when there are no new seed points to be found, the scanning procedure ends.
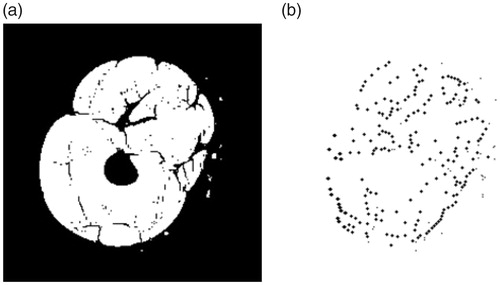
Finally, if the current pixel value is 1 and all the four pixel around is 0, the current pixel is a seed point (as shown in ).
Figure 4. Foreground seed points extraction for vatus. (a) Before extraction; (b) After extraction.
2.3. Automatic skeleton extraction for background
After extracting the seed points for the foreground, secondly, skeleton graphics will be automatically extracted.
We create a gray image model on the target image and traverse each white pixel in the image [Citation17–19]. Color of the pixel will be changed from white to black if the following four requirements are met simultaneously:
(9)
(9)
(10)
(10)
(11)
(11)
(12)
(12)
where
is the central pixel;
is the number of white pixels in the eight neighborhood;
is the times that the color changes from black to white in order of
…,
Then we re-traverse the target image. If the pixel meets the following four conditions, change its color from white to black:
(13)
(13)
(14)
(14)
(15)
(15)
(16)
(16)
These steps are repeatedly executed until no pixel can be changed in the target image. The extracted pixels are the background skeleton of this image (as shown in ).
Figure 5. Backgroud skeleton extraction for vatus. (a) Before extraction; (b) After extraction.
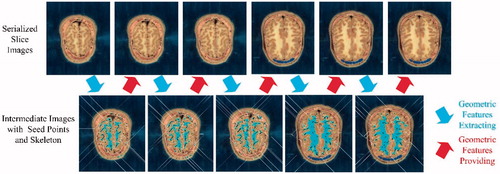
The intermediate result of the extracted seed points and extracted skeleton for serialized cephalic slices are shown in .
Figure 6. Intermediate result experiment for serialized slices.
3. Experiment and result
In our paper, the serialization of the human body slice images are referred to the U.S National Library of Medicine (NLM) and Southern Medical University of China. And in the experiment while testing our method, those slice images were used for examination. As the typical body parts, 200 vastus slices, 62 frontal lobe slices, 207 chest or abdomen slices and 198 arm slices were processed by our method. The segmentation experiments ran on a common personal computer with Microsoft windows 8 platform and the hardware condition (2.50 GHz CPU, 4.00 GB memory).
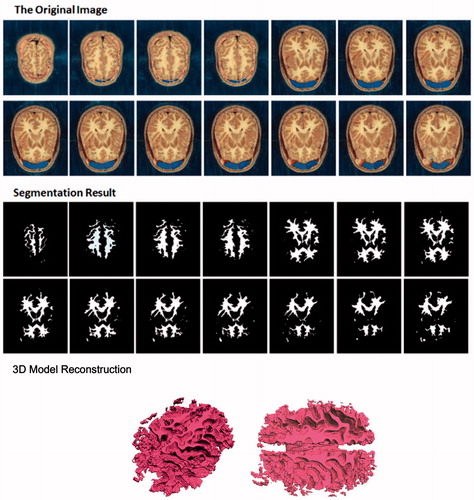
Frontal lobe segmentation for the cephalic images of “U. S. male Virtual Human” is the most difficult task in the whole experiment. In the original slice images, we can see that the frontal lobe is white which is approaching to the colors of the cerebral cortex and gray matter. Moreover, its shape is curved and its structure is complex. And the closer it is to the edge, the smaller and more curved it is. Based on this complex image condition, our method can still generate a favorable segmentation result, as shown in .
Figure 7. Front lobe image segmentation and 3D construction of American male virtual human.
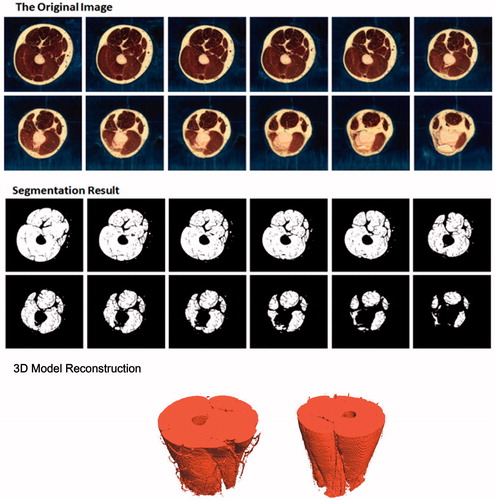
For a large tissue, vastus muscle of “U. S. male Virtual Human” can also be extracted by our method. As shown in , we can see that the edges of the segmented vastus images are clear and smooth with satisfactory detailed contours. In addition, the segmentation error rate is also maintained at a lower level while maintaining the higher image quality.
Figure 8. Vastus image segmentation and 3D construction of American male virtual human.
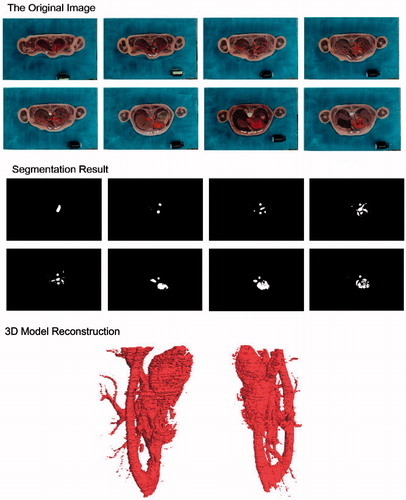
In the application of body modeling and virtual surgery, models of body trunk and visceral organ are very useful. Therefore, in order to further verify the rationality and feasibility of our framework based on OneCut method, seed points extraction and skeleton extraction, serialized arm slice images of “Chinese male Virtual Human” and abdomen slice images of “Chinese female Virtual Human” were tested. The result of the segmentation is also acceptable and fairly satisfactory (as shown in and ).
Figure 9. Arm image segmentation and 3D construction of male virtual human in China.
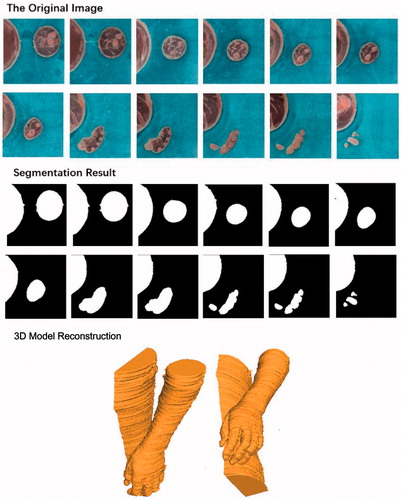
Figure 10. Aortic circulatory system image segmentation and 3D construction of female virtual human in China.
4. Potential application
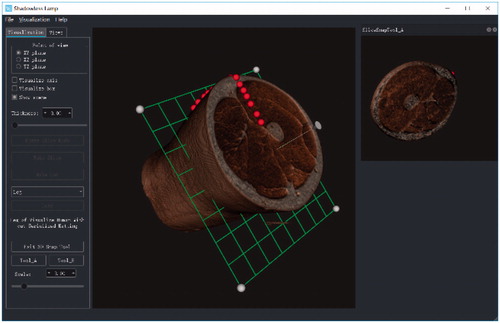
As shown in the above figures, we have obtained the ROI images of several main organs for Virtual Human (Visible Human) by using our proposed method framework. The reconstructed 3D models are accurate (even the blood vessels and the tiny tissue can be extracted) and satisfactory. Another important task is how to utilize these organ models to assist the clinical surgery. In recent months, we have begun developing a computer-assist virtual surgery system. Our goal is to implement the virtual cutting and seaming on these 3D models. The preliminary system interface is shown in .
Figure 11. Preliminary system interface of a computer-assist virtual surgery system.
5. Discussion
From the experimental result, we can see that we can extract the main organs of VHP image data by our framework. Comparing with other classic algorithms’ image segmentation single image by single image, our method can achieve automatic serialized segmentation for the VHP slices. The Color Structure Code (CSC) is susceptible to the noise. The segmentation speed of the fuzzy connectedness method is seriously affected by its requirements for too much iterative algorithm. There is no doubt that the k-means method and fuzzy c-means method may cause much time cost, since the immense data set of visible human may surely leads to high computational complexity. For the region-growing method, the seed points cannot be selected automatically. It is surely an unrealistic method to pick out seed points of hundreds of images manually. The Support Vector Machine (SVM) based method takes too much time to get accurate spatial information during the training. And in addition, the segmentation speed is not ideal. Therefore, it is not possible to realize the real-time segmentation and the efficient segmentation. Our framework can obtain relatively better automatic extraction result.
6. Conclusion
In the former research work of extracting the VHP organs, we have to manually sketch the contours of the target regions in each slice. However, this is a very dryasdust and time-consuming work, because the VHP data set has massive images. Based on this condition, this paper presents a new method framework that is utilized to extract the main organ regions of interest in the VHP color slice image data set. This method framework takes full advantage of the gradual changing character between adjacent slices. We cannot only obtain the main organs of VHP, but also extend this framework into other applications.
Thanks to Ms. Xiuyan Peng and Mr. Yuxiang Liu for providing the experimental material. Over the past few years, they assisted us to complete the investigative work in many cities of China. They also put forward many reasonable and excellent opinions for our research work. Thanks very much for their contribution.
Disclosure statement
No potential conflict of interest was reported by the authors.
Additional information
Funding
Reference
- Zhong SZ, Li H, Lin ZK. Digitized virtual human: background and meaning. China Basic Sci. 2002;6:12–16.
- Zhong SZ. Scientific significance and prospective application of digitized virtual human. Acad J First Med Coll PLA. 2003;23:193–195.
- Shan J, Wang G, Wang D. Research of medical image fusion based on data set of digital visible human. Chin J Med Imaging Technol. 2009;25(1):141–144.
- Li H, Gu H, Han Y, et al. Object-oriented classification of high-resolution remote sensing imagery based on an improved colour structure code and a support vector machine. Int J Remote Sens. 2010;31:1453–1470.
- Jayaram K, Udupa Punam K. Saha Fuzzy connectedness and image segmentation. Proc IEEE. 2003;91:1649–1669.
- Dhanachandra N, Manglem K, Chanu YJ. Image segmentation using K-means clustering algorithm and subtractive clustering algorithm. Procedia Comput Sci. 2015;54:764–771.
- Zheng Y, Jeon B, Xu D, et al. Image segmentation by generalized hierarchical fuzzy C-means algorithm. J Int Fuzzy Syst. 2015;28:961–973.
- Hore S, Chakraborty S, Chatterjee S, et al. An integrated interactive technique for image segmentation using stack based seeded region growing and thresholding. IJECE. 2016;6:2773–2780.
- Wang T, Ji Z, Sun Q, et al. Image segmentation based on weighting boundary information via graph cut. J Vis Commun Image Represent. 2015;33:10–19.
- Zhang YD, Chen S, Wang SH, et al. Magnetic resonance brain image classification based on weighted‐type fractional Fourier transform and nonparallel support vector machine. Int J Imaging Syst Technol. 2015;25:317–327.
- Jian M, Jung C. Interactive image segmentation using adaptive constraint propagation. IEEE Trans Image Process. 2016;25:1301–1311.
- Tang M, Gorelick L, Veksler O, et al. GrabCut in one cut. Proceedings of the 2013 IEEE International Conference on Computer Vision. Sydney (Australia): IEEE Computer Society; 2013. p. 1769–1776.
- Boykov YY, Jolly MP. Interactive graph cuts for optimal boundary & region segmentation of objects in N-D images. IEEE International Conference on Computer Vision. Los Alamitos (CA): IEEE Computer Society; 2001. p. 105.
- Rother C, Kolmogorov V, Blake A. Interactive foreground extraction using iterated graph cuts. ACM Trans Graph. 2004;23:309–314.
- Levin A, Lischinski D, Weiss Y. A closed-form solution to natural image matting. IEEE Trans Pattern Anal Mach Intell. 2008;30:228–242.
- Wang J, Cohen MF. An iterative optimization approach for unified image segmentation and matting. Tenth IEEE International Conference on Computer Vision. Washington, DC: IEEE Computer Society. 2005. p. 936–943.
- Wang J-S, Gan Q, Wei Y, et al. Cellular neural networks with opposite‐sign templates for image thinning. Int J Circ Theor Appl. 1999;27:229–240.
- Saeed K, Rybnik M, Tabędzki M. A criterion for image thinning: implementation and applications. Image Process Commun. 2001;7:77–83.
- Au OKC, Tai CL, Chu HK. Skeleton extraction by mesh contraction. ACM Trans Graph. 2008;27:44.