
 ?Mathematical formulae have been encoded as MathML and are displayed in this HTML version using MathJax in order to improve their display. Uncheck the box to turn MathJax off. This feature requires Javascript. Click on a formula to zoom.
Abstract
Lung cancer has become one of the life-threatening killers. Lung disease need to be assisted by CT images taken doctor's diagnosis, and the segmented CT image of the lung parenchyma is the first step to help doctor diagnosis. For the problem of accurately segmenting the lung parenchyma, this paper proposes a segmentation method based on the combination of VGG-16 and dilated convolution. First of all, we use the first three parts of VGG-16 network structure to convolution and pooling the input image. Secondly, using multiple sets of dilated convolutions make the network has a large enough receptive field. Finally, the multi-scale convolution features are fused, and each pixel is predicted using MLP to segment the parenchymal region. Experimental results were produced over state of the art on 137 images which key metrics Dice similarity coefficient (DSC) is 0.9867. Experimental results show that this method can effectively segment the lung parenchymal area, and compared to other conventional methods better.
1. Introduction
According to statistics, the incidence of lung cancer in China is increasing at a rate of 26.9% per year. It is estimated that by 2025, the number of people who die of lung cancer in China alone will be close to 1 million each year. Studies have shown that early detection and early treatment of lung cancer can effectively improve the survival rate of lung cancer patients: the 5-year survival rate increased from 14% to 49% [Citation1]. CT imaging is one of the effective methods to help doctors diagnose lung diseases. In order to reduce the workload of doctors and detect lung diseases more quickly and accurately, it is of great significance to apply medical image processing technology to the auxiliary diagnosis of lung diseases. In the process of computer-aided diagnosis of lung diseases, the extraction of lung parenchyma from CT images in lung images can assist clinicians in diagnosis and evaluation of lung diseases. However, since the lung CT images mainly include the air outside the lung parenchyma and lung parenchyma, the examination bed and other parts, and because the lung CT images are noisy and complex in tissue structure, the rapid and effective segmentation of the lung parenchyma has become one of the hot spots and difficult points in the research of auxiliary diagnosis of lung diseases.
In recent years, a large number of scholars have studied lung parenchymal image segmentation methods. S. Sun et al. [Citation2] used the active contour model to define the initial contour of the lung, and then used the global optimization algorithm to segment the lung parenchyma. Van Rikxoort et al. [Citation3] used morphological manipulation and quantification of the shape of the lung to segment the lung parenchyma. Sluimer et al. [Citation4] proposed constructing probability maps to extract lung parenchyma from images of severe disease. Heewon et al. [Citation5] used active contour model and bayesian approach to segment lung. However, most algorithms use traditional image algorithms to segment lung CT images, and today's hot convolution neural network technology can better segment lung parenchyma from CT images.
Convolution neural network (CNN) has been widely used in image processing and has made great progress in image segmentation. Long et al. [Citation6] proposed the full convolution network (FCN), which replaces the full connection layer in the classification network framework with the convolution layer, and outputs spatial mapping instead of classification score, achieved good results, and became the cornerstone for the application of deep learning technology in semantic segmentation. In addition to FCN, there are other variants to transform networks that were originally used for classification into suitable forms for segmentation. Ronneberger et al. [Citation7] proposed the u-net network based on FCN, which has achieved good results in medical image segmentation. Compared with FCN, the structure of the network in the upsampling stage has been greatly changed. U-Net structure is relatively clear, the sampling and downsampling forms an elegant U-shape. The SegNet network proposed by Badrinarayanan et al. [Citation8] is an encoder-decoder structure. The encoder part is the VGG-16 [Citation9] network with the fully connected layer removed. The decoder part consists of a series of upsampling and convolutional layers. Finally, a softmax classifier is connected to predict the pixel-level label as an output, which can achieve the same as the input image resolution. Yu et al. [Citation10] proposed a dilated convolution in the study, which can obtain a larger receptive field by not increasing the size of the convolution kernel and without using the downward convolution; this method has been used in image semantic segmentation research has achieved good result. Skourt et al. [Citation11] used u-net structure to segment lung parenchyma from CT images.
Combined with the above methods, this paper proposes a lung parenchymal segmentation algorithm based on the combination of VGG-16 [Citation9] and dilated convolution [Citation10], which can obtain the same size of receptive field while reducing pooling, and has better results than other methods. The structure of this article is as follows. In section 2, the network design is described in detail. Then in section 3, the segmentation results of the proposed method and the comparison with other representative methods are given. The conclusion is given in section 4.
2. Method
2.1. Dilated convolution
The image segmentation algorithm represented by FCN [Citation6] and SegNet [Citation8] is the same as the traditional CNN, and the image is convolved and then pooled. The meaning of pooling is to reduce the amount of calculation on the one hand and to increase the receptive field on the other hand. However, the image is segmented with pixel-wise output. Therefore, the above two image segmentation methods upsample the image (deconvolution) to make the size consistent with the input. A large part of the information is lost during the process of reducing to size. Compared with the ordinary convolution, the dilated convolution has a dilation rate parameter in addition to the size of the convolution kernel, which is mainly used to indicate the size of the expansion. The similarity between dilated convolution and general convolution is that the size of the convolution kernel is the same, that is, the number of parameters remains the same in the neural network, and the difference is that dilated convolution has a larger receptive field. Dilated Convolutions [Citation10] directly drops the pooling layer and uses the method of dilated convolution to achieve the effect of removing the downsampling operation without reducing the receptive field of the network. The dilated convolution is shown in .
Figure 1. Dilated convolution illustration.
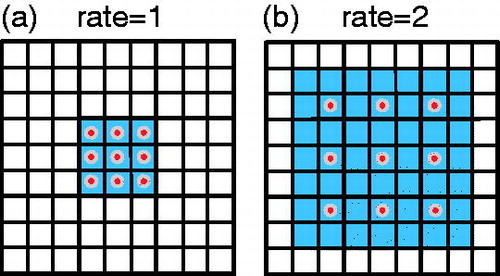
shows the field of view effect of the classic 3 × 3 convolution kernel, covering 3 × 3 field of view each time; shows a dilated convolution of rate = 2. In fact, the size of convolution kernel is still 3 × 3. The size of the sensing field can be expressed as EquationEq. (1)(1)
(1) [Citation10].
(1)
(1)
The dilated convolution increases the receptive field of the convolution kernel while keeping the number of parameters unchanged, and it can make the size of the feature map of the output unchanged. It can be seen from that the effect of simultaneous action of the 3 × 3 convolution kernels of rate = 1 and rate = 2 is the same as that of the traditional 7 × 7 convolution kernels, but the number of parameters is only 9.
2.2. Feature fusion
In convolutional neural networks, the high-level network features have rich semantic information, which makes the positioning accuracy based on convolutional neural networks more and more improved. However, due to multiple pooling of high-level features, some details are lost and features are rough in space. An intuitive solution to this problem is to use multi-scale training on images. Hariharan et al. [Citation12] proposed Hypercolumn, which is a feature of the activation series of all nodes in the network corresponding to the pixel, and performs fine-grained positioning of the target. For each location, the method of is used to extract the output on certain layers of the corresponding pixel as a feature. Because the size of the feature graph is different, the feature map is upsampled using bilinear interpolation to achieve a uniform size.
Figure 2. Feature fusion illustration.
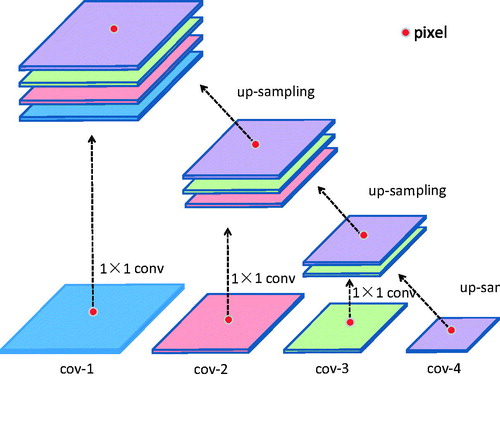
For pixel p, the multi-scale hypercolumn feature is computed as EquationEquation (2)(2)
(2) .
(2)
(2)
ci(p) denote the feature vector of convolutional responses from layer i centered at pixel p.
2.3. Modified VGG-16 network
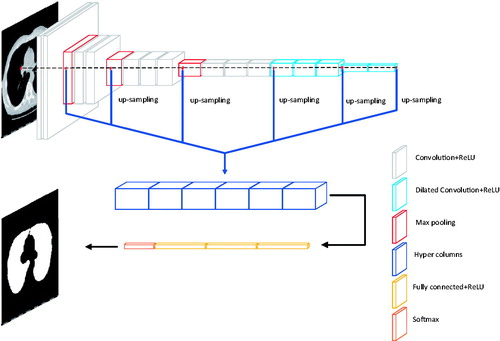
We start from the VGG-16 [Citation9] network, which originally designed for large-scale natural image classification. VGG-16 has 13 convolutional layers and 3 FC (fully connected) layers. The convolutional layers are denoted as conv-{11, 12, 21, 22, 31, 32, 33, 41, 42, 43, 51, 52, 53}. In this paper, the target dataset is comparatively small and the pre-trained VGG-16 is powerful in many segmentation tasks (The pre-trained model is obtained from the training of the ImageNet large-scale dataset). Therefore, the transfer learning is used in the training in our paper. Because we have modified the VGG-16 network, we only learn conv-{11, 12, 21, 22, 31, 32, 33, 41, 42, 43}, convolution kernel is 3 × 3, and use maxpooling. In this network, we fine-tuned the VGG-16 network. According to [Citation10], dilated convolution increases the feeling field of the convolution kernel while keeping the number of parameters constant, and also ensures that the size of the output feature map remains unchanged. We changed the convolution of conv-{51, 52, 53} to dilated convolution, convolution kernel is 3 × 3, dilated rate is 2, and the pooling layer after cov-43 and cov-53 is canceled. We converted the last two FC layers into convolution filters, renamed cov-6 and cov-7, convolution kernel is 7 × 7, dilated rate is 4, and added them to feature sets that can be aggregated into our multi-scale hypercolumn descriptors. Following, we build predictor based on multiscale features extracted from multiple layers. Because of a strong correlation between adjacent layers, actually, there is no need to consider all the layers. We use skip-connections to extract hypercolumn features from {12, 22, 33, 43, 53, 7} with on-demand interpolation. Next, we learned about a nonlinear predictor for classifying pixels, which is implemented as a multilayer perceptron (MLP) defined on a hypercolumn features. We use MLP, which can be implemented as a series of “Fully Connected” layers, followed by the ReLU activation function. The structure of our network is shown in .
Figure 3. Our network.
3. Experiment and evaluation
3.1. Materials
The experimental platform for this paper is caffe, Intel(R) Core (TM) i9-7900X CPU 3.30 GHz and NVIDIA GeForce TITAN XP GPU. We selected 20 patients. Each patient had about 100–150 serial images. After removing the images of no lung parenchyma, we eventually formed the image data set of 1937. We used the results of manual segmentation by the professional doctors as the gold standard for algorithm evaluation. The experienced doctors provide segmentation labels for all images. Of the 1,937 images in this experiment, 1800 images are used for training, and the remaining 137 images are used for algorithm test.
3.2. Experimental results
We use a learning rate of 3 × 10⁻⁴ for lung segmentation. Momentum is set to 0.9. Size of mini-batch is set to 8. Resolution of input images is resized to 224 × 224 by bilinear interpolation. At the same time, we also use our own data set to implement some other convolutional neural network methods, including U-net [Citation7], Deeplab-v3 [Citation13] and FCN [Citation6], and the results of various segmentation algorithms were compared with the comprehensive lung parenchyma area manually segmented by experienced doctor. In the course of the experiment, the manually segmented images in the medical records were the ultimate gold standard.
Four representative images are selected for experiment, and our algorithm and other algorithms are used to segment the images, as shown in . Because U-net is the best in all comparison methods, the images were classified in four groups, include: original lung CT images, ground trues, segmentation results from our network and segmentation results from U-net.
Figure 4. (a) is the original lung CT images. (b) is ground trues from the manual segmentation of a clinically experienced doctor. (c) is segmentation results from our network. (d) is segmentation results from U-net.
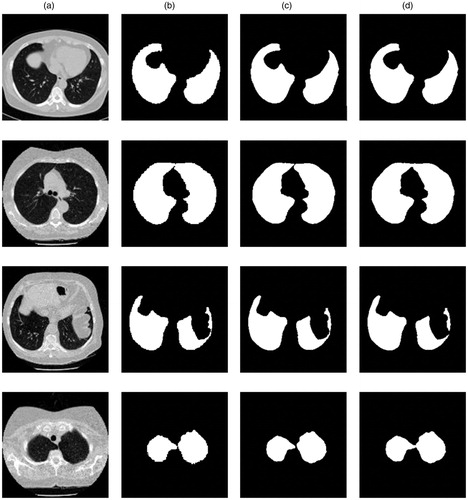
For the CT images with intact lung parenchyma, as shown in the first row of , the segmentation by all the algorithms could ensure the integrity of the segmentation. But U-net is not able to segment the adhered lungs well, as shown in the second row and the forth row of . The results showed that the regional growth algorithm still lost some parts of the lung parenchyma in the third row of . Promisingly, our method could ensure the integrity and accuracy of lung parenchyma segmentation.
3.3. Qualitative evaluation
Evaluation process aims to measure the performance of proposed scheme. This study uses the most commonly used prostate segmentation evaluation indicators to evaluate the algorithm. Including specificity (SP) [Citation14], sensitivity (SE) [Citation15], Dice similarity coefficient (DSC) [Citation16], Accuracy (ACC) and IoU.
(3)
(3)
(4)
(4)
(5)
(5)
(6)
(6)
(7)
(7)
Where TP stands for true positive, which represents the common area of manual segmentation and algorithm segmentation. FP stands for false positive, which represented in the algorithm segmentation area, but outside the manual segmentation area. TN stands for true negative, which represents the manual segmentation of external and algorithmic segmentation of the external common area and FN stands for false negative which represents an area that is contained within the manual outline but is missing by the algorithm.
As mentioned before, our scheme is inspired from VGG-16 net but is different from its standard structure; hence we compare the results of our method with an original VGG-16 network, as shown in .
Table 1. Comparison between the original network and the modified one.
By comparing the experimental results obtained from the original network and the modified one, it can be seen that our method can get better experimental results by changing the convolution layer in VGG-16 and improve the accuracy of segmentation.
At the same time, we emphatically compared our method with advanced traditional method Snake and convolution neural networks, including U-net [Citation7], Deeplab-v3 [Citation13] and FCN [Citation6]. show the comparison of segmentation performance between our approach and other existing approaches.
Table 2. Quantitative evaluation of different methods.
illustrates the detailed comparison between different methods, include traditional methods and other convolutional neural network methods. In all the parameter results, the result of our method is better than other methods.
4. Discussion
Our method is based on VGG-16 network and improved. We replaced some convolutional layers in the network with dilated convolutions, and cancel the pooling layer. When the parameters are unchanged, the receptive field of the convolution kernel is increased, and the calculation is reduced while increasing the precision.
Compared with the state-of-the-art methods, our approach solves some deficiencies. The traditional method cannot accurately segment the pulmonary nodules and vessels that are adhered to the lung margin, and cannot separate the adherent left lung and right lung. All the indexes of the segmentation results of convolutional neural network are superior to the traditional methods, which indicate that convolutional neural network can be used in the field of CT image segmentation. Compared with other end-to-end and encoder-decoder methods, our method got higher scores on indicators such as accuracy, and solved the problem that details of network segmentation results such as FCN were not good enough. This is due to two aspects: 1. Dilated Convolution reduces the number of parameters while maintaining the same receptive field, 2. the application of hypercolumn feature retains details.
5. Conclusions
In this paper, we demonstrate that the inherently difficult problems of lung CT images can be solved well with convolutional neural networks. We present a method which combine VGG-16 and dilated convolution for lung segmentation in CT images.On the one hand, by changing the convolutional layer in VGG-16 and adding the expanded convolutional structure, we obtained a larger receptive field; on the other hand, we used hypercolumn features to fuse the features to increase the robustness of the algorithm. Through this structure, we get accurate segmentation results. The experimental results show that the proposed method has better robustness and accuracy than other methods, which means remarkable performance in lung segmentation.
Disclosure statement
No potential conflict of interest was reported by the authors.
Additional information
Funding
References
- Pulagam AR, Kande GB, Ede VKR, et al. Automated lung segmentation from HRCT scans with diffuse parenchymal lung diseases. J Digit Imaging. 2016;29:507–519.
- Shenshen S, Linan F , Daojing L I . Applied research on automatic detection of lung nodules ROI based on Top-hat and Gabor filter. Computer Engineering and Applications. 2012; 48(4):190–192.
- Van Rikxoort E M, De Hoop B, Viergever M A, et al. Automatic lung segmentation from thoracic computed tomography scans using a hybrid approach with error detection. Medical Physics, 2009, 36(7):2934–2947.
- Sluimer I , Prokop M , Van Ginneken B . Toward automated segmentation of the pathological lung in CT. IEEE Transactions on Medical Imaging, 2005, 24(8):1025–1038.
- Chung H, Ko H, Jeon SJ, et al. Automatic lung segmentation with juxta-pleural nodule identification using active contour model and Bayesian approach. IEEE J Transl Eng Health Med. 2018;6:1800513.
- Long J, Shelhamer E, Darrell T. Fully Convolutional Networks for Semantic Segmentation. IEEE Transactions on Pattern Analysis & Machine Intelligence. 2014;39(4):640–651.
- Ronneberger O, Fischer P, Brox T. U-net: Convolutional networks for biomedical image segmentation. International Conference on Medical image computing and computer-assisted intervention. Cham: Springer; 2015. p. 234–241.
- Badrinarayanan V, Kendall A, Cipolla R. SegNet: a deep convolutional encoder-decoder architecture for scene segmentation. IEEE Trans Pattern Anal Mach Intell. 2017;39:2481–2495.
- Simonyan K, Zisserman A. Very deep convolutional networks for large-scale image recognition. arXiv preprint arXiv:1409.1556. 2014.
- Yu F, Koltun V. Multi-scale context aggregation by dilated convolutions. arXiv preprint arXiv:1511.07122. 2015.
- Alom M Z, Hasan M, Yakopcic C, et al. Recurrent residual convolutional neural network based on u-net (R2U-net) for medical image segmentation. arXiv preprint arXiv:1802.06955. 2018.
- Hariharan B, Arbelaez P, Girshick R, et al. Hypercolumns for object segmentation and fine-grained localization. Proceedings of the Computer Vision and Pattern Recognition; IEEE; 2015.6. p. 447–456.
- Chen L C, Papandreou G, Schroff F, et al. Rethinking atrous convolution for semantic image segmentation. arXiv preprint arXiv:1706.05587. 2017.
- Diaz K, Castaneda B. Semi-automated segmentation of the prostate gland boundary in ultrasound images using a machine learning approach. Medical Imaging 2008: Image Processing. International Society for Optics and Photonics; 2008, 6914:69144A.
- Badiei S, Salcudean S E, Varah J, et al. Prostate segmentation in 2D ultrasound images using image warping and ellipse fitting. International Conference on Medical Image Computing and Computer-Assisted Intervention; Berlin, Heidelberg: Springer; 2006. p. 17–24.
- Dice LR. Measures of the amount of ecologic association between species. Ecology. 1945;26:297–302.