
Abstract
In this study, the authors used the Fujifilm Prescale Pressure Measuring System to measure the contact pressure and distribution at the jaws of laparoscopic grasping forceps. This data was then correlated with measured pressures at the forceps handles to understand the relationship between the surgeon’s actuating pressure and that on the organ being manipulated. The purpose of this study is to create a database of tactile information to provide guidelines in defining minimally invasive surgery (MIS). This is expected to be important as today's society continues to progress in the use of automation, IoT, AI and MIS. In order to achieve the above, the authors developed an experimental device consisting of an actuator, a load cell and an MCU to stably actuate and control the handle side of grasping forceps. Target organs were simulated using triangular prisms of various silicone rubber materials. The experimental method involved actuating the handle side with preset pressure values for fixed time periods and using sensitive film to measure the pressure at the forceps tip. The film data was then scanned, processed and analyzed.
Introduction
Since the turn of the century, the advantages of minimally invasive surgery (MIS) include reduced trauma, reduced blood loss during the operation and shorter hospital stays. This progress represents significant advancement in science and technology. In contrast to traditional laparoscopic surgery, mini-laparoscopic surgery uses a micro-surgical instrument to further reduce the wound size, here the emphasis is placed on further minimization of trauma. Natural-orifice transluminal endoscopic surgery (NOTES) [Citation1] uses a natural aperture of the human body instead of a surgical wound, and Single-port laparoscopic or Single-Incision surgery focuses on centralizing all of the instruments into one port/incision, typically the umbilicus. In addition, with the clinical application of surgical robots such as da Vinci®, robot-assisted laparoscopic surgery [Citation2]. has received extensive attention in the second decade of the 21st century, and its applications are increasing year by year [Citation3].
Table 1. Characteristics of study cohort stratified by three periods between 2008 and 2012 (part of the original form) [Citation3].
Although MIS offers many advantages compared to open surgery, limited visibility and the lack of tactile information associated with MIS tend to extend the operating time. For this and other reasons, at the time of writing, open surgery still remains the preferred type of surgery for a wide range of operations. In MIS, in-vivo operations rely entirely on a variety of long rod type grasping forceps which are designed specifically to pass through narrow orifices usually trocars, which range from 3 mm to 12 mm in diameter. In laparoscopic surgery a rod lens type camera is typically inserted into the umbilicus, providing high resolution visual data in real time. Tactile information can be divided broadly into touch (little pressure), external retraction - compression (using the forceps open or shut to apply pressure) and internal retraction – pinch (within the forceps jaws). Traditional laparoscopic forceps inherently provide some force feedback, however, the feedback is significantly less than that of the simpler forceps used in open surgery. Furthermore, this relationship between the pressure exerted by the surgeon and that applied to target tissue or organ at the tip of the forceps (pinch) varies with jaws type, transmission structure (articulating mechanism), the posture or handling angle [Citation4] and the forceps jaw angle. In recent years, in light of this inconsistency between the pressure exerted by the surgeon and that incurred by the target tissue or organ, in the field of MIS, particularly robot-assisted MIS, significant research [Citation5–7] has gone into the development of various of types of tactile sensors. Related study outcomes have shown that compared to traditional MIS, it is advantageous to display tactile information in real-time, this advantage is particularly significant in the case of robotically assisted surgery.
Summary
In this study, the authors have developed a mechanism to exert a controlled force to the handles of forceps, the mechanism is based on real time force feedback. In regard to measuring the pressure and in particular the pressure distribution at the forceps tip a pressure sensitive film was used. The Fujifilm Prescale Pressure Measuring System (FPPMS) [Citation8] was used to provide high resolution imaging of pressure distribution. The purpose of this research is to create a contact pressure distribution database. By coupling the database to feedback from the handle sensor it will be possible to estimate and display tactile information. In order to help surgeons to understand the characteristics of forceps especially junior surgeons. Then, as a database for real-time tactile sensors to upscale their resolution for the development of next generation surgical devices and robots.
The developed testing device uses a linear actuator, load cell and MCU. This device exerts a stable and controllable actuation force (grip) to the laparoscopic forceps. In order to haptically model human tissue and organs triangular prisms were made using silicone like materials of varying hardness. The test material hardness was 0 Hs, 18 Hs, and 32 Hs, the actuating force to the forceps grip was 100 gf to 1200 gf in 100 gf steps. The respective forces were maintained for two minutes.
Experimental environment & method
Development of experimental device
This device was designed to simulate the way a surgeon typically uses laparoscopic grasping forceps’ during laparoscopic operations. The type of forceps shown in are typically held between the thumb and index finger, in this simulation the index finger side is fixed and the thumb side is directly driven by an actuator via a load cell as shown. Return pressure is provided for by a rubber coupling. The actuator has a 50 mm stroke and a maximum output of 750 N, the maximum speed is 10 mm/s and duty cycle is 20%. An S-type load cell providing a range of 0 to 100 kg with 0.03% accuracy is used to monitor the applied pressure. A Raspberry pi 3 B plus Micro Control Unit (MCU) was used for control and a 9-inch touch screen for the user interface shown in . PID control was used to provide precise and stable application of the pressure requested. A GUI was developed to ensure simple and efficient use of this experimental device. A detailed list of the hardware is shown in .
Figure 1. Device operation method.
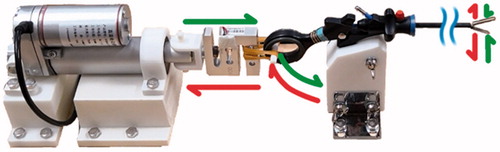
Figure 2. Block diagram of device operation method.
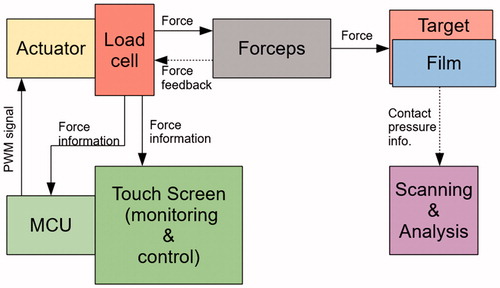
Table 2. Hardware.
Models
To emulate the physical characteristics of body tissue and organs, two kind of materials were selected and used. The first material is Hitohada Gel - EXSEAL (Co., Ltd). This material is rated at 0Hs (hardness strength) based on the ASKER C standard. Based on the author’s experience this 0Hs Gel has tactile characteristics similar to organs such as lung tissue. 18Hs and 32Hs (also ASKER C) silicone rubber was also used. Detailed characteristics of the materials used is shown in and the test models are shown in . The size of the testing models is as follows: height 30 mm, angle at the apex 10 degrees, and the length (distance between the triangular surfaces) of these triangular prisms is 38 mm.
Figure 3. Tissue/organ test models of varying hardness.
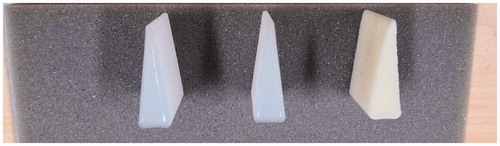
Table 3. Characteristic of the materials for building models.
Laparoscopic forceps & pressure sensitive film
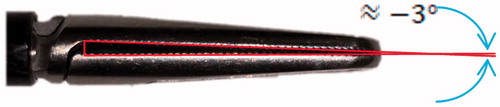
In this study, the laparoscopic grasping forceps used were the HiQ + series hand instrument family’s Ergo S handle and Johann forceps with a 24 mm jaw and a 330 mm shaft (Olympus Inc.). Also, the maximum default open angle with jaw structure of the selected forceps is 50° as per and the initial jaw angle is about −3° when it closed as per . This double action jaw model was chosen as it was highly rated be our local surgeons it was noted to provide very good visibility.
Figure 4. Default open angle of Johann type forceps.
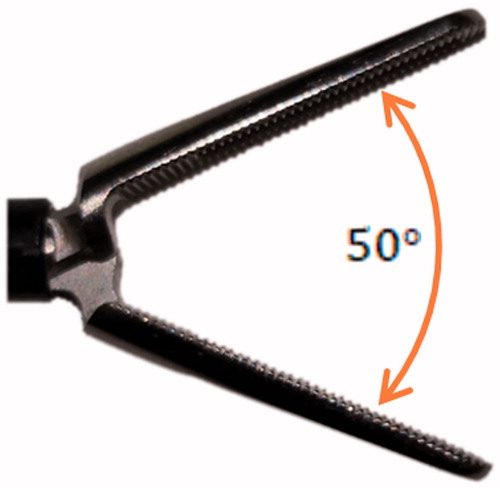
Figure 5. Johann type jaw closed with ∼1mm gap at the base.
The pressure and its distribution at the forceps tip was measured using pressure sensitive film. The FPPMS was used to provide high resolution of pressure distribution data. Fujifilm Prescale 4LW PS type ultra-super low film with a measuring range from 0.05 MPa to 0.20 MPa and LLLW PS type ultra-super low film with a measuring range from 0.20 MPa to 0.60 MPa were selected. This arrangement provided a resolution of 0.125 mm per pixel. While a high resolution is possible this approach can only measure static pressure. Clearly there is a need to measure dynamic information as is outlined in [Citation8,Citation9]. Furthermore, the relationship between contact area and pressure is important to minimize slip damage [Citation10].
Experiment method
The pressure sensitive film is placed on the tip side of the test model between the upper forceps jaw and the model. The output pressure on the grips is set to 100gf to 500gf in 100gf steps with 4LW type film and 500gf to 1200gf in 100gf steps with LLLW type film, each pressure is maintained for 2 minutes. For scanning and analyzing film data, the FPD-8010J software which was included with the FPPMS was used.
Four types of tests were carried out:
Dry run mode test (no target material) .
Thin side test (grasping the thin end of the prism) .
Bevel side test (grasping the prism halfway along a triangular end) .
Thick side test (grasping the thick end of the prism) .
Figure 6. Measuring contact pressure distribution. (a) Dry run mode side view. (b) Thin side view. (c) Bevel side view. (d) Thick side view.
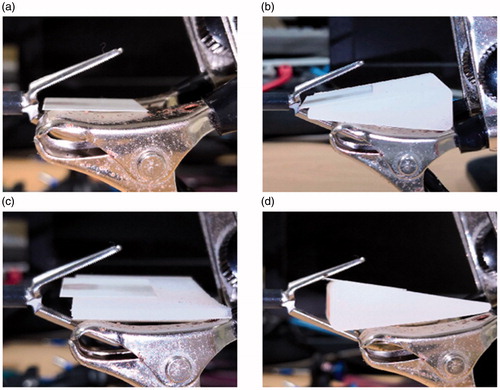
As shown in the dry run mode test is aimed at checking jaw contact pressure distribution without grasping anything, this would simulate the grasping of very thin tissues such as membranes. The 2nd test observes the jaw contact pressure distribution on objects that match the jaw shape, such as that which occurs when handling the perimeter of the liver, when a prismatic object is grasped from the thinnest edge. The final tests, the bevel side test and thick side test address to show the contact pressure distribution when the forceps are used to grasp objects that are inherently least suited to the jaw mechanism, that is grasping the prism from the bevel or thick edge. These two tests could represent for example the grasping of previously cut sections of the liver, where a segment has been removed, therefore requiring the grasping of a prismatic shape from the side.
Data analysis and statistics
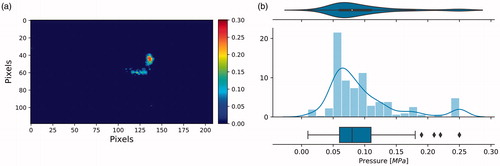
After completing 4 kind tests, the films were scanned and the raw data from the scanned BMP file was entered into the FPPMS. Then, during color analysis, text files consisting of 560 × 560 array data sets with resolution of 0.125 mm per pixel were created. Next, these test files were imported to Jupyter runtime with a Python 3 kernel and plotted with matplotlib library. Then contact pressure distribution can be shown in . For statistical analysis, a seaborn library was used, the histogram resulting with violinplot and boxplot that further estimate the relationship between grasping force and contact pressure distribution is shown in .
Figure 7. An example of Data analysis and statistics. Dry run mode test by using 4LW type film shows. (a) Contact pressure distribution per pixel, a 120 × 210 array has been selected and presented. (b) violinplot, histogram and boxplot has been shown.
Results
In this section, 2-Dimension plot pains show contact pressure distribution by differentiating stress by color yielded from the data analysis. Thus, the 2 D plot shows the trace and direction of jaw and high-pressure areas. Also, the model’s shape clearly changes with different materials. Here, by using violin plots most of the data (95%) can be displayed as it includes both boxplot and distribution data, whereas boxplot data alone will ignore outlying data – for example, data samples exceeding 0.2 MPa .
Dry run mode
See and for dry run mode.
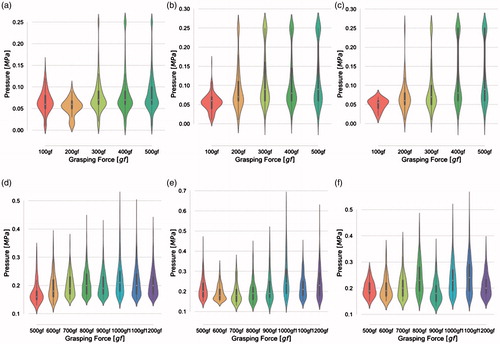
Figure 8. Violinplot for Dry run mode tests using 4LW type film (0.05 MPa ≤ p ≤ 0.20 MPa) from 100gf to 500gf in 100gf steps and using LLLW type film (0.20 MPa ≤ p ≤ 0.60 MPa) from 500gf to 1200gf in 100gf steps (a,b).
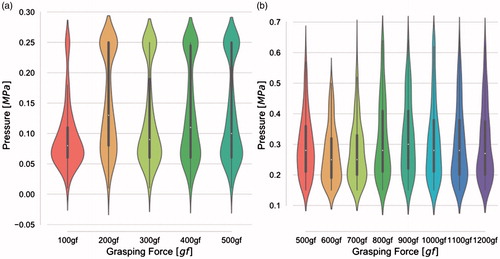
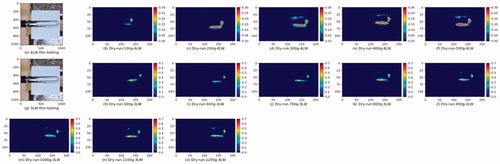
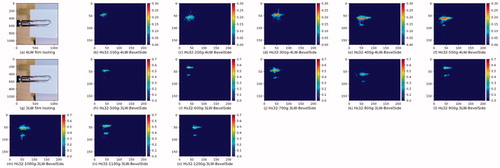
Figure 9. Dry run mode test contact pressure distributions. (a) View of tests using 4LW type film. (b)–(f) using 4LW type film (0.05 MPa ≤ p ≤ 0.20 MPa) in the range of 100gf to 500gf in 100gf steps. (g) View of tests using 3LW type film. (h)–(o) using 3LW type film (0.20 MPa ≤ p ≤ 0.60 MPa) in the range of 500gf to 1200gf resolution 100gf.
Thin side test
See for thin side test.
Figure 10. Thin side test contact pressure distributions of 0Hs model. (a) View of testing by using 4LW type film. (b)–(f) Contact pressure distribution by using 4LW type film (0.05 MPa ≤ p ≤ 0.20 MPa) in force range 100gf to 500gf resolution 100gf. (g) View of testing by using 3LW type film. (h)–(o) Contact pressure distribution by using 3LW type film (0.20 MPa ≤ p ≤ 0.60 MPa) in force range 500gf to 1200gf resolution 100gf.
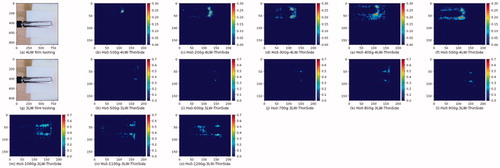
Figure 11. Thin side test contact pressure distributions of 18Hs model. (a) View of testing by using 4LW type film. (b)–(f) Contact pressure distribution by using 4LW type film (0.05 MPa ≤ p ≤ 0.20 MPa) in force range 100gf to 500gf resolution 100gf. (g) View of testing by using 3LW type film. (h)–(o) Contact pressure distribution by using 3LW type film (0.20 MPa ≤ p ≤ 0.60 MPa) in force range 500gf to 1200gf resolution 100gf.
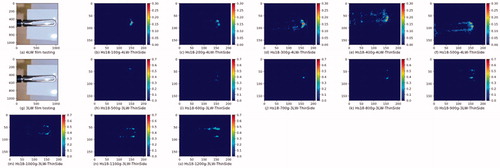
Figure 12. Thin side test contact pressure distributions of 32Hs model. (a) View of testing by using 4LW type film. (b)–(f) Contact pressure distribution by using 4LW type film (0.05 MPa ≤ p ≤ 0.20 MPa) in force range 100gf to 500gf resolution 100gf. (g) View of testing by using 3LW type film. (h)–(o) Contact pressure distribution by using 3LW type film (0.20 MPa ≤p ≤ 0.60 MPa) in force range 500gf to 1200gf resolution 100gf.
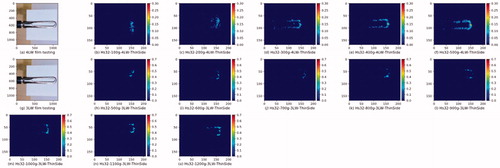
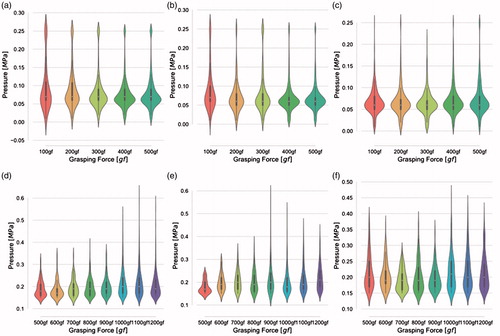
Figure 13. Violinplot for Thin side testing of 0Hs, 18Hs and 32Hs models by using 4LW type film (0.05 MPa ≤ p ≤ 0.20 MPa) from force range 100gf to 500gf in 100gf steps and using LLLW type film (0.20 MPa≤p ≤ 0.60 MPa) from 500gf to 1200gf in 100gf steps (a,b).
Bevel side test
See for Bevel side test.
Figure 14. Violinplot for Bevel side testing of 0Hs, 18Hs and 32Hs models by using 4LW type film (0.20 ≤ p ≤ 0.60) from force range 500gf to 1200gf in 100gf steps and using LLLW type film (0.20 MPa ≤ p ≤ 0.60 MPa) from 500gf to 1200gf in 100gf steps (a,b).
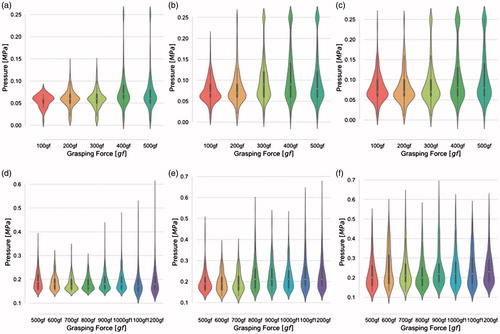
Figure 15. Bevel side test contact pressure distributions of 0Hs model. (a) View of testing by using 4LW type film. (b)–(f) Contact pressure distribution by using 4LW type film (0.05 MPa ≤ p ≤ 0.20 MPa) in force range 100gf to 500gf resolution 100gf. (g) View of testing by using 3LW type film. (h)–(o) Contact pressure distribution by using 3LW type film (0.20 MPa ≤ p ≤ 0.60 MPa) in force range 500gf to 1200gf resolution 100gf.
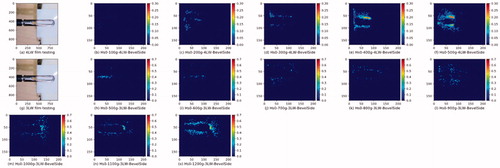
Figure 16. Bevel side test contact pressure distributions of 18Hs model. (a) View of testing by using 4LW type film. (b)–(f) Contact pressure distribution by using 4LW type film (0.05 MPa ≤ p ≤ 0.20 MPa) in force range 100gf to 500gf resolution 100gf. (g) View of testing by using 3LW type film. (h)–(o) Contact pressure distribution by using 3LW type film (0.20 MPa ≤ p ≤ 0.60 MPa) in force range 500gf to 1200gf resolution 100gf.
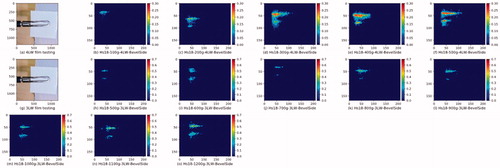
Figure 17. Bevel side test contact pressure distributions of 32Hs model. (a) View of testing by using 4LW type film. (b)–(f) Contact pressure distribution by using 4LW type film (0.05 MPa ≤ p ≤ 0.20 MPa) in force range 100gf to 500gf resolution 100gf. (g) View of testing by using 3LW type film. (h)–(o) Contact pressure distribution by using 3LW type film (0.20 MPa ≤ p ≤ 0.60 MPa) in force range 500gf to 1200gf resolution 100gf.
Thick side test
See for thick side test.
Figure 18. Thick side test contact pressure distributions of 0Hs model. (a) View of testing by using 4LW type film. (b)–(f) Contact pressure distribution by using 4LW type film (0.05 MPa ≤ p ≤ 0.20 MPa) in force range 100gf to 500gf resolution 100gf. (g) View of testing by using 3LW type film. (h)–(o) Contact pressure distribution by using 3LW type film (0.20 MPa ≤ p ≤ 0.60 MPa) in force range 500gf to 1200gf resolution 100gf.
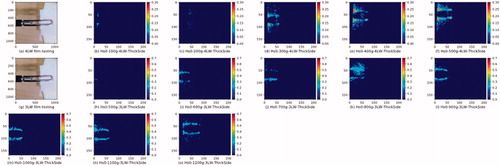
Figure 19. Thick side test contact pressure distributions of 18Hs model. (a) View of testing by using 4LW type film. (b)–(f) Contact pressure distribution by using 4LW type film (0.05 MPa ≤ p ≤ 0.20 MPa) in force range 100gf to 500gf resolution 100gf. (g) View of testing by using 3LW type film. (h)–(o) Contact pressure distribution by using 3LW type film (0.20 MPa ≤ p ≤ 0.60 MPa) in force range 500gf to 1200gf resolution 100gf.
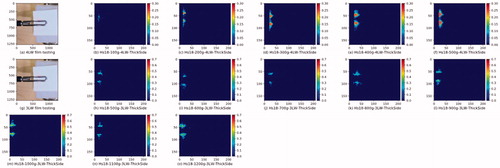
Figure 20. Thick side test contact pressure distributions of 32Hs model. (a) View of testing by using 4LW type film. (b)–(f) Contact pressure distribution by using 4LW type film (0.05 MPa ≤ p ≤ 0.20 MPa) in force range 100gf to 500gf resolution 100gf. (g) View of testing by using 3LW type film. (h)–(o) Contact pressure distribution by using 3LW type film (0.20 MPa ≤ p ≤ 0.60 MPa) in force range 500gf to 1200gf resolution 100gf.
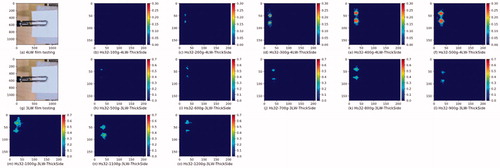
Figure 21. Violinplot for Thick side testing of 0Hs, 18Hs and 32 Hs models by using 4LW type film (0.20 ≤ p ≤ 0.60) from force range 500gf to 1200gf in 100gf steps and using LLLW type film (0.20 MPa ≤ p ≤ 0.60 MPa) from 500gf to 1200gf in 100gf steps (a,b).
Discussion
Dry run mode
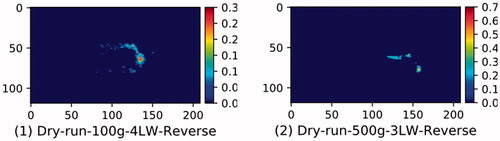
Comparing contact pressure distribution data from 100gf to 500gf with using 4LW type film in , the maximum pressure is focused on the tip center of forceps jaw in 100gf. Then, by following the increase of grasping force, the effective grasp area is increases from the tip side to the root side of jaw . This is because the design of the Johann type jaw has a gap of about 1 mm at the fulcrum of the jaw as shows. , indicate the upper portion of the 2 D plot as the left side of the jaw, testing in the dry run mode showed that contact pressure on the right side is more than that other left side. After rotating the forceps shaft 180° by setting the jaw upside down a retest was conducted using the same method. By comparing and , it clearly indicates these forceps cannot apply equal pressure – perhaps due to mechanical wear.
Figure 22. Retest Dry run mode with rotated forceps shaft 180°. (1) Test with 4LW type film in 100gf. (2) Test with 3LW type film in 500gf.
Regarding the dry run mode test using LLLW type film, shows excessive contact pressure distribution greater than 0.20 MPa. compared to which was tested with the same grasping force, the contact pressure mainly focused at the tip center and right side near to the tip of the jaw with a pressure 0.60 MPa as shown in . And following , the distribution of contact pressure greater than 0.20 MPa on right side increases in the same way as that of 4LW type film test and the distribution on left side appears as the grasping force increases. Therefore, contact pressure was mostly focused at and around the tip center and to the right side near the root of jaw as pressure increased.
Thin side test
Based on the data shown in , contact pressure area decreases as the material’s hardness increases. For the 0Hs model 4LW type film testing, the total effective grasp area pixels reduce with the increase of the material’s hardness from 2286 500gf to 1753 500gf and then to 1331 in 500gf, the distribution is shown in ) show where the pressure is focused. With grasping force from 100gf to 500gf the pressure begins to center at the jaw tip center , then spreads out left and right , from 200gf where the pressure focused across both sides of the tip without any position change. Testing using LLLW type film, showed clearly the effective grasp area pixels also decreased with the increase of model hardness, as can be seen in ), here the maximum pressure can be observed in the case of (0Hs) then reduces in the case of (18Hs) and reduces to a minimum in the case of (32Hs). Accordingly, the 4LW type film tests showed similar pressure distribution trends as the LLLW type film, centering across both sides of the jaw tip. An increase of grasping force resulted in similar pressure distribution growing from tip side to the root side of the jaw, although there was less change in the pressure focal points.
Bevel side test
For the Bevel side test, comparing the data of the 0Hs, 18Hs and 32Hs materials, the relationship between total effective grasp area pixels of the three harnesses’ both for the 4LW type and LLLW type tests for the maximum grasping force test, the contact pressure distribution in this test, with a grasping force of 500gf for the 4LW type film test and 1200gf force for the LLLW type film test, show clearly a triangulated distribution of pressure as is to be expected on the bevel side. By following the pressure distribution of the three models the angle of jaw to the grasp object can be understood. Furthermore, the pressure distribution of 18Hs and 32Hs show different traces between the left and right sides of the jaw which indicate which side is thicker and thinner. But in the case of the 0Hs model this is a little difficult to differentiate especially for the LLLW type film test. Through finding the area with pressure over 0.15 MPa as shown in which is concentrated on the left side in , the testing which used 4LW type film for the 0Hs model determines the left side is the thick side. But the area in the LLLW type film test shown in is predominantly centered at the tip of the jaw.
The pressure distribution trace shown in is the most complete trace in this study, this is on account of the perfect match of the forceps and the target being grasp. By comparing the left and right-side trace from the jaw, two trace were bended by the shape changing with 0Hs material in testing, and both curves bent down-side. Therefore, the testing of 0Hs material with LLLW type film can differentiate the right side as being the thick side.
Thick side test
For the thick side test showed that for 4LW type film testing, maximum pressure exceeding 0.20 MPa started from 300gf for the 0Hs model, and from 200gf in both the 18Hs and 32 Hs models. The effective grasp area pixels reduce as the hardness increases based on the 500gf test data. Here, with reference to the pressure distribution of the 18Hs model for 4LW type film test , the high-pressure area from distribution data is triangular in shape, and the area data of 18Hs 500gf closely resembles that of the 32Hs 500gf case where a circular shape can be seen. Comparing the high-pressure area distribution data for 0Hs 500gf, it may be considered that this change in shape provides a more effective grasp area. Data from the LLLW type film tests, showed a maximum pressure for the 0Hs model at 1200gf as exceeding 0.59 MPa, the 18Hs model at 1200gf as 0.64 MPa and the 32Hs model 1200gf as 0.58 MPa. The pressure distribution for each of the models are shown in .
Conclusion
In this study, the authors have built a simple device to control the grasping force on Johann type forceps and used Fujifilm Prescale pressure measuring system to measure static contact pressure distribution by placing film on test models with different hardness. By analyzing the data from each experiment, the effective grasp area, IQR information of pressure and contact pressure distribution have been outlined and discussed in this paper. In conclusion, some key findings are as follows:
The hardness and contact pressure distribution area of the grasp target are negatively correlated. However, the harder operating target exhibits less deformation total pressure distribution is growing slowly but high-pressure area with a high growth rate. That is hardness and high-pressure target areas are positively correlated.
For very thin tissue such as membrane tissue, grasp contact pressure distribution increases from the tip center to the root side of jaw. And the pressure is focused in the same area. Also, manufacturing accuracy and mechanical wear is critical to ensuring careful handling of thin tissue.
Though, the size film used in this study for taking static pressure information presented some problems such as the film expanding as the secondary jaw of forceps let the LLLW type film thin side tests with less pressure data cased any error there.
This pressure distribution data could provide surgeons, especially junior surgeons with a better understanding of the relationship between force exerted on forceps and the resulting pressure and its distribution on target organs [Citation11].
In the future, by several testing different types of forceps and regular shape models such as circular models, cylindrical model and hemispherical models, a database of contact pressure distribution may be compiled into a library. Then, to provide information for real-time type tactile sensor [Citation12,Citation13] to upscale its resolution what will use on surgical device and surgical robot in IoT direction.
Disclosure statement
No potential conflict of interest was reported by the authors.
Additional information
Funding
References
- Baron TH. Natural orifice transluminal endoscopic surgery. Br J Surg. 2007;94:1–2.
- Mack MJ. Minimally invasive and robotic surgery. JAMA. 2001;285:568–572.
- Chen S-T, Wu M-C, Hsu T-C, et al. Comparison of outcome and cost among open, laparoscopic, and robotic surgical treatments for rectal cancer: a propensity score matched analysis of nationwide inpatient sample data. J Surg Oncol. 2018;117:497–505.
- Cartmill JA, Shakeshaft AJ, Walsh WR, et al. High pressures are generated at the tip of laparoscopic graspers. Aust N Z J Surg. 1999;69:127–130.
- Okamura AM. Haptic feedback in robot-assisted minimally invasive surgery. Curr Opin Urol. 2009;19:102.
- Ottermo MV, Øvstedal M, Langø T, et al. The role of tactile feedback in laparoscopic surgery. Surg Laparosc Endosc Percutan Tech. 2006;16:390–400.
- Culmer P, Barrie J, Hewson R, et al. Reviewing the technological challenges associated with the development of a laparoscopic palpation device. Int J Med Robotics Comput Assist Surg. 2012;8:146–159.
- Brodke KNB, DeMarco AL, Judd KT, et al. Measuring contact area, force, and pressure for bioengineering applications: using Fuji Film and TekScan systems. Med Eng Phys. 2006;28:483–488.
- Tiwana MI, Redmond SJ, Lovell NH. A review of tactile sensing technologies with applications in biomedical engineering. Sens Actuators A Phys. 2012;179:17–31.
- Heijnsdijk EAM, De Visser H, Dankelman J, et al. Slip and damage properties of jaws of laparoscopic graspers. Surg Endosc. 2004;18:974–979.
- De S, Rosen J, Dagan A, et al. Assessment of tissue damage due to mechanical stresses. Int J Robot Res. 2007;26:1159–1171.
- van der Meijden OAJ, Schijven MP. The value of haptic feedback in conventional and robot-assisted minimal invasive surgery and virtual reality training: a current review. Surg Endosc. 2009;23:1180–1190.
- Buess S, Schostek MO, Schurr GF. Review on aspects of artificial tactile feedback in laparoscopic surgery. Med Eng Phys. 2009;31:887–898.