
 ?Mathematical formulae have been encoded as MathML and are displayed in this HTML version using MathJax in order to improve their display. Uncheck the box to turn MathJax off. This feature requires Javascript. Click on a formula to zoom.
Abstract
To overcome the two-class imbalanced classification problem existing in the diagnosis of breast cancer, a hybrid of Random Over Sampling Example, K-means and Support vector machine (RK-SVM) model is proposed which is based on sample selection. Random Over Sampling Example (ROSE) is utilized to balance the dataset and further improve the diagnosis accuracy by Support Vector Machine (SVM). As there is one different sample selection factor via clustering that encourages selecting the samples near the class boundary. The purpose of clustering here is to reduce the risk of removing useful samples and improve the efficiency of sample selection. To test the performance of the new hybrid classifier, it is implemented on breast cancer datasets and the other three datasets from the University of California Irvine (UCI) machine learning repository, which are commonly used datasets in class imbalanced learning. The extensive experimental results show that our proposed hybrid method outperforms most of the competitive algorithms in term of G-mean and accuracy indices. Additionally, experimental results show that this method also performs superiorly for binary problems.
1. Introduction
Breast cancer is one of the top ten occurring cancers among women globally [Citation1]. Until now, the cause of breast cancer has been still under research and the most effective treatment depends on the time when the cancer is detected. Now, early detection is the only way to ensure a long survival of the patients [Citation2,Citation3], which means, timely detection of breast cancer increases the chance of patient survival. Therefore, diagnosing the tumors has become an essential and urgent problem in medical field.
Given that a large number of machine learning methods for automatic detection in breast cancer, and most of them reported high classification accuracy. However, the imbalance problem for breast cancer detection has not been investigated yet.
Class imbalanced problem should be carefully addressed, because the class imbalance problem produces a great negative influence on standard classification learning algorithms. When these standard methods are applied to imbalanced datasets, the machine learning algorithms become biased towards the majority class since its goal is to maximize accuracy, thus this phenomenon gives high overall accuracy, but exhibits poor generalization for the small one. Furthermore, the class of interest is usually the minority (or rare) class. Therefore, breast cancer diagnosis should be classified from the perspective of class imbalanced.
Generally speaking, there are three major solutions for tacking the data imbalance problem. These solutions are based on sampling, algorithm, or cost sensitivity. Sampling techniques operate on the data level and are used to provide a balanced distribution. The algorithm techniques address the class imbalance by involving special algorithms or modifying existing algorithms to directly modify their training mechanism. The cost-sensitive solutions focus on defining a confusion matrix for the different misclassification costs. In particular, the sampling methods are the most commonly considered in the literature [Citation4,Citation5]. This is because the data preprocessing and classifier training tasks can be performed independently. Thus, we aim to propose a sample-based method to alleviate the imbalance effect in breast cancer diagnosis.
One major challenge for using sampling method is parameter setting, such as sampling rates, which have a significant impact on their performance of the minority class. Thus, Random Over Sampling Examples (ROSE) [Citation6] is used to overcome this shortcoming. A membership function is developed for training by support vector machine (SVM), which has been considered as the most effective and common algorithm for breast cancer diagnosis. K-means [Citation7,Citation8] clustering-based method which aims to select the sample near the boundary as the training data is employed to accelerate the training of SVM. In addition, it has proved that the performance can be improved significantly by sample selection algorithm [Citation9,Citation10]. Therefore, in this paper, we aim to propose a hybrid method based on ROSE, K-means, and SVM for breast cancer diagnosis.
The major contributions of this paper are: (1) an effective resampling method of ROSE for resampling in class imbalance domain problem is considered. (2) a strategy of using the K-means clustering technique for selecting the boundary samples is presented. (3) an extensive experiment analysis is tested on six real imbalanced data sets, showing that the proposed method RK-SVM can achieve high classification powers, and hence proving the effectiveness of the proposed approach to breast cancer diagnosis.
The remainder of this paper is organized as follows. Section 2 describes the research methodology including sample selection method and model construction. Experimental evaluation metrics and results are presented in Section 3. Section 4 presents a discussion. Finally, Section 5 concludes the paper along with outlining future directions.
2. Background
For the last decade, it has been proven that introducing machine learning techniques into breast cancer diagnosis gains a lot of benefits. The first part of this section summarizes the methods and results of previous work on breast cancer diagnosis. Last part review offers background knowledge on ROSE, SVM, and K-means.
2.1. Related work
There have been a lot of researches on medical breast cancer diagnosis in literature, and most of them reported high classification accuracies. In Li [Citation11], a novel supervised dimensionality reduction method (referred as QKCLDA) was proposed and the obtained accuracy was 97.26%. A hybrid of K-means and SVM (K-SVM) algorithm was proposed by Zheng et al. [Citation12] and the obtained accuracy was 97.38%. Pashaei et al. [Citation13] used a combination of particle swarm optimism with boosted C5.0 decision tree classifier (PSO + Boosted c5.0) and reported an accuracy of 96.38%. Weng et al. [Citation14] applied a multiple neural network classifiers (EC) technique to the breast cancer diagnosis and achieved an accuracy of 96.5%. Pashaei et al. [Citation15] proposed a novel dimension reduction method named as binary version of Black Hole Algorithm (BBHA), which obtained 97.38% accuracy. A knowledge-based system using fuzzy logic method (referred as EM-PCA-CART-Fuzzy Rule-Based) was developed by Nilashi [Citation16] and the obtained accuracy was 93.2%. All these methods were evaluated on Wisconsin Diagnostic Breast Cancer (WDBC). Peng et al. [Citation17] developed a semi-supervised learning algorithm via artificial intelligence to reduce the need for labeled data. They obtained 98% and 98.3% accuracy on WDBC and Breast Cancer Wisconsin (BCWO) datasets, respectively. Sheikhpour et al. [Citation18] proposed a model (referred as PSO-KDE) to minimize the number of features and the error between the estimate and true for breast cancer diagnosis on the WDBC and BCWO datasets. The obtained accuracies were 98.45% and 98.53%, respectively. In summary, all these methods show an improvement of accuracy in breast cancer diagnosis, but a defect was noted that these methods used the training accuracy as the only criterion to evaluate the performance. Actually, these machine learning methods are based on the assumptions of balanced class distribution, which are violated in breast cancer diagnosis since the non-cancer class vastly outnumber the cancer class.
2.2. Random over sampling examples
Most of the research on imbalance problem is to alter the class distribution to obtain a more balanced sample. ROSE technique also follow this route. But, the difference is ROSE relive the effect of class imbalance from both the phase of model estimation and model assessment. First, ROSE use a ROC curve to measure the performance of the classifier instead of accuracy. Second, bootstrap or cross-validation versions can be chosen as estimation methods. Therefore, ROSE can provide more refined tools to find minority class effectively and accurately. ROSE consists of the following steps:
Let be a training set with
samples
the class label
are attributes of a random vector
defined on
is probability density function. Let
the number of examples belonging to the class
The ROSE procedure is described as follows:
Select
with probability
Select
Sample
2.3. Support vector machine
SVM has been proposed as an effective statistical learning method for classification [Citation19], which seeks to miniminze the upper bound of the generalization error based on the structural risk minimization [Citation20]. The classification problem is solved as a quadratic optimization problem. In the previous research, a large number of SVM studies in breast cancer diagnosis have shown success with this method. However, when the number of instance is imbalanced, the prediction performance cannot be guaranteed. Thus, we aim to take into consideration the balance strategy before making the classification.
2.4. K-means algorithm
From the previous discussion, numerous clustering approaches have been mentioned, K-means is considered only since it is widely used and iterative algorithm. K-means is simpler and effective. In addition, K-means is an unsupervised algorithm for classifying high dimensional numerical data, it can provide a better clustering effect and the interpretability of the algorithm is relatively strong. A K-means problem can be described as an optimization problem to minimize the overall distance between the member to its cluster centroids. i = 1, 2, …, n is the set of D-dimensional points,
is the centroid point. The similarity measurement of K-means algorithm is measured by Euclidean distance. The aim of clustering is to minimize the sum square distance of a class, and it is computed as follow:
(1)
(1)
Then update the centroid point by least square and Lagrange principle, the centroid point is the average distance of each class, meanwhile, to converge the algorithm, the final polycentric center should be kept as constant as possible in the iterative process.
3. The proposed method
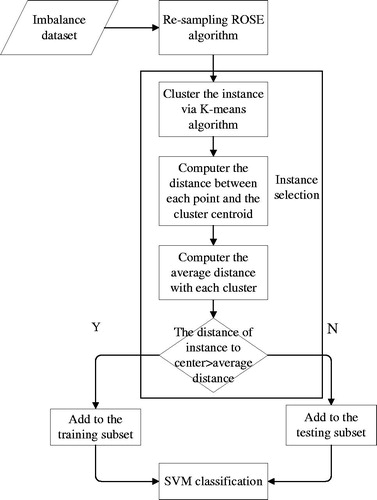
In this section, we give a detailed description of the proposed RK-SVM algorithm. The block diagram for the proposed model is shown in . In the pre-processing stage, ROSE is used to balance the class distribution. ROSE can generate more optimal artificial data which can enhance the accuracy of predictive. The noteworthy stage is the sample selection. Thus, a new efficient sample selection algorithm via K-means to reconstruct the training set is proposed, with the effort of K-mean the samples near the boundary can be selected and used as the training data, in detail, the samples whose distance to the central point are greater than the cluster average distance are the selected samples. The remaining samples are used as the test subset.
Figure 1. Block diagram for the proposed classification model.
3.1. Re-sampling method
Sampling techniques manipulate training data to rectify the skewed class distribution, among which SMOTE [Citation5], borderline-SMOTE [Citation21], ADASYN [Citation22] are the most representative method. However, the drawbacks of these methods are parameter settings and model structures, such as sampling rate and generate the appropriate samples of minority class. Thus, in this paper, ROSE is introduced, as the re-sampling method to deal with imbalanced datasets. There is because ROSE generates suitable artificial samples from both classes since it uses a smoothed bootstrap approach [Citation5]. In addition, ROSE can do model estimation and accuracy evaluation with Receiver Operating Characteristic (ROC) in imbalanced learning. Thus, ROSE can provide good performance. In this paper, the size of samples in non-cancer class outnumbers the cancer ones. Therefore, the non-cancer class is given the majority class and the cancer class is given the minority class. A comparison between using ROSE and the original data distribution is illustrated in .
Figure 2. (a) Distribution of original data samples in the empirical feature space; (b) Distribution of data samplings after ROSE in the empirical space.
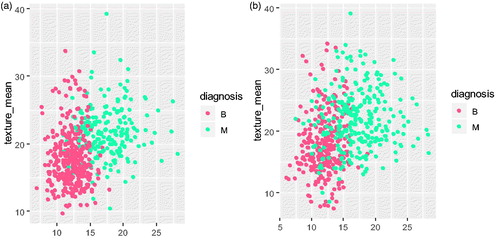
The original data sample distribution is shown in and the result using ROSE in WDBC dataset is shown in . The values of B and M represent the benign and malignant, respectively. Through using ROSE for WDBC dataset, the size of the minority class is increased and meanwhile decrease the number of sample in majority class. Consequently, resulting a balanced training set.
3.2. Sample selection method
After re-sampling method, the imbalanced dataset has been transferred to a balanced dataset. Motivated by the work of Burges [Citation23] that the decision boundary of SVM only depends on support vectors lying close to the class boundary and it has been proved that border points affect classification much than the internal points [Citation19]. Therefore, if samples near the boundary are effectively extracted, the performance of classification is increased, the computation cost of learning is degraded. Thus, we proposed a new sampling selection method to select samples near the boundary region to accelerate the training process of SVM on datasets. K-mean clustering technique with Euclidean metric is utilized. Euclidean metric is used for computing the distance between the points and cluster centriole of the cluster.
This clustering-based sample method has three stages: Firstly, K-means method is used for clustering the samples, K is the cluster number. Secondly, the samples whose distance to the cluster central is greater than the average distance of the clusters are the border samples. These samples are selected and added to the training space. Thirdly, a new training subset space is rebuilt by informative samples. It should be pointed out that if the obtained subset is an imbalanced one, the selection condition should be changed to the distance to the cluster central points are greater than half of the average distance of the clusters. The details of sample selection algorithm are described by the pseudo codes subsequently as follows.
Algorithm 1. The informative sample selection procedure
Input: the synthetic data set after ROSE algorithm
i = 1, 2, …, n is the set of D-dimensional points,
is the centroid point.
is the average distance with cluster
denotes the
feature of member
denotes the
feature of centroid
is the total number,
is the dimension of an input member,
is the number of cluster, and
is a factor to control the number of training samples.
Output: the final training data with informative samples
Step 1. Randomly select sample from
as the centroids point in the cluster,
is determined by the number of clusters.
Step 2. Euclidean metric is used for computing the distance between each point and the centroid in the same cluster, each data point is assigned to its closest centroid. The distance between and the point
is defined by EquationEquation (1)
(1)
(1) :
(2)
(2)
Step 3. Compute new cluster centroid point for reducing the Euclidean distance.
Step 4. Repeat steps 3 and 4 until cluster membership stabilizes.
Step 5. Compute the average distance of each number to the centroid
in the same cluster
which is calculated by using EquationEquation (2)
(2)
(2) :
(3)
(3)
Step 6. Create the final training data set by appending the point
to
if
In this case, is set to 2, which is equal to the number of categories in the dataset and the value of
is set at 1 or 0.5, respectively. It controls the scale of the training subspace and greatly affects the performance of RK-SVM algorithm. For instance, after the K-mean clustering algorithm with
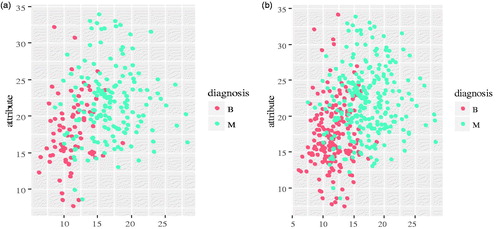
which is a default setting, the samples of WDBC dataset are shown in . As it is shown in , the selected samples are not balanced with 78 of B and 163 of M. In such case,
is set for the WDBC dataset to expand the sample space and prevent imbalance problem simultaneously. The final training samples after K-means algorithm based on sample diversity selection with
are shown in . Trough , we can find the dataset now is almost balance.
Figure 3. (a) the distribution of data sampling with η = 1; (b) the distribution of data sampling with η = 0.5.
3.3. Data mining for classifier
Since the training subset with new samples has been rebuilt, SVM can be considered as the most effective and common algorithm for cancer classification. SVM provides the optimal hyperplane that aims to separate the vectors of the training dataset i = 1, 2, …, m into two different classes
The optimal hyperplane can be stated as follows:
(4)
(4)
Subject to
where is a kernel function,
is a penalty factor to control misclassification. In our application, the vanilla dot kernel is chosen to overwhelm the over-fitting, since we have chosen the informative samples.
has been applied in the SVM algorithm.
4. Experimental results
To clearly observe the impact of RK-SVM on imbalanced datasets, We conduct an exhaustive independent run of experiment. the aim of our research is (1) the ability of keeping majority classification accuracy; and (2) the ability of improving the minority classification accuracy. The experiments are performed on MATLAB and R platforms with a Pentium CPU 2.19 GHz and 4 GB RAM, using R 3.3.3. For SVM, naïve Bayes and Boosted C5.0 classifiers, ’kernlab’, ’e1071’ and ‘C50’ packages have been used. Also, for ROSE and 10-CV algorithms, ‘ROSE’ and ’caret’ packages have been used.
In our experiments, is set to 1 or 0.5, respectively.
indicates that the samples, whose distance to the central point of the cluster are greater than the average distance of clusters, are selected. While
indicates that the samples, whose distance to the central point of the cluster are greater than half of the average distance of clusters, are selected. As for SVM, linear kernel function is chosen. In subsequent experiments, we use the linear kernel function to avoid overfitting since we have selected the most informative samples.
4.1. Dataset
All six datasets listed in come from the UCI repository with various imbalance rate and data set size to make sure that our propose RK-SVM model is reproducible and verifiable and to compare with existing work in literature. Particularly, we treat the first one class in iris data set as minority class, and the other two as majority classes. Thus, iris which is a multi-class data set has been transferred to a two-class data set. If the samples contained in the datasets have the missing values in different attributes, they will be discarded from the datasets. These datasets are all representative ones that have been used in breast cancer diagnosis and imbalance learning in the literature.
Table 1. Experimental datasets.
4.2. Performance measures
Overall accuracy becomes meaningless when the learning cancer is the minority examples [Citation24]. As pointed out by Raeder [Citation25], other performance criteria must be considered since evaluation metrics has an import role for classifier selection. Therefore, other performance criteria such as G-mean, area under curve (AUC) and MCC which are the most common criteria in class imbalance learning are used to validate the performance. Large values of these criteria represent good classification performance. AUC measures the area under the receiver operating characteristic (ROC) curve. G-mean is the harmonic average between sensitivity and specificity. The quality of unbalance binary classification can be obtained by MCC. The G-mean and MCC are calculated based on the confusion matrix as presented in as follows:
(5)
(5)
(6)
(6)
Table 2. Confusion matrix.
A confusion matrix is one of the common approaches to measure the performance for classification model, as shown in . In this study, non-cancer more than cancer samples. Hence, the non-cancer class is given “negative” and the cancer is given “positive”.
4.3. Experiment I
Three UCI data sets which are WDBC, BCWO, and WPBC are used. These are the complete and representative datasets for breast cancer diagnosis. Thus, the testing results are reliable and comparable.
The first step of the experiment is normalization. The values for feature ranged between 0 and 1. As it is shown in , in WDBC data set, the final training dataset contains 194 samples from the benign class and 250 samples from the malignant class. Then, SVM is applied to classify the samples. In experiment with WDBC dataset, η is set to 0.5.
To illustrate the effectiveness of our approach, the results of RK-SVM with R-SVM, R-boosted C5.0, and RK-boosted C5.0 are compared. For SVM classifier, linear kernel function is used. RK-boosted C5.0 and R-Boosted C5.0 which are ensemble algorithms with different trails obtained from search grid. Trails are set to 1, 1, and 10 in WDBC, WPBC, and BCWO datasets. Note that in the R-SVM and R-boosted C5.0, we first generate data by ROSE and then classify the samples by SVM and boosted C5.0 algorithms based on 10-fold cross-validation sample selection method. In case of RK-boosted C5.0, we first generate data by ROSE and then classify the samples by boosting C5.0 based on the proposed sample selection method. We have considered these methods because comparison with R-SVM, it can show the benefits of clustering-based method, comparison with R-boosted C5.0 and RK-boosted C5.0, it can show the benefits of SVM. In addition, comparison among RK-boosted C5.0 and R-boosted C5.0, it further shows the benefits of clustering-based method. For the convenience of comparison, the performance of RK-SVM in the following tables are shown in bold. In , the performance of RK-SVM on WDBC, BCWO and WPBC are given.
Table 3. Performance comparison based on WDBC dataset.
displays classification accuracy, sensitivity, specificity, G-mean, AUC and MCC of four methods on breast cancer datasets, respectively. The value of RK-SVM is better than R-SVM which utilizes the 10-fold cross-validation in term of accuracy, G-mean, AUC, and MCC. In addition, the value of RK-boosted C5.0 is better than R-boosted C5.0 in term of accuracy, G-mean, and AUC. These results mean that the performance of sample selection via clustering is better than those of 10-fold cross- validation. Furthermore, the performance of RK-SVM outperforms considerably comparing to RK-boosted C5.0 in term of all indicators. As can be seen from the computational results in term of accuracy, G-mean, AUC and MCC, RK-SVM is slightly better than the other commonly used methods for all representative breast cancer dataset.
In order to perform a comprehensive comparison of our proposed method, the comparison results using RK-SVM in WDBC and BCWO datasets compare with different predicting methods in the literature listed in and , respectively. It should be pointed out that in WPBC dataset we do not get the data from the references as we know.
Table 4. Performance comparison based on the WDBC dataset.
Table 5. Performance comparison based on the BCWO dataset.
For comparison purpose, classifier accuracies, sensitivities, specificities and G-mean are obtained with our proposed RK-SVM and other classifiers from the literature in WDBC and BCWO datasets are listed and , respectively. The symbol “-” in Table indicates that we do not get the data from the reference. RK-SVM has obtained 100% accuracy based on sample selection method, which is as better as FSMLP. Our proposed algorithms perform better than the results of the literature. Therefore, in order to increase the reliability, we compare the proposed method with classical SVM and Naïve Bayes (NB) methods, and they only obtain an accuracy of 97.65% and 93.53%, respectively. Therefore, it can be easily seen that RK-SVM has an outstanding performance in WDBC dataset.
For BCWO dataset, it is evident from that the proposed RK-SVM has higher G-mean of 98.07%. Therefore, it is possible to say that the proposed RK-SVM algorithm performs better than the results of the literature. Note that RK-SVM gets the best accuracy and G-mean in two breast cancer datasets. These results illustrate the availability of choosing RK-SVM as the classifier for breast cancer diagnosis. In order to further investigate the effectiveness of RK-SVM, the experiments under different datasets are also performed.
4.4. Experiment II
To illustrate the generalization performance of RK-SVM method, our experiments are tested on three data sets including 2 two-class datasets and 1 multi-class dataset. They are all well chosen with various imbalance rate and data set size which have conducted in . In these experiments, is set to 1. For Pima, transfusion, and iris datasets, the values of trials are chosen as 10, 1, and 1, respectively. provides the results of the experiments on three imbalanced datasets. The performance of RK-SVM is boldfaced.
Table 6. Result comparison based on different dataset.
As shown in , we observe that the proposed RK-SVM is able to improve the performance in term of AUC, G-mean, and MCC comparing to the combination methods on different datasets.
4.5. Experiment III
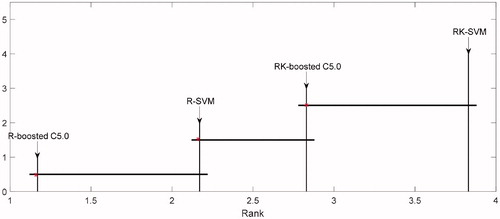
In order to evaluate the significance of results from the comparative methods, Friedman test with 95% confidence level [Citation26] is carried out on six datasets. All the methods on six datasets are sorted according to the mean ranks on their MCC performance measures, since as the previous analysis if the data are unbalanced, computing MCC of classification system can be much more appropriate than computing other measures [Citation27]. The null alternative hypothesis is that there is no significant difference between the methods on six datasets. Subsequently, displays the p-value which is less than 0.05, the test result rejects the null hypothesis, i.e., there are some differences between these methods. After that, we performed a post hot test to identify if the methods have significant difference [Citation28]. A Nemenyi test at the significance level is used as the post-hoc method.
Table 7. Mean rank of Freidman test over the four classification algorithms.
All the methods are in ordered by its mean ranks on six datasets. It is denoted by ‘*’. The method critical difference is denoted by its right line segment. The line segment to the right of each method describes its critical difference. The comparison between R-boosted C5.0, R-SVM, RK-boosted C5.0 and RK-SVM using Nemenyi post hoc test is plot in . As it can be observed from the results of listed, the RK-SVM method performs best than other methods for classification of imbalanced data sets.
Figure 4. Results of the pairwise comparisons of methods using Nemenyi post hoc test.
5. Discussion
Based on the experiment analysis, we conclude that:
G-mean, AUC and MCC indicate that our proposed ROSE + KMEANS + SVM approach is the best hybrid classifier for imbalanced datasets.
In term of accuracy, our proposed algorithm can maintain a good classification accuracy of overall class data except for RK-boosted C5.0 in transfusion dataset. These results in classification accuracy are mainly due to the boosted C5.0. In practice, the ensemble method has good ability to classification but how to get an optimal parameter of boosting value through trial-and-error is a mammoth task. However, it suffers from computationally expensive. For WDBC dataset, the best accuracy was obtained by FSMLP, which is as better as RK-SVM. According to our experiments outcomes, the proposed RK-SVM algorithm achieves better classification accuracy performance with less fixed parameters in most case. So the proposed RK-SVM is strongly desirable.
In term of sensitivity and specificity indices, the performance of our proposed RK-SVM is stable, the G-mean is the geometric mean of recall overall class and the MCC shows the quality of unbalance binary classifications. In addition, the MCC achieved by RK-SVM is remarkable, it shows that RK-SVM can find minority class accurately without losing overall performance. Specifically, the RK-SVM model shows its superiority in sensitivity and specificity.
A comparison between RK-SVM and R-SVM shows that the proposed sample selection method via clustering is better than 10-CV. According to our study, the sample selection method via clustering is superior to 10-cv random selection in dealing with sample selection problem.
To show the adaptation and generation capability of our proposed sample selection method, we compare RK-boosted C5.0 and R-boosted C5.0. As it can be observed from the listed results, the sample selection method via clustering performs well in all datasets. Note that, according to the results of our experiment, the sample selection method proposed by Liu et al. [Citation10], Chen et al. [Citation9] and Lee et al. [Citation15] in selecting the important sample can be resolved by applying cluster algorithms. In summary, the sample selection via clustering method is beneficial for sample selection. For sample, one observes that sample method via clustering is better than 10-cv random selection. This remarkable result gives more alternative as sample selection.
Notably, Lin et al.[Citation29] concluded that AdaBoost + C4.5 is the best ensemble classifier for breast cancer classification. However, a comparison between RK-SVM and RK-boosted C5.0 shows that the proposed RK-SVM is slightly better for classification. The reason may be that we do not deeply understand how the parameter of boosting impact on the performance. In fact, it has to be chosen carefully in advance. This finding provides more alternatives for selecting efficient algorithms for breast cancer diagnosis and can also be applied into imbalance class classification. The statistical tests further confirm this conclusion.
In summary, for breast cancer diagnosis we aim to find the minority class effectively, however, the performance indices of tradition classifiers such as SVM, NB and other literature methods show controversial results. specifically, the accuracy of these classifiers is higher but specificity is low since the majority class samples dominate the minority one, ignoring the sample in minority class. Such imbalance class distribution significantly hinders predictive performance and causes learning bias towards the majority class and poor generalization. With the help of ROSE, the original data set is balanced by a combination of over-sampling and under-sampling methods. Moreover, the importance of sample selection has been presented. So, an optimal training set is obtained via clustering method that can effectively extract informative samples, which maximizes the retention of support vectors in the reconstructed subset. Our proposed RK-SVM classifier has shown its promising predictive performance in breast cancer diagnosis and can be a good alternative to the imbalance learning methods.
6. Conclusion and future work
In this paper, we propose an RK-SVM algorithm based on sample selection to address the existing class-imbalance problem existing in breast cancer diagnosis. Our proposed method is consists of three steps: Firstly, ROSE algorithm is used to balance the class distribution. Secondly, sample selection via K-means clustering is used to select the informative samples. The diversity training sample space is rebuilt with informative samples. Thirdly, SVM is performed to classification. According to the results, the RK-SVM improves performance significantly without increasing algorithm complexity. Thus sample selection method actually gives a new thought on how to hand the class imbalance problem.
Although RK-SVM is effective, there are still several limitations to be improved in the future. Firstly, the use ration (the ratio is defined as the number of used samples divided by the total number of samples) of each method is not considered. Besides, in reality of the label data is very expensive to obtain. Thus, we aim to use fewer label data. Finally, the effect of should be further analysis since it has a great effect on performance. Thus, if
more samples have been selected and added in the training set. Thereby, the performance of RK-SVM should be improved with less informative samples.
Disclosure statement
No potential conflict of interest was reported by the authors.
Additional information
Funding
References
- Torre LA, Bray F, Siegel RL, et al. Global cancer statistics, 2012. CA Cancer J Clin. 2015;65:87–108.
- Paulin F, Santhakumaran A. Classification of breast cancer by comparing back propagation training algorithms. Int J Comp Sci Eng. 2011;3:S68.
- Ahan S, Polat K, Kodaz H, et al. A new hybrid method based on fuzzy-artificial immune system and k-nn algorithm for breast cancer diagnosis. Comput Biol Med. 2007;37:415.
- Wang S, Minku LL, Yao X. Resampling-based ensemble methods for online class imbalance learning. IEEE Trans Knowl Data Eng. 2015;27:1356–1368.
- Chawla NV, Bowyer KW, Hall LO, et al. SMOTE: synthetic minority over-sampling technique. JAIR. 2002;16:321–357.
- Lunardon N, Menardi G, Torelli N. ROSE: a package for binary imbalanced learning. R J. 2014;6:79–89.
- Jain AK, Murty MN, Flynn PJ. Data clustering: a review. ACM Comput Surv. 1999;31:264–323.
- Ng MK. A note on constrained k-means algorithms. Pattern Recognit. 2000;33:515–519.
- Chen J, Zhang C, Xue X, et al. Fast instance selection for speeding up support vector machines. Knowl-Based Syst. 2013;45:1–7.
- Liu C, Wang W, Wang M, et al. An efficient instance selection algorithm to reconstruct training set for support vector machine. Knowl-Based Syst. 2017;116:58–73.
- Li J-B, Peng Y, Liu D. Quasiconformal kernel common locality discriminant analysis with application to breast cancer diagnosis. Inf Sci. 2013;223:256–269.
- Zheng B, Yoon SW, Lam SS. Breast cancer diagnosis based on feature extraction using a hybrid of K-means and support vector machine algorithms. Expert Syst Appl. 2014;41:1476–1482.
- Pashaei E, Ozen M, Aydin N. Improving medical diagnosis reliability using Boosted C5.0 decision tree empowered by Particle Swarm Optimization. Conference proceedings: Annual International Conference of the IEEE Engineering in Medicine and Biology Society IEEE Engineering in Medicine and Biology Society Annual Conference; 2015 Aug; Milan, Italy. p. 7230–7233.
- Weng C-H, Huang T-K, Han R-P. Disease prediction with different types of neural network classifiers. Telemat Inform. 2016;33:277–292.
- Lee W, Jun C-H, Lee J-S. Instance categorization by support vector machines to adjust weights in AdaBoost for imbalanced data classification. Inf Sci. 2017;381:92–103.
- Nilashi M, Ibrahim O, Ahmadi H, et al. A knowledge-based system for breast cancer classification using fuzzy logic method. Telemat Inform. 2017;34:133–144.
- Peng L, Chen W, Zhou W, et al. An immune-inspired semi-supervised algorithm for breast cancer diagnosis. Comput Meth Prog Bio. 2016;134:259–265.
- Sheikhpour R, Sarram MA, Sheikhpour R. Particle swarm optimization for bandwidth determination and feature selection of kernel density estimation based classifiers in diagnosis of breast cancer. Appl Soft Comput. 2016;40:113–131.
- Idicula-Thomas S, Kulkarni AJ, Kulkarni BD, et al. A support vector machine-based method for predicting the propensity of a protein to be soluble or to form inclusion body on overexpression in Escherichia coli. Bioinformatics. 2006;22:278–284.
- Cortes C, Vapnik V. Support-vector networks. Mach Learn. 1995;20:273–297.
- Han H, Wang W-Y, Mao B-H, editors. Borderline-SMOTE: a new over-sampling method in imbalanced data sets learning. advances in intelligent computing. Berlin (Heidelberg): Springer Berlin Heidelberg; 2005.
- He H, Bai Y, Garcia EA, et al., editors. ADASYN: Adaptive synthetic sampling approach for imbalanced learning. IEEE International Joint Conference on Neural Networks; 2008 June 1–8; Hong Kong, China: IEEE.
- Burges CJC. Geometry and invariance in kernel based methods In: Schölkopf B, Burges CJC, Smola, AJ, et al. editors. Advances in kernel methods. Cambridge: MIT Press; 1999. p. 89–116.
- Wang S, Yao X. Relationships between diversity of classification ensembles and single-class performance measures. IEEE T Knowl Data En. 2012;25:206–219.
- Raeder T, Forman G, Chawla NV. Learning from imbalanced data: evaluation matters. In: Holmes DE, Jain LC, editors. Data mining: foundations and intelligent paradigms: volume 1: clustering, association and classification. Berlin (Heidelberg): Springer Berlin Heidelberg; 2012. p. 315–331.
- Friedman M. The use of ranks to avoid the assumption of normality implicit in the analysis of variance. J Am Stat Assoc. 1937;32:675–701.
- Pashaei E, Aydin N. Binary black hole algorithm for feature selection and classification on biological data. Appl Soft Comput. 2017;56:94–106.
- Demšar J. Statistical comparisons of classifiers over multiple data sets. J Mach Learn Res. 2006;7:1–30.
- Lin WC, Tsai CF, Hu YH, et al. Clustering-based undersampling in class-imbalanced data. Inf Sci. 2017;409:17–26.