
 ?Mathematical formulae have been encoded as MathML and are displayed in this HTML version using MathJax in order to improve their display. Uncheck the box to turn MathJax off. This feature requires Javascript. Click on a formula to zoom.
Abstract
A knowledge graph is a structured representation of data that can express entity and relational knowledge. More attention has been paid to the study of a clinical knowledge graph, especially in the field of chronic diseases. However, knowledge graph construction is based mainly on electronic medical records and other data sources, and the authority of the constructed knowledge graph presents some problems. Therefore, regarding the quality of evidence, this study, in combination with experimental research on system evaluation and meta-analysis presents some new information, On the basis of evidence-based medicine (EBM), the secondary results of systematic evaluation and meta-analyses of social, psychological, and behavioral aspects were extracted as data for the core nodes and edges of a knowledge graph to construct a graph of type 2 diabetes (T2D) and its complications. In this study, relevant life-style evidence that are factors for the risk of diabetic retinopathy (DR), diabetic nephropathy (DN), diabetic foot (DF), and diabetic depression (DD), and the results of several of the relevant clinical test, including bariatric surgery, myopia, lipid-lowering drugs, lipid-lowering drug duration, blood glucose control, disease course, glycosylated hemoglobin, fasting blood glucose, hypertension, sex, smoking and other common lifestyle characteristics were finally extracted. The evidence-based knowledge graph of the DM complications was constructed by extracting relevant disease, risk factors, risk outcomes, and other diabetes entities and the strength of the data for the odds ratio (OR) or relative risk (RR) correlations from clinical evidence. Moreover, the risk prediction models constructed using a logistic model were incorporated into the knowledge graph to visualize the risk score of DM complications for each user. In short, the EBM-powered construction of the knowledge graph could provide high-quality information to support decisions for the prevention and control of diabetes and its complications.
1. Introduction
Diabetes mellitus (DM) is a public health problem and chronic metabolic disease that continues to increase throughout the word. According to relevant survey data, by 2030, there will be ∼550 million DM patients worldwide [Citation1]. DM has multiple causes that result in hyperglycemia, which is a metabolic disturbance caused by insulin deficiency or the reduced effect of insulin on target tissues. According to the DM diagnosis and classification criteria published by the World Health Organization (WHO) in 1999 [Citation2], DM can be divided into the following four types: type 1 (T1D), type 2 (T2D), gestational, and other special types. T1D is characterized by a complete lack of insulin and physiological destruction of pancreatic beta cells, also called ‘islet’ cells. The autoimmune damage to these islet cells is ongoing. If 80% of these cells are irreversibly damaged, clinical manifestations of the disease arise. T2D, usually develops after age 35–40 years, is known as non-insulin dependent DM, and is caused by insufficient insulin secretion. T2D has been the subject of many studies [Citation3]. DM can cause a variety of complications, such as diabetic retinopathy (DR), diabetic nephropathy (DN), diabetic foot (DF), and diabetic depression (DD). The incidence of these complications from DM is high, and the consequences are serious, and often life-threatening; therefore, a timely and accurate understanding of the risk factors of DM and its complications and an evidence-based knowledge graph, can provide patients with a visualization of the risk factors, and a reference for doctors to use when deciding on proper prevention and treatment [Citation4].
The biomedical knowledge graph has become an important tool for providing medical knowledge. This knowledge is represented as ‘triples’ which refers to the expression of entity-relation-entity. Triples include information on the source of the data, such as scientific publications, and the entry information of the database, etc. A knowledge graph is used by researches for identifying the biomarkers of a disease [Citation5], and the disease mechanisms [Citation6], and contains cumulative information from case data input into the Open Pharmacological Concepts Triple Store project [Citation7]. Knowledge graphs are commonly constructed by using mainly knowledge from a biomedical literature database, integrating knowledge graphs, describing relationships among known biomedical concepts [Citation8], using the Euretos Knowledge Platform (EKP) and building a symptom-disease-related knowledge graph using data collected from previous electronic medical records (EMRs) [Citation9].
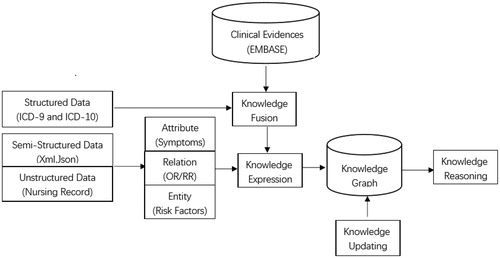
Knowledge graphs model their information on relationship of entities. Entities are used as the nodes, and relationship as the lines. Knowledge is represented and organized using a network structure [Citation10]. The process of building a knowledge graph usually comprises three main progresses. First, facts such as entities, relationships, and properties are extracted from original data. The source of the data could be structured, semi-structured, or unstructured. from encyclopedic sites and various vertical or specific sites. Second, the facts extracted from the original databases are stored. Finally, the new database is incorporated into the knowledge base. After designing all of the entities and relationships, the knowledge graph is constructed from bottom to top, which refers to extracting the entities from some of the open-link data, selecting relatively highly confident entities to add to the knowledge base, and building the knowledge graph [Citation11]. The flowchart of the knowledge graph is provided in . In the present study, we extracted lifestyle risk factors from systematic reviews and constructed an evidence-based visual knowledge graph that can provide support to doctors to help them decide on the best approach for the prevention and control of DM and its complications.
Figure 1. Flowchart of knowledge graph construction.
2. Materials and methods
2.1. Expert-reviewed clinical evidence
The data for this study were mainly extracted from the literature. On the basis of evidence-based medicine, clinical research evidence related to DR, DF, DN, and DD were included in the results of secondary studies from systematic evaluation and meta-analyses and treated as one of the major complications of DM used in constructing our knowledge graph. The characteristics of the risks of, treatments for, and tests for DR, DN, DF, DD were extracted, which comprised bariatric surgery, myopia, lipid-lowering drugs, lipid-lowering drug duration, blood glucose control, course of disease, glycosylated hemoglobin, fasting blood sugar, hypertension, sex, smoking, and other common lifestyle characteristics. The clinical evidence was used to extract the risk factors and risk outcomes of the corresponding diseases as the entities for the DR knowledge graph. The odds ratio (OR), relative risk (RR), and other data on correlation strength between risk factors and risk outcomes were used to establish the relationship between the entities. We comprehensively searched a series of electronic databases, such as the China National Knowledge Infrastructure (CNKI), Wan Fang, VIP, PubMed, Embase, Web of Science, ScienceDirect, SpringerLink and Cochrane Library (updated to June 2019), for risk factors and risk outcomes using the following key words: ‘diabetic retinopathy’, ‘DR’, ‘proliferative diabetic retinopathy’, ‘PDR’, ‘non-proliferative diabetic retinopathy’ , ‘NPDR’, ‘diabetic eye complications’, ‘diabetic foot’, ‘DF’, ‘diabetic depression’, ‘DD’, ‘diabetic nephropathy’, ‘DN’, ‘diabetic macular edema’, ‘DME’, ‘meta-analysis’ and ‘systematic review’.
2.2. Quality reviewing for retrieved results
The inclusion criteria for the downloaded articles included in the study were as follows: (1) meta-analyses or systematic evaluations with detailed experimental data; (2) clear criteria for diagnoses of diseases, such as it having complied with T2D, according to the 1999 WHO standard; DR, DF, DN, DD based on the guidelines for each clinical diagnosis and treatment respectively; and experimental groups that were T2D patients with complications and control groups that were T2D patients without complications; (3) methods used for data analyses were correct; (4) data provide an OR value and 95% confidence interval (CI), or the data provided can be converted to an OR value and 95% CI; and (5) risk factors met the conditions as measured and recorded by patients. The exclusion criteria were as follows: (1) non-meta-analyses without complete experimental data; (2) animal experiments; (3) no clear criteria for disease diagnosis and no distinction between T1D and T2D; (4) simple descriptive research; (5) risk factors not related to the study, such as some clinical laboratory tests; (6) studies published more than once; or (7) research on translating foreign papers. We used Endnote ver.8.01 (Thomson Reuters, New York, NY, USA) to compile the results after eliminating the duplicates. Based on the eligibility criteria, title, abstract, and full text, the two authors independently assessed, and compared the lists; any differences of opinion were resolved by consensus. The study was then judged from three broad perspectives based on the Newcastle-Ottawa Scale (NOS scale) as follows: 1) selection of study groups, 2) comparability of each group, 3) and the results of exposure. Based on eight subitems and nine subpoints, a comprehensive quantitative assessment was conducted of the seven articles [Citation12–18] that were finally included in the study was. Based on NOS, each study was rated as high quality if it received at least eight stars, medium quality for seven stars, or low quality less than seven stars [Citation19].
2.3. Entity and relationship extraction
We selected the abstracts of the articles and obtained complete research articles that met all predetermined conditions for a detailed review. The three reviewers independently extracted the data based on eligibility criteria and full-text information using extraction tables, and carefully reviewed all the data by identifying all studies by other authors. The following items were extracted from the reports: first author, year of publication, inclusion or exclusion criteria, number of included articles, sample size, age, race, duration of illness, body mass index (BMI), risk factors and associated OR values, 95% CI, chi-square test results, degree of freedom (df), I values, z-test value of the overall effect, and p values. Because the present study was based on meta-analyses, the reviewers also focused on collating and checking the information in a forest map to ensure the accuracy of OR, and used the known data to uniformly convert some RR values into OR values. In addition, according to the principles of I2 >50, p < 0.05 being significantly different, and a combined effect of p < 0.05 having statistical significance, the data were initially evaluated and screened. Finally, two of the three reviewers would reach a consensus after discussion with the third reviewer if there were any disagreements after excluding all duplicate studies and estimating the quality of included studies.
2.4. Construction of risk prediction model for DM complications
For case–control study data, the logistic regression model can be used to calculate OR of risk the factors and can predict the incidence of the disease. OR of each risk factor was pooled from the above extracted meta-analyses that summarized similar evidences using a random effect or fixed effect model and used to calculate the correlation coefficient of the model. In this study, the logistic regression model was selected as follows:
(1)
(1)
where P is the risk of an individual disease,
(2)
(2)
where x1, x2, x3…xi…xn are the first, second, … i…n risk factors respectively; the coefficient βi is estimated by Ln(ORi); and constant term α is estimated as follows:
(3)
(3)
here in prev represents the reported prevalence of DM in the local area. When combined with the results of the meta-analyses, a risk assessment model was constructed for the onset of individual DM complications.
2.5. Knowledge graph modeling and reasoning
We used the ‘igraph’, ‘shiny’, and ‘ggplot2’ in R to model the knowledge graph. The main function of ‘shiny’ was to make the app visible, so that the user could easily access it on the web. The ‘igraph’ function mainly created the structure of the graph, and stored some of the information, such as points and edges and edge rights. The ‘ggplot2’ function mainly implemented the output graph, and changed the landscaping s color of the sizes of the points and edges. The application was composed of two parts, the user interface (UI), and the result visualization page. The user information could be input by using the slider on the UI end of the ‘shiny’ function, and the risk factors and other results could be obtained after calculation. The calculated risk scores were then mapped onto the graph, so that the predicted results could be visualized based on the size of the DM complication nodes.
3. Results
3.1. Construction of knowledge graph of DM complications
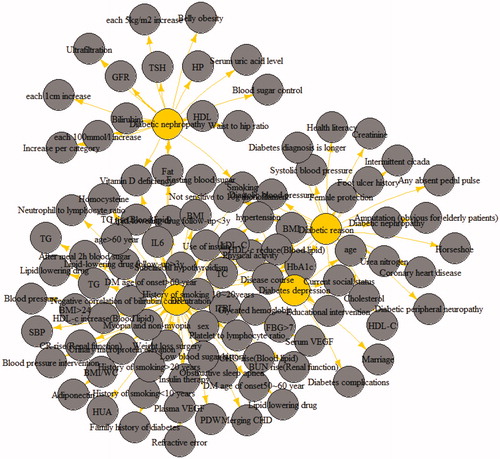
There were totally 10 life style risk factors identified from 7 studies, that comprised 59,936 subjects, these were determined as risk nodes for graph construction. The qualitative and quantitative association between these factors and outcomes, in our case, DM and its complications, were defined as weighted edges. The knowledge graph was created using existing data and the related points, and was displayed on a web page. Triples (risk factors, OR/RR, risk outcomes) were constructed by selecting entities such as risk factors, and risk outcomes (i.e. DR) and correlation strength such as OR/RR from the final extracted data. In RStudio, the constructed triples were used to establish a table of nodes and edges, where the nodes were entities, such as extracted risk factors and risk outcomes, and the edges were the relationships between the entities. Finally, the evidence-based DM complications knowledge graph constructed using the plot function in RStudio is provided in . As shown in , the length of the line represents the strength of the association. For example, the length of the line connecting glycosylated hemoglobin with DR is shorter compared with than that of the lipid-lowering drug follow-up at <3 years. In terms of correlation strength of OR/RR, the OR/RR value of glycosylated hemoglobin was 1.4, while that of lipid-lowering drug follow-up of <3 years was 0.37, which indicated that the shorter the line between risk factors and DR, the more dangerous the risk factor.
Figure 2. Knowledge graph for DM complication. (Gray nodes: life style risk factors; yellow nodes: DM complications.)
3.2. Prediction and visualization of the risk score for DM complications
The DM complications risk prediction models were incorporated into the knowledge graph using ‘shiny’ to visualize the predictions. Using DR as an example, after the user selects the corresponding risk factors according to their conditions, the value of the DR risk is calculated and mapped into the graph as the size of DR node. The results of four specific test cases represented by letters a, b, c, and d are shown in . The values in the last column of are the DR risk scores, respectively. These scores were mapped into the DR nodes in the four constructed graphs (). Combining and , we could predict the possibility of DR because the value of DR risk was proportional to the size of the DR node.
Figure 3. Visualization of personalized prediction results in the knowledge graph (a, b, c, d represented the four test cases in ).
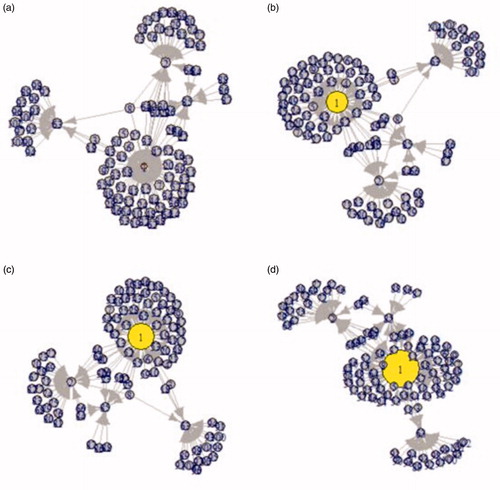
Table 1. Risk score predicted using the constructed model in four test cases.
4. Discussion
The risk prediction models on DM and DM complications have been used over the last several decades. For example, the UKPDS model in the United Kingdom [Citation20] combined the logistic regression model with the Gompertz model to simulate clinical indicators of T2D, seven common complications, and their related results, and to predict the risks of complications in DM patients. In addition, there are several machine learning protocols to construct DM risk prediction models, such as neural network models [Citation21], decision tree models [Citation22], and random forests [Citation23]. In recent years, more and more models of DM and its complications have been developed based on EMRs. In a recent study, longitudinal data from 64,059 DM patient EMRs were used to construct a new model for diabetic kidney disease (DKD) that predicts a 71% increase in the disease [Citation24]. Graph-based methods are also being developed. Thomas et al. [Citation25] have used the real-world data and have concentrated on building models based on DM patient demographics, disease diagnoses, and clinical variables to predict the occurrence of one or more possible complications. Accordingly, the peculiarity of the research in our article lies in the selection of lifestyle risk factors and the associations between those risk factors and DM as well as its complications by incorporating the steps of the EBM protocols, This summarizes the original research exposure factors and high-quality clinical studies of DM and its complications in an interpretable and trustworthy way. Because EBM method contain high levels of evidence and clinical acceptance, and they have been incorporated into some modeling researches [Citation26,Citation27].
The present study was based on evidence-based knowledge and comprehensively integrated multiple database systems to strictly search for systematic evaluations or meta-analyses of OR or RR factors in patients with DR. Both OR and RR are quantitative measures on the association between exposures and outcomes. Relevant data show that when the incidence of the disease being studied is low, the RR value can be regarded as an approximate value of the OR value. When we obtained an appropriate OR through logistic regression, we adjusted it appropriately to provide better predictions [Citation28,Citation29]. After extracting the risk factors and their combined OR values, the knowledge graph of evidence-based DR was depicted, which provided a more scientific and authoritative method by which to predict and managed the risk of DR, and also provided new ideas for the establishment of other models of DM complications models.
It is the comparisons with the maps that are constructed by other methods. From the data sources, compared with other mapping knowledge domains that extract data from EMRs, encyclopedia sites and various vertical sites, the maps that are based on data extracted from evidence-based knowledge have a higher level of evidence, stronger authority and are more persuasive. At the application level, using the knowledge in the biomedical literature databases, the integration of knowledge mapping domains can describe the relationship between only the biomedical concept what is of known, such as the drug, disease, and gene, while on the basis of systematic evaluations and meta-analyses, from the aspects of society, environment, lifestyle and other factors, the knowledge mapping domains based on evidence-based knowledge use the optimized logistic regression model to establish a patient-oriented risk prediction model for DR, which can play a role in clinical decisions on prevention and treatment. In combination with EBM, the models constructed using the knowledge graph is of great significance can provide decision support for the prevention and control of DM and its complications.
Disclosure statement
No potential conflict of interest was reported by the author(s).
Additional information
Funding
References
- Wang D, Yang J. New progress in investigation and pathogenesis of diabetic retinopathy. Chin J Ophthalmol Electron Ed. 2016;6:273–282.
- Anonymous. Definition of diabetes, diagnosis and typing, and complications of diabetes WHO consultation report. Chin J Diab. 2000:48–49.
- Pan CY, Jin WS. Epidemiology of type 2 diabetes. Chin J Endocrinol Metab. 2005;21:1–5.
- Qiao X, Yao Z, Chen J. Visualization analysis of diabetes treatment based on knowledge map. China Medical Herald. 2014;11:122–125.
- Vlietstra WJ, Zielman R, van Dongen RM, et al. Automated extraction of potential migraine biomarkers using a semantic graph. J Biomed Inform. 2017;71:178–189.
- Martin HA, Gordon B. Stephan . Bioinformatics mining and modeling methods for the identification of disease mechanisms in neurodegenerative disorders. Int J Mol Sci. 2015;16:29179–29206.
- Azzaoui K, Jacoby E, Senger S, et al. Scientific competency questions as the basis for semantically enriched open pharmacological space development. Drug Discov Today. 2013;18:843–852.
- Chen B, Ding Y, Wild DJ. Assessing drug target association using semantic linked data. PLoS Comput Biol. 2012;8:e1002574.
- Rotmensch M, Halpern Y, Tlimat A, et al. Learning a health knowledge graph from electronic medical records. Sci Rep. 2017;7:1–11.
- Ningyuan S. Construction of scientific knowledge graph for intelligent data – taking SciGraph as an example. Sci Technol Publ. 2017:17–19.
- Tong R, Mengjie W, Hanfen W, et al. Construction and application of vertical knowledge graph. Knowledge Management BBS. 2016;1:226–234.
- Merlotti C, Ceriani V, Morabito A, et al. Bariatric surgery and diabetic retinopathy: a systematic review and meta-analysis of controlled clinical studies. Obes Rev. 2017;18:309–316.
- Fu Y, Geng D, Liu H, et al. Myopia and/or longer axial length are protective against diabetic retinopathy: a meta-analysis. Acta Ophthalmol. 2016;94:346–352.
- Shi R, Zhao L, Wang F, et al. Effects of lipid-lowering agents on diabetic retinopathy: a meta-analysis and systematic review. Int J Ophthalmol. 2018;11:287–295.
- Zhang X, Zhao J, Zhao T, et al. Effects of intensive glycemic control in ocular complications in patients with type 2 diabetes: a meta-analysis of randomized clinical trials. Endocrine. 2015;49:78–89.
- Qiu L. Meta analysis of risk factors for type 2 diabetic retinopathy. Hebei Medical University; 2007.
- Liu XY. Research on logistic regression model based on meta-analysis of complication risk of type II diabetes. Third Military Medical University; 2016.
- Cai X, Chen Y, Yang W, et al. The association of smoking and risk of diabetic retinopathy in patients with type 1 and type 2 diabetes: a meta-analysis. Endocrine. 2018;62:299–306.
- Abariga SA, Whitcomb BW. Periodontitis and gestational diabetes mellitus: a systematic review and meta-analysis of observational studies. BMC Pregnancy Childbirth. 2016;16:344.
- Clarke PM, Gray AM, Briggs A, et al.; UK Prospective Diabetes Study (UKDPS) Group. A model to estimate the lifetime health outcomes of patients with type 2 diabetes: the United Kingdom Prospective Diabetes Study (UKPDS) Outcomes Model (UKPDS no. 68). Diabetologia. 2004;47:1747–1759.
- Huang B. Study on artificial neural network diagnostic model of serum protein spectrum of type 2 diabetic nephropathy. Lab Med Clinic. 2013;10:1686–1689.
- Wang ZS, Song ZC, Bai JH. Decision tree analysis of renal disease risk in patients with type 2 diabetes. Chin J Integr Med. 2013;14:238–239.
- Cao WZ, Ying J, Chen GF. Prediction and comparative study of risk of type 2 diabetes with retinopathy based on logistic regression and random forest algorithm. Chin Med Equip. 2016;31:33–38.
- Makino M, Yoshimoto R, Ono M, et al. Artificial intelligence predicts the progression of diabetic kidney disease using big data machine learning. Sci Rep. 2019;9:11862.
- Thomas PB, Robertson DH, Chawla NV. Predicting onset of complications from diabetes: a graph based approach. Appl Netw Sci. 2018;3:48.
- Jin ZN, Zhang ZY, Ma JQ. Prediction of multi-factor stroke risk based on meta-analysis. Comput Knowl Technol. 2019;015:240–242.
- Ni YY, Ye ZH. Meta-analysis of risk factors for stroke in patients with type 2 diabetes in Chinese population. Nurs Rehabil. 2016;15:1026–1033.
- Zhang J, Yu KF. What's the relative risk? A method of correcting the odds ratio in cohort studies of common outcomes. JAMA. 1998;280:1690–1691.
- Wang ES. Estimation of relative risk of case-control study. China Health Stat. 1989;6:22–26.