
Abstract
X-Atlas™ is a new imaging technology intended to advance the state of the art in patient-specific instrumentation. It uses standard AP and lateral radiographs instead of CT or MRI scans to create 3D bone models, which can be used to perform pre-operative surgical planning and fabricate TKA personalized guides. The aim of this study was to validate X-Atlas™ and evaluate the accuracy of personalized guides created with this imaging technology. Its ability to predict implant size was also determined. The accuracy of the X-Atlas™ imaging technology was evaluated by comparing the landmarks of X-Atlas™ 3D Bone models to MRI-reconstructed bone models. The accuracy of PSI guides created with X-Atlas™ (X-PSI™ guides) was evaluated during a validation study (16 specimen knees) and a clinical study (50 patients; Health Canada #CSU2015-12K). Optical navigation was used to measure positioning accuracy. In addition, the ability of X-Atlas™ to predict implant size was assessed. The accuracy of the X-Atlas™ imaging technology was below 0.87 and 1.28 mm for the femoral and tibial landmarks, respectively. The accuracy of X-PSI™ guides to reproduce the pre-operative planned HKA was within ± 3° in 100% and 86.1% of cases, for the laboratory and clinical study respectively, which was significantly better than historical data for conventional instrumentation. X-Atlas™ was able to predict implant size to ± 1 size in 95.6% and 100%, for the femur and tibia component respectively. The X-Atlas™ imaging technology demonstrated excellent accuracy for reconstructing a 3D bone model. The results show that PSI guides created with X-Atlas™ (X-PSI™ guides) provide greater implant positioning accuracy than conventional instrumentation, without the requirement of advanced imaging. Furthermore, the X-Atlas™ imaging technology could effectively predict implant sizing, potentially reducing the number of instrument trays and improving surgical efficiency.
Introduction
Improving the accuracy of implant positioning, limb alignment, and component size prediction while improving intra-operative efficiency continues to be an important goal in total knee arthroplasty (TKA). Although good implant survival and functional outcomes in TKA outside of the typical mechanical alignment (>3° in the coronal plane) has been reported [Citation1], this should not result from random deviation from a standard plan. A kinematic alignment strategy, which aims to restore pre-operative kinematics (less ligament strains), might result in an alignment outside of the 3° criteria [Citation2,Citation3]. In the current clinical environment, achieving desired outcomes from TKA is partly contingent upon creating a personalized surgical plan and then accurately reproducing limb alignment and implant positioning while optimizing implant sizing.
One recent advancement uses patient-specific instrumentation (PSI) consisting of personalized single-use positioning guides to perform the femoral and tibial bone resections. The PSI guides provide patients with a surgical procedure that is more personalized to their unique anatomic needs than is typically provided with traditional instrumentation [Citation4].
Currently, creating PSI guides typically requires the use of advanced imaging such as magnetic resonance imaging (MRI) or computed tomography (CT) scans to generate 3D models that can be used to produce a pre-operative surgical plan and to fabricate the PSI guides. Although there are few published clinical studies supporting the use of PSI guides generated from MRI or CT scans, a number of surgeons have adopted the technique because of its accuracy, at least comparable to conventional instrumentation, and time efficiency in the operating room [Citation4–7]. One key barrier to greater acceptance may be the significant added cost and inconvenience of the required advanced imaging and associated reimbursement issues.
An imaging concept exists to address these concerns, which uses standard two-dimensional x-ray images for the reconstruction of 3D bone models, instead of the more costly MRI or CT scans. This concept has previously been applied to the knee [Citation8], the hip [Citation9,Citation10] and the spine [Citation11]. A novel imaging technology using a similar process to perform pre-operative planning and fabricate personalized TKA guides was developed. There are no previous published studies evaluating PSI guides fabricated with this type of technology. This paper presents the validation of this new imaging technology and its ability to predict implant size, as well as the assessment of position accuracy of PSI guides created with this imaging technology.
Materials and methods
X-Atlas™ imaging technology process
The X-Atlas™ process began with acquiring anteroposterior (AP) and lateral x-ray images of the leg in a standing position (weight-bearing), from above the femoral head to below the ankle joint (automatic stitching), according to the image acquisition protocol (Zimmer Biomet 1836.1-GLBL). Markers, with seven radiopaque spheres of different dimensions (Zimmer Biomet, P/N 20-8085-020-00), were placed above and below the knee during the x-ray radiographs to allow calibration and recreation of the acquisition scene according to a proprietary procedure ().
Figure 1. X-Atlas™ Imaging Technology Process. (a) A 3D scene representing the position of the patient relative to the source and image detector during x-ray acquisition is created. (b) The patient’s specific bony landmarks are defined on the AP and lateral images (e.g. femoral head). (c) The patient’s femoral and tibial bone contours are outlined on the AP and lateral images, which capture unique features of the patient’s bony anatomy. (d) A mean bone model for the femur and tibia is positioned and scaled in the 3D scene inside the patient-specific contours. (e) An automatic bone deformation is performed to match the 3D mean bone model to the patient-specific contours to fit the patient’s anatomy. (f) An estimated cartilage thickness is calculated (half distance between bones on a weight-bearing AP x-ray) and applied to the femoral and tibial bones. Dotted line: Patient’s bone contour; Solid line: Projected mean bone contour; Dashed line: Deformed bone contour; Black area (distal end of bones): Added cartilage.
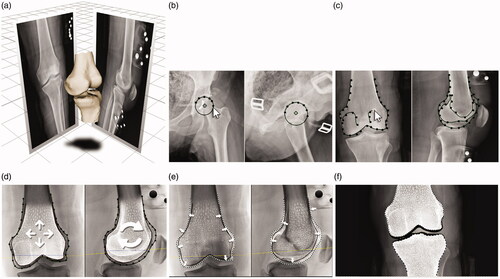
Upon reception of the x-ray images, they were triaged for quality and compatibility with the X-Atlas™ application. Trained operators proceeded to define patient’s specific landmarks in AP and lateral views (). Then, the bone contours visible on the x-rays were segmented using the X-Ray Reconstruction application (both views), which captured unique features of the patient’s bony anatomy (). A mean bone model for the femur and tibia was positioned and scaled in the 3D scene inside the patient-specific contours (). The mean bone model is a gender- and laterality-specific model created with CT images of a library of healthy knees. An automatic bone deformation using a proprietary algorithm was performed to match the 3D mean bone model to the patient-specific contours created using the x-rays in order to fit the patient’s anatomy (). Finally, an estimated cartilage thickness was applied to the femoral and tibial bones (). The cartilage thickness added to each bone is determined on the medial and lateral side separately using the same weight-bearing AP x-ray required for X-Atlas™. It is calculated as half the distance between the bone surfaces between the most distal point of the condyle and the adjacent tibial plateau.
Pre-operative surgical planning and manufacturing of X-PSI™ guides
X-PSI™ (Zimmer Biomet, Warsaw, Indiana, USA) are PSI guides created with the X-Atlas™ imaging technology. A trained operator (manufacturer employee) used the X-PSI™ Knee Surgical Planning software application to plan the location and orientation of implant components on the patient’s bone models. Briefly, the femoral/tibial implants were set according to the surgeon’s preferences and in line with the manufacturers associated implant brands (NexGen®, Persona® and Vanguard®). For the femur, the distal resection levels, flexion angle, internal/external rotation angle and varus/valgus angle were set according to the surgeon’s preferences (or surgical technique if not specified). The posterior resection values were then set according to the chosen implants. Implant size was changed if needed making sure there were no anterior notching, and then medio-lateral position was set. For the tibia, the proximal resection levels, posterior slope, internal/external rotation angle and varus/valgus angle were set according to the surgeon’s preferences (or surgical technique if not specified). Then, the antero-posterior and medio-lateral positions were adjusted while avoiding overhang. The planning was verified by a second trained operator and sent to the surgeon for review, edit, and approval.
From these virtual positioning guide models, once approved by the surgeon, the actual X-PSI™ guides were produced from a polymer composite powder (DuraForm® PA) using Selective Laser Sintering. Bone models were also produced and provided to the surgeons. They were used to allow the surgeon to visualize the morphology of the patient’s distal femur and proximal tibia as well as the location of the X-PSI™ guide’s contact surfaces prior to surgery. Additional information is included on the bone model such as the resection line and the location of the bony landmarks. There is a minimum of 20 business days required for an X-PSI™ case between the receipt of the radiographs and the delivery of completed guides for surgery.
Accuracy of the X-Atlas™ 3D bone model
Three dimensional bone models of the cadaveric knees of the laboratory validation study were generated using X-Atlas™ imaging technology and MRI (ground truth). The two bone models were rigidly co-registered using conventional iterative closest point (ICP) over all vertices. The accuracy of landmark points was determined as the mean absolute error (MAE) between the X-Atlas™ 3D bone model landmarks and MRI-reconstructed bone model landmarks (average of 16 specimens). Leg alignment (hip-knee-ankle angle; HKA) in the coronal plane was determined by using the femoral head center and the femur mechanical axis entry point for the femoral mechanical axis, and the ankle center point and the tibia mechanical axis entry point for the tibial mechanical axis. The accuracy of HKA was determined as the MAE between both imaging modalities.
Laboratory validation study
A laboratory validation study was conducted to evaluate the positioning accuracy of X-PSI™ personalized guides (PSI guides created with the X-Atlas™ technology) on cadaver specimens. X-ray radiographs of 16 specimen legs were acquired at a consistent distance (source-to-image distance) of 180 cm with specimens in a harness in a standing position. The X-Atlas™ process was followed to generate a 3D digital reconstruction of the femur and tibia, then a pre-operative plan was created and X-PSI™ femoral and tibial positioning guides were fabricated. The same knees were scanned using MRI to evaluate the accuracy of the X-Atlas™ 3D Bone Model.
The joint was exposed and the knee was placed into flexion with its position secured. Eight surgeons performed the following guide positioning and measurement procedure on two knees each:
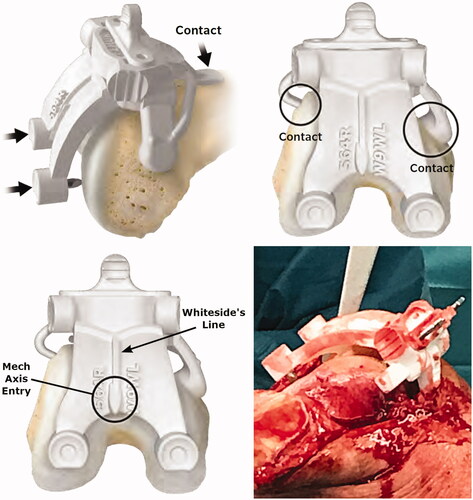
The X-PSI™ femoral guide was positioned according to the surgical technique (X-PSI™ Knee System, Zimmer Biomet 1419.1-GLBL). Unlike MRI-based PSI systems, the X-PSI™ femoral guide does not sit on cartilage ().
Figure 2. Placement of the X-PSI™ femoral guide. The X-PSI™ femoral guide was placed on the distal femur by first positioning the anterior tab on the anterior cortex and locking on the anterior part using the medial and lateral tabs. The metallic blades aligning with the distal condyles were then pushed by hand through the cartilage until they contacted the cortical bone. The guide position was confirmed using marks on the guide indicating the mechanical axis entry point and Whiteside’s line (bottom left image). Because the cut guide sits on specific contact points (unlike MRI-based PSI systems), the surrounding soft tissues do not interfere with the installation and positioning of the femoral guide (bottom right image).
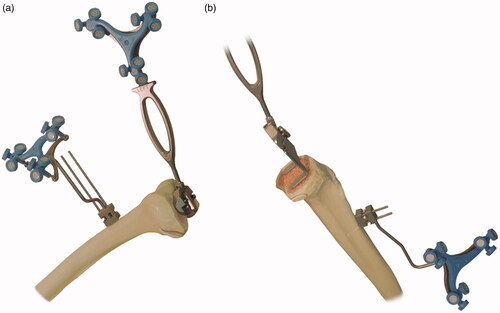
The bone resection was performed and the varus/valgus angle was acquired using the optical navigation system ().
Figure 3. Measurement of positioning accuracy. (a) For the distal femoral resection, the validation tool without the condyle digitizer is applied to the resected surface to acquire the angle; (b) For the proximal tibial resection, the validation tool with the condyle digitizer is applied to the resected surface to acquire the angle.
The values were noted in the data collection form, and the femoral guide was removed.
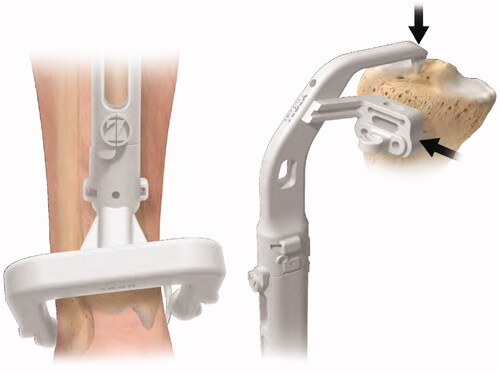
The X-PSI™ tibial guide was positioned according to the surgical technique ().
Figure 4. Placement of the X-PSI™ tibial guide. The X-PSI™ tibial guide’s patient specific ankle clamp was placed around the patient’s malleoli. Then, the pointer at the proximal end of the guide was placed on the tibia’s mechanical axis entry point, making sure the guide contacted the anterior surface of the tibia. The tibial guide was aligned in the axial plane with the medial third of the tuberosity and posterior cruciate ligament (PCL) insertion.
The bone resection was performed and the varus/valgus angle was acquired using the optical navigation system ().
The values were noted in the data collection form, and the tibial guide was removed.
Surgeon feedback was collected immediately after they completed the TKA procedure on the specimen knees using an in-house 7-page form with questions on guide design (e.g. compatibility with incision, blades to pierce cartilage), features (e.g. markings to guide placement) and positioning of the guide (e.g. unique fit, fit at each point of contact, stability, removal).
Measurement of positioning accuracy
During the validation and clinical studies, the positioning accuracy was measured intra-operatively using a validated optical navigation system (Sesamoid® Plasty V2 with software ORTHOsoft® Knee 2.3 Universal, Zimmer CAS, Canada). Prior to performing the TKA, bone references were installed on the femur and tibia and the landmarking points of the optical navigation system were acquired. A handheld validation tool was used to record alignment in the coronal and/or sagittal planes. The positioning accuracy of X-PSI™ guides was determined by comparing the intra-operative optical navigation values to the pre-operative planning values produced via the X-Atlas™ process and the X-PSI™ Knee Surgical Planning software. The accuracy of HKA was determined by comparing the calculated HKA (measured femur V/V + measured tibia V/V) to the planned HKA.
Clinical study
This IRB-approved study was a multi-center, prospective, case series, non-controlled clinical trial. The hypothesis was that X-PSI™ guides (PSI guides created using the X-Atlas™ imaging technology) would result in alignment that is as accurate as conventional instrumentation. The study also tested the hypothesis that the 3D bone models created with X-Atlas™ will facilitate prediction of implant sizing.
The inclusion criteria were based on the indications and contraindications for the implant system used. Out of 60 primary TKA patients initially enrolled at two clinical sites, ten were excluded: canceled operations (4), timing issues (1), did not have the operation when data was analyzed (2), administrative issues (1), and image triage rejection (2). The remaining patient population is described in . All patients were diagnosed with non-inflammatory degenerative joint disease, had a varus/valgus deformity or flexion contracture of 15° or less, and had functional collateral ligaments. Informed consent in accordance with current ethical board regulatory requirements was obtained from all patients.
Table 1. Patient demographics.
All patients received a Persona® knee implant (Zimmer Biomet, Warsaw, Indiana, USA) in compliance with the labeling of the product and in accordance with the surgical technique. All operations were performed by the two authors, highly experienced in performing TKAs, and trained in the use of X-PSI™ guides (PSI guides created with X-Atlas™ imaging technology). The same protocol was followed at both centers (no deviations).
The primary endpoint was to measure the guide position in the coronal and sagittal planes with optical navigation. In this study, the X-PSI™ guides were not intended to be used alone for final positioning of the cut guides. Thus, once the measurements were obtained using the optical navigation system, depending on surgeon preference, the TKA procedure was completed using MRI-based PSI guides, conventional instrumentation, or the readings from the navigation system.
The X-Atlas™ process was followed for all patients to generate a 3D digital reconstruction of the femur and tibia, then a pre-operative plan was created and X-PSI™ femoral and tibial positioning guides were fabricated. Prior to making the bone resection, the X-PSI™ guide (femur or tibia) was placed as previously described (same as for validation study), and pinned using two 3.2 mm pins. The optical navigation system was used to record the position of the cut guide by placing the paddles of the validation tool in the cut slot. Then, the bone cut was made according to surgeon’s preferred technique. The standard Persona® surgical technique was then followed to complete the operation.
Statistical analysis
Data was analyzed using Minitab® software. The distribution of the data was analyzed using the Anderson-Darling normality test. For the laboratory validation study, the acceptance criteria was non-inferiority to the 70% historical success rate of conventional instrumentation for HKA (± 3° in 70% of cases) [Citation12], using a non-inferiority margin of 5%. For the clinical study, the objective of the primary efficacy analysis was to demonstrate that the success rate of the X-PSI™ Knee System is non-inferior to conventional instrumentation for the following parameters (% of cases within ± 3°): HKA = 70%, Femur varus/valgus (V/V) and flexion/extension (F/E)=83.6% and 65.7%, Tibia V/V and F/E = 87.6% and 74.6%) [Citation12]. In case of non-inferiority (margin of 5%), a superiority test was also performed to determine if the system was better than the historical success rates.
Results
The accuracy of the femoral landmark points of the X-Atlas™ 3D bone model was below 0.87 mm, with a range from 0.41 to 0.87 mm depending on the landmark point (). The tibial landmark points all had an accuracy below 1.28 mm, with a range from 0.80 to 1.28 mm. The accuracy of X-Atlas™ for leg alignment (HKA) was 1.04° with a standard deviation of 0.56°.
Table 2. Accuracy of X-Atlas™ imaging technology.
Laboratory validation study
The accuracy for HKA was within ± 3° in 100% of the cases, and within ± 2° in 93.8% of the cases (), which met the acceptance criteria to be non-inferior to the 70% historical success rate of conventional instrumentation for HKA (± 3° in 70% of cases; p < 0.05) [Citation12].
Table 3. Accuracy to plan of the laboratory validation study.
Surgeon feedback has showed that all participating surgeons believed that the X-PSI™ guides could be used on all ranges of bone anatomy issues that may indicate TKA, including congenital deformities, traumatic bone fracture, severe osteophytes, severe osteoarthritis, bone-on-bone contact, and bone attrition/deformity. Furthermore, all responded that X-PSI™ guides provided a unique, easily discernible fit and orientation for every given specimen.
Clinical study
There were no adverse events recorded during the study. The data was normally distributed. The accuracy of X-PSI™ to reproduce the plan within ± 3° was significantly improved for all parameters (superiority test, p < 0.05) compared to the historical success rates of conventional instrumentation (), except for Femur F/E which was almost significant (p = 0.052). For HKA, it is interesting to note that for the same success rate as conventional instrumentation (70%), X-PSI™ is more precise to ± 2° (72.1%) instead of ± 3°.
Table 4. Accuracy to plan of the clinical study.
As for the ability of the X-Atlas™ imaging technology to predict implant size, the femoral component implanted was within ± 1 size in 95.6% (43/45) of cases, with 53.3% (24/45) exactly as planned (Min/Max: −1/+2). In two cases (4.4%), the variation was ± 2 sizes. The tibial component implanted was within ± 1 size in 100% (45/45) of cases, with 57.8% (26/45) as planned (Min/Max: −1/+1).
Discussion
Worldwide, surgeons have a significant interest in PSI technology if it can be shown to improve alignment accuracy and surgical efficiency [Citation13]. In our study, we reported early results with a new technology using standard radiographs (X-AtlasTM imaging technology) that address one of the major barriers that hinder greater acceptance of traditional PSI: the need of a CT scan or MRI.
A review paper comparing PSI techniques to conventional instrumentation has concluded that the ‘majority of studies did not show an improvement in overall limb alignment’ [Citation14]. However, a number of studies did show favorable results for PSI techniques compared to traditional instrumentation [Citation15–20], including one study that has showed PSI results to be comparable to computer navigation [Citation21]. In another study involving 32 knees, Bali et al. found that the use of PSI guides created from CT or MRI scans led to alignment that met the ± 3° standard for HKA in 90.6% (29/32) of patients [Citation6]. However, Nunley et al. has reported no difference in alignment accuracy between TKAs using a PSI technique and those using conventional instrumentation [Citation4].
The results demonstrated that the bone models generated with the X-Atlas™ imaging technology had an accuracy below 0.87 mm and 1.28 mm, for the femur and tibia landmarks respectively, and 1.04° for HKA compared to the MRI-generated models (ground truth). A clinical validation of a similar technology reported comparable accuracy for the tibia with an average surface distance (ASD) of 1.2 mm compared to the CT-generated bone model (ground truth), and slightly inferior accuracy for the femur (1.4 mm), although the accuracy was not computed in the same manner [Citation8]. They also found similar results for the ability to predict implant size within ± 1 size with 95.7% and 100% for the femur and tibia respectively, but they were able to predict the correct size in 78% and 70% of cases, respectively [Citation8]. In terms of ease of use, the X-Atlas™ imaging technology has a smaller calibration device and does not require a knee immobilization device upon acquisition of the radiographs. In addition, the radiograph acquisition protocol can be performed in most radiology center equipped with a tilting source.
Furthermore, the data suggested that X-PSI™ has benefits comparable to those achieved with traditional PSI techniques using CT or MRI scans that have an overall HKA value within ± 3̊° in 90.6% of cases [Citation6], only slightly better than the 86.1% achieved in this study. The accepted standard for alignment in TKA is an overall HKA value within ± 3° of the mechanical axis [Citation12]. In conventional operations, this standard was met in approximately 70% of cases. In this study, the difference between the measured HKA value and the planned value was within ± 3° in 100% and 86.1% of the cases, for the laboratory and clinical study respectively. Thus, the position accuracy of femoral and tibial cutting guides can be enhanced with X-PSI™ technology (PSI guides created with the X-Atlas™ imaging technology) when compared to conventional instrumentation.
A number of potential clinical efficiencies are possible with the X-Atlas™ imaging technology. It is expected that the cost savings achieved by substituting CT or MRI images for standard x-ray imaging will be significant. In addition, it was shown that leg alignment differs significantly depending if it is evaluated in a supine or standing weight-bearing position [Citation22,Citation23]. Therefore, evaluating pre-operative leg alignment in a standing position as with the X-Atlas™ imaging technology would give the functional alignment, allowing better planning of the bone resections. In terms of radiation, the x-ray effective dose on one knee could be 12 times less compared to CT [Citation24]. Moreover, the ability to predict implant sizes can potentially reduce the number of instrument trays, reducing costs and improving surgical efficiency. Additionally, the ability to preplan the surgical procedure and subsequent use of patient-specific guides may result in intra-operative efficiencies that may ultimately improve clinical outcomes, for example, by obviating the violation of the femoral canal, reducing anesthesia time, etc.
While encouraging results are presented, the authors recognize that this study involves a small population and may represent only the potential benefits of this technology. Moreover, like any PSI technology, the knee balance is not taken into account in the intra-operative planning. Another limitation is that the clinical study did not directly address patient outcomes. Additional prospective studies are necessary to better evaluate the benefits. On the other hand, this is the first study to be published on the use of x-ray images with PSI technology. This new X-Atlas™ imaging technology brings an important alternative to standard PSI protocols that may achieve the improved efficiency sought by surgeons who currently use PSI technology, without the burden and cost of 3D imaging.
Conclusion
The X-Atlas™ imaging technology proved to be accurate to reconstruct a 3D bone model and results have shown that it might provide benefits to surgeons seeking improved planning and precision without the problems of obtaining 3D imaging. The findings suggested that X-Atlas™ imaging technology when used to create PSI guides (X-PSI™ guides) results in improved accuracy in limb alignment and implant positioning compared to conventional instrumentation. In addition, the X-Atlas™ imaging technology evaluates the functional alignment in a standing position allowing better planning of bone resections. Furthermore, the X-Atlas™ bone models and pre-operative plan could effectively predict implant sizing, potentially reducing the number of instrument trays and improving surgical efficiency. As the adopting surgeon cohort continues to assess PSI techniques, the introduction of X-PSI™ (PSI guides created with X-Atlas™ imaging technology) is expected to further increase the acceptance of these protocols by offering an alternative that is comparable in precision but more cost effective. Greater acceptance may also spark more research studies centered on the overall PSI concept.
Ethical approval
All procedures performed in studies involving human participants were in accordance with the ethical standards of the institutional and national research committee (IRB Maisonneuve-Rosemont Hospital #15004; IRB NorthShore University HealthSystem #EH15-261; Health Canada #CSU2015-12K) and with the 1964 Helsinki declaration and its later amendments or comparable ethical standards.
Informed consent
Informed consent was obtained from all individual participants included in the study.
Disclosure statement
Dr. Vincent Massé and Dr. Raju S. Ghate are paid consultants for Zimmer Biomet.
Additional information
Funding
References
- Khatib Y, Xia A, Naylor JM, et al. Different targets of mechanical alignment do not improve knee outcomes after TKA. Knee. 2019;26(6):1395–1402.
- Theodore W, Twiggs J, Kolos E, et al. Variability in static alignment and kinematics for kinematically aligned TKA. Knee. 2017;24(4):733–744.
- Delport H, Labey L, Innocenti B, et al. Restoration of constitutional alignment in TKA leads to more physiological strains in the collateral ligaments. Knee Surg Sports Traumatol Arthrosc. 2015;23(8):2159–2169.
- Nunley RM, Ellison BS, Zhu J, et al. Do patient-specific guides improve coronal alignment in total knee arthroplasty? Clin Orthop Relat Res. 2012;470(3):895–902.
- Vide J, Freitas TP, Ramos A, et al. Patient-specific instrumentation in total knee arthroplasty: simpler, faster and more accurate than standard instrumentation-a randomized controlled trial. Knee Surg Sports Traumatol Arthrosc. 2017;25(8):2616–2621.
- Bali K, Walker P, Bruce W. Custom-fit total knee arthroplasty: our initial experience in 32 knees. J Arthroplasty. 2012;27(6):1149–1154.
- Watters TS, Mather RC, 3rd, Browne JA, et al. Analysis of procedure-related costs and proposed benefits of using patient-specific approach in total knee arthroplasty. J Surg Orthop Adv. 2011;20(2):112–116.
- Zheng G, Hommel H, Akcoltekin A, et al. A novel technology for 3D knee prosthesis planning and treatment evaluation using 2D X-ray radiographs: a clinical evaluation. Int J Comput Assist Radiol Surg. 2018;13(8):1151–1158.
- Knafo Y, Houfani F, Zaharia B, et al. Value of 3D preoperative planning for primary total hip arthroplasty based on biplanar weightbearing radiographs. Biomed Res Int. 2019;2019:1932191.
- Yu W, Chu C, Tannast M, et al. Fully automatic reconstruction of personalized 3D volumes of the proximal femur from 2D X-ray images. Int J Comput Assist Radiol Surg. 2016;11(9):1673–1685.
- Kadoury S, Cheriet F, Dansereau J, et al. Three-dimensional reconstruction of the scoliotic spine and pelvis from uncalibrated biplanar x-ray images. J Spinal Disord Tech. 2007;20(2):160–167.
- Hetaimish BM, Khan MM, Simunovic N, et al. Meta-analysis of navigation vs conventional total knee arthroplasty. J Arthroplasty. 2012;27(6):1177–1182.
- Thienpont E, Bellemans J, Delport H, et al. Patient-specific instruments: industry’s innovation with a surgeon’s interest. Knee Surg Sports Traumatol Arthrosc. 2013;21(10):2227–2233.
- Hafez MA, Moholkar K. Patient-specific instruments: advantages and pitfalls. Sicot J. 2017;3:66.
- Daniilidis K, Tibesku CO. A comparison of conventional and patient-specific instruments in total knee arthroplasty. Int Orthop. 2014;38(3):503–508.
- Helmy N, Dao Trong ML, Kühnel SP. Accuracy of patient specific cutting blocks in total knee arthroplasty. Biomed Res Int. 2014;2014:562919.
- Howell SM, Kuznik K, Hull ML, et al. Results of an initial experience with custom-fit positioning total knee arthroplasty in a series of 48 patients. Orthopedics. 2008;31(9):857–863.
- Ng VY, DeClaire JH, Berend KR, et al. Improved accuracy of alignment with patient-specific positioning guides compared with manual instrumentation in TKA. Clin Orthop Relat Res. 2012;470(1):99–107.
- Ferrara F, Cipriani A, Magarelli N, et al. Implant positioning in TKA: comparison between conventional and patient-specific instrumentation. Orthopedics. 2015;38(4):e271–e280.
- Boonen B, Schotanus MG, Kort NP. Preliminary experience with the patient-specific templating total knee arthroplasty. Acta Orthop. 2012;83(4):387–393.
- Brown C, Campton L, Bucknill A. Accuracy of implant position and cost-effectiveness of MRI-based patient specific positioning system compared to computer navigation in knee arthroplasty. J Bone Joint Surg Br. 2018;94-B:100.
- Fujii T, Sato T, Ariumi A, et al. A comparative study of weight-bearing and non-weight-bearing 3-dimensional lower extremity alignment in knee osteoarthritis. J Orthop Sci. 2020;25(5):874–879.
- Winter A, Ferguson K, Syme B, et al. Pre-operative analysis of lower limb coronal alignment – a comparison of supine MRI versus standing full-length alignment radiographs. Knee. 2014;21(6):1084–1087.
- Koivisto J, Kiljunen T, Wolff J, et al. Assessment of effective radiation dose of an extremity CBCT, MSCT and conventional X ray for knee area using MOSFET dosemeters. Radiat Prot Dosimetry. 2013;157(4):515–524.