
 ?Mathematical formulae have been encoded as MathML and are displayed in this HTML version using MathJax in order to improve their display. Uncheck the box to turn MathJax off. This feature requires Javascript. Click on a formula to zoom.
Abstract
Objectives
In vitro fenestration of stent-graft (IVFS) demands high-precision navigation methods to achieve optimal surgical outcomes. This study aims to propose an augmented reality (AR) navigation method for IVFS, which can provide in situ overlay display to locate fenestration positions.
Methods
We propose an AR navigation method to assist doctors in performing IVFS. A deep learning-based aorta segmentation algorithm is used to achieve automatic and rapid aorta segmentation. The Vuforia-based virtual-real registration and marker recognition algorithm are integrated to ensure accurate in situ AR image.
Results
The proposed method can provide three-dimensional in situ AR image, and the fiducial registration error after virtual-real registration is 2.070 mm. The aorta segmentation experiment obtains dice similarity coefficient of 91.12% and Hausdorff distance of 2.59, better than conventional algorithms before improvement.
Conclusions
The proposed method can intuitively and accurately locate fenestration positions, and therefore can assist doctors in performing IVFS.
1. Introduction
Aortic diseases such as aortic aneurysms and aortic dissections seriously endanger life and health of patients. As an alternative to traditional open surgery, endovascular aneurysm repair (EVAR) is a surgical treatment for aortic diseases aimed at reducing perioperative morbidity or mortality rates [Citation1, Citation2]. When performing EVAR without use of specially designed aortic stent-grafts, it is necessary to cover aorta with a stent-graft and perform concurrent branch artery reconstruction to restore blood flow. Stent fenestration is a common blood flow reconstruction technique in EVAR, usually including in situ fenestration and in vitro fenestration. In situ fenestration is performed at the surgical site after stent implantation under the guidance of real-time digital subtraction angiography (DSA) images, while in vitro fenestration is performed before implantation.
In situ fenestration may cause additional radiation exposure, hand-eye coordination problems due to digital subtraction angiography (DSA) screen far away from surgical site, and lack of depth information in DSA images. Compared to in situ fenestration, in vitro fenestration techniques have lower risks. Currently, clinical practice for in vitro fenestration of stent-graft (IVFS) often involves preoperative planning or three dimension (3D) printing technique, but fenestration accuracy and preoperative preparation simplicity always cannot be satisfied simultaneously for both methods [Citation3].
Augmented Reality (AR) is a promising surgical navigation technology for IVFS. In general AR surgical navigation systems, 3D anatomical images are spatially registered and overlaid onto surgical site, which allows doctors to see in situ AR images and perform surgery more safely, reliably, and effectively. Chen et al. obtained fusion images of virtual anatomical models and surgical sites of oral and pelvic cavity during operation with head-mounted display (HMD) [Citation4]. By installing optical markers on patients, projectors, and optical tracking devices, Chan et al. realized virtual-real overlay display of medical images and experimental mice [Citation5]. Liao et al. applied the in situ AR perspective navigation system to the oral and maxillofacial surgery [Citation6], and the reported average position error and positioning time were significantly better than the traditional navigation system. Various AR 3D display methods have been studied in the field of AR surgical navigation systems. These display methods include HMD [Citation4, Citation7], mobile devices such as smartphones or tablets [Citation8, Citation9], projector display [Citation5, Citation10], and integral photography display with half-silvered mirror [Citation6, Citation11–13], and have been applied to oral and maxillofacial surgery, orthopaedics surgery, spinal surgery, breast tumour ablation surgery and craniosynostosis surgery. In these AR display methods, mobile devices have issues with inconvenient surgical operation and positioning accuracy. In addition, the small screen size of smartphones limits their clinical application scenarios. AR surgical navigation systems based on projector displays and integral imaging displays have complex structures and high setup costs. Although HMDs have additional weight, they can ensure navigation accuracy and minimize setup cost of navigation system, suitable for areas with relatively limited medical resources.
3D images used in AR surgical navigation systems are sourced from computed tomography angiography (CTA), magnetic resonance imaging (MRI) and others. Image segmentation techniques are utilized to segment target regions from medical images. The segmented masks are then reconstructed into 3D models to provide data sources for surgical navigation systems. Deep learning has shown significant advantages in medical image segmentation [Citation14–17]. Combination of deep learning segmentation algorithms with aortic disease has become a research hotspot recently. Deep learning segmentation algorithms have been applied to aorta segmentation [Citation18–20], aortic aneurysm evaluation [Citation21–25], aortic dissection detection [Citation26–29]. In 2022, Sieren et al. used an improved 3D U-Net model to segment normal and diseased aortas [Citation18]. The research shows that improved algorithm can accurately quantify aortic lumen even if vascular architecture is altered by diseases.
In this study, we propose an AR navigation method for IVFS based on AR 3D display technology to accurately locate fenestration positions. CTA data of patients is automatically segmented to obtain aortic segmentation models using deep learning algorithm. An in-situ AR image is displayed through Microsoft mixed reality glasses, HoloLens. The in-situ AR image projected into real space is registered with a stent-graft by virtual-real registration technology, allowing doctors to intuitively and visually locate fenestration positions, and accurately guiding them in performing IVFS.
The main contributions of this study are as follows:
We propose an AR navigation method to assist doctors in performing IVFS. The proposed method combines deep learning segmentation algorithms with Vuforia-based virtual-real registration to accurately locate stent fenestration positions.
We study an automatic aorta segmentation algorithm based on AARU-Net and evaluate the segmentation results, with a dice similarity coefficient (DSC) of 91.12%. It can meet the requirements of AR navigation for IVFS.
We conduct a simple AR navigation simulation experiment of IVFS, achieve virtual-real registration of 3D images and real stent-graft, and verify the feasibility of the proposed AR navigation method.
2. Materials and methods
2.1. Overall framework of AR navigation method
We propose an AR navigation method for IVFS, and the overall research framework is shown in . The proposed method mainly consists of two parts. The first part is automatic aorta segmentation. Deep learning-based automatic segmentation algorithm is used to segment aorta from CTA images. The CTA data collected from hospital is labelled by 3D Slicer. The labelled ground truth and original images are preprocessed and fed into an improved network ASPP-Attention-Res U-Net (AARU-Net) for training. Network parameters are adjusted according to predicted results of validation set, and suitable optimization algorithm and improved loss function are selected to make the network obtain better training effect. In testing phase, the optimal model is selected to predict testing sets to achieve automatic aorta segmentation.
Figure 1. The overall framework of the proposed AR navigation method. The complete experimental process mainly includes: Collect and filter data; label data by using 3D Slicer and divide the dataset; train the network by using the training and validation dataset; test and 3D reconstructed; AR 3D display by using Vuforia, Unity, Visual Studio 2017 and HoloLens.
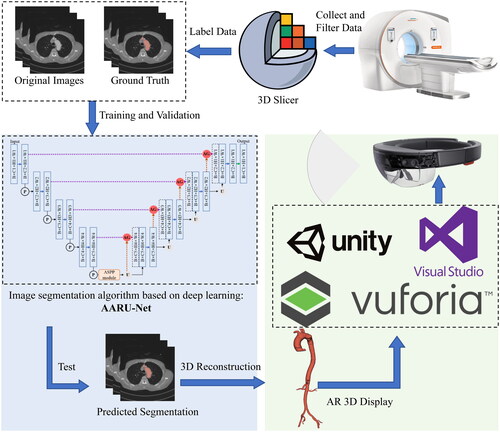
The second part is AR overlay display. The AR image is deployed remotely to HoloLens through Unity 3D development platform (Unity 2019.4.40f1c1) and Visual Studio 2017. The 3D virtual image is registered with the stent-graft using Vuforia-based virtual-real registration technology. Vuforia is an open-source AR software development platform developed by PTC, and Vuforia 8.5.9 was adopted in this study. Depth camera (Intel RealSense D435i) and marker points recognition algorithm based on HSV colour space model are used to obtain real-time spatial coordinates of marker points, and then calculate distance deviation of marker points to evaluate registration error.
2.2. Automatic aorta segmentation based on deep learning
2.2.1. Aorta segmentation algorithm based on AARU-Net
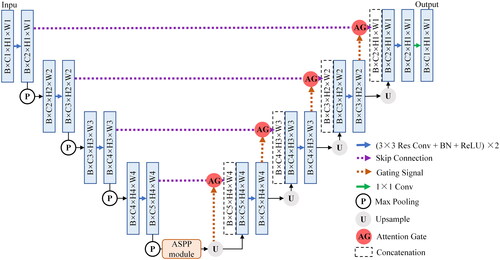
FCN and U-Net have been widely applied in medical image segmentation since proposed. U-Net typically achieves good segmentation results under small sample training conditions. However, there are certain differences among real patient data collected from hospitals in practical applications. The data differences from different disease types are significant, leading to poor training effects of U-Net. Considering that U-Net network is relatively simple and easy to improve on the basic infrastructure, residual learning, attention gate (AG) module, and atrous spatial pyramid pooling (ASPP) module are added to U-Net in this study. The proposed improved network is called AARU-Net, and its overall network structure is shown in . AARU-Net adds batch normalization (BN) layers to U-shaped architecture. Residual modules are used to alleviate training performance degradation caused by the increasing number of network layers. AG modules are added to skip connections to make the network only focus on local features, reduce redundant information extraction, and solve the problem of patient differences in images. Specific operations of AG modules: 1 × 1 convolution and BN, pixel by pixel addition, ReLU, 1 × 1 convolution and BN, Sigmoid activation function, resampling and concat operation. The ASPP module extracts multi-scale context semantic information, effectively enlarging the receptive field. In addition, atrous convolution layers can further restore spatial resolution of feature maps and improve segmentation accuracy. Specific operations of ASPP module: 1 × 1 convolution, three 3 × 3 atrous convolution layers with different dilated rates, image-level feature coding (global averaging pooling), concat operation, and 1 × 1 output convolution.
Figure 2. The overall structure of the improved network AARU-Net. It continues the 2D U-Net network and adds the residual modules, AG modules, and ASPP modules to the baseline. The network input is the original CTA images and the labelled masks, and the output is the predicted segmentation of testing dataset. Blue rectangles represent feature maps of different sizes. Other patterns have been annotated above.
2.2.2. Experimental procedure of aorta segmentation
The improved AARU-Net algorithm is used for aortic segmentation experiment, with the following details. (1) Dataset splitting. To ensure best training effect and as much as possible real and effective testing results, dataset is randomly split into 26 training sets, and 7 testing sets, with 18,465 images in training sets and 5,187 images in testing sets. Additionally, 10% of the training samples are randomly selected as the validation sets. (2) Data preprocessing. The background pixel part of the data is cropped to alleviate class imbalance problem. Then process the data into 2D slices by Python. (3) Training. During training, the input image size is 512 × 512, resampled to 256 × 256, with batch size of 8, initial learning rate of 0.00001, and training is accelerated using GPU. The training is conducted for 70 epochs, with Adam optimizer and weight decay coefficient of 0.001. The loss function is improved using both cross entropy loss and Dice loss, to achieve better training performance. At the start of training, 10% of the training samples are randomly selected as the validation sets, and the learning rate is automatically decayed according to validation results during training process. (4) Testing. The model with the best validation result is used to segment testing sets, and then save the segmentation results for evaluation using selected metrics.
2.2.3. Evaluation metrics of segmentation algorithm
Evaluation metrics are used to evaluate algorithm performance in deep learning research. For image classification, typical evaluation metrics include accuracy, precision, recall, and F1 score, which can be calculated using a confusion matrix. For medical image segmentation based on deep learning, common algorithm evaluation metrics include DSC, intersection over union (IoU), Hausdorff distance (HSD), and their variants, which are expressed as:
(1)
(1)
(2)
(2)
(3)
(3)
In EquationEqs. (1)(1)
(1) and Equation(2)
(2)
(2) , G refers to the manually annotated ground truth, and P refers to the segmentation masks predicted by algorithm. DSC and IoU both represent overlap degree between ground truth and predicted segmentation. In EquationEq. (3)
(3)
(3) ,
and
, where
and
both represent Euclidean distance. HSD represents the maximum distance between two closest points in ground truth and predicted segmentation, and smaller values reflect greater segmentation accuracy.
2.3. AR navigation of in vitro fenestration
2.3.1. Virtual-real registration based on Vuforia
The flow chart of virtual-real registration experiment based on Vuforia is shown in . The experimental process is mainly divided into two parts. The first part is to construct the hardware and software platform related to registration experiment. Firstly, create a new 3D AR project in Unity, and import the Vuforia toolkit to configure AR development environment. Design a high-quality Vuforia image target for registration experiment and upload it to Vuforia database. Image target is a QR code independently designed in this study, used to automatically display the 3D model of aorta after wearing HoloLens. The database and license key obtained from Vuforia website are added to a Unity project. Import 3D virtual models of aorta and stent, and design spatial position relation between the two virtual models and the image target in Unity scene. The virtual stent model is obtained by CT scanning of a real stent-graft. Then export the Universal Windows Platform (UWP) project with specific settings in Unity: select HoloLens for target device, x86 for architecture, D3D Project for build type, 10.0.17763 for target SDK version, 2017 for Visual Studio, and Release for build configuration. Finally use Visual Studio 2017 to remotely deploy the UWP project to HoloLens.
Figure 3. Experimental flowchart of virtual-real registration based on Vuforia. It is divided into two parts: registration platform construction and virtual-real registration experiment.
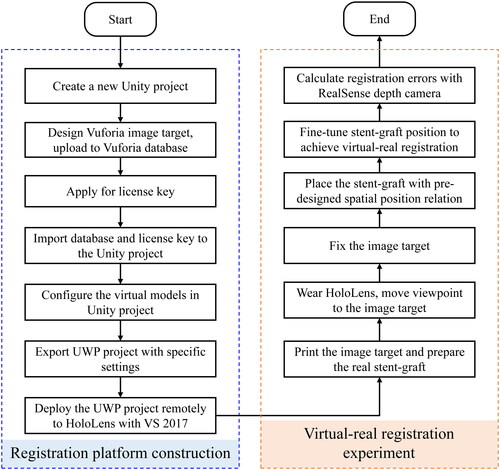
The second part is to perform registration experiment. Print the image target and prepare the real stent-graft. Wear HoloLens and move viewpoint to the image target. The 3D virtual models of aorta and stent-graft will automatically appear above the image target. It is necessary to move head slowly at this stage to ensure that virtual image does not jitter. Fix the image target after the virtual image is stable. Then place the real stent-graft according to pre-designed spatial position relation to achieve virtual-real registration. This process does have errors (including position matching errors, errors inherent in the display of 3D models by HoloLens), so we can manually fine-tune position of the stent-graft to make sure to match as much as possible.
2.3.2. Registration error evaluation method based on marker recognition
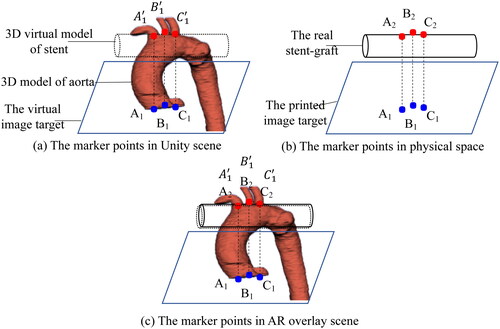
The registration error evaluation depends on marker points recognition. The principle is shown in . Before registration experiment, corresponding marker points are set on the Vuforia image target and the 3D virtual model of aorta. Fix the spatial position relationship between them and record their spatial coordinate transformation matrix, as shown in . Then fix the 3D virtual models of aorta and stent in the Unity scene and make the virtual models overlap as much as possible. At the same time, place the printed image target and real stent-graft according to pre-designed position relationship in physical space, as shown in . During registration, the 3D models of aorta and stent can be viewed above the image target by wearing HoloLens. Fine-tune the image target and the real stent-graft to make them overlap as much as possible. At this time, marker points A2, B2 and C2 are outlined on the stent-graft, as shown in . We use the marker recognition algorithm to obtain spatial coordinates of the marker points on the image target and the stent-graft in real time. And then calculate spatial coordinates of the 3D virtual aortic model corresponding to the printed image target in the physical space by using the previous spatial coordinate transformation matrix. Therefore, the spatial coordinate relationship between the 3D virtual aortic model and the stent-graft in the physical space can be established with the Vuforia image target.
Figure 4. The principle of registration error evaluation based on marker points recognition. (a) The corresponding three marker points on the virtual image target and the 3D model of the aorta in Unity scene. (b) The corresponding three marker points on the printed image target and the stent-graft in physical space. (c) The spatial corresponding relation of marker points after virtual-real registration in AR overlay scene.
A real-time marker points recognition algorithm based on depth camera and HSV colour space model is used to obtain spatial coordinates of marker points of the stent-graft model and the image target. The distance deviation between two spatial coordinates is calculated to evaluate registration error [Citation4]. In AR surgical navigation systems, fiducial registration error (FRE) represents the root mean square value of distance deviation between real and virtual marker points after registration. The calculation formula of FRE is as follows:
(4)
(4)
In EquationEq. (4)(4)
(4) , N refers to the number of manually designed marker points, and
is the spatial distance between two points. In error evaluation, the smaller the FRE, the higher the registration accuracy. If FRE is 0, it indicates a perfect match between virtual and real registration. However, registration errors may occur due to various factors in practical registration experiment. The virtual-real registration results can be manually adjusted to achieve more accurate registration.
3. Results
3.1. Aorta segmentation results
We compare different networks during the improvement process, including the basic U-Net, RU-Net with residual modules added, and the proposed AARU-Net with AG and ASPP modules added, to evaluate segmentation performance of AARU-Net. In contrast to the former, AARU-Net can only focus on local features, extract multi-scale context semantic information, and further improve segmentation accuracy. lists the segmentation results of U-Net, RU-Net and the proposed AARU-Net. The listed segmentation results use the best training parameters, optimization algorithm, and improved loss function, so that different network models can achieve the best performance under current conditions.
Table 1. Results of aorta segmentation in different network models.
The evaluation metrics in include precision, recall, F1 score, DSC, IoU, and HSD, but not accuracy. This is because the number of aortic voxels in CTA data is much smaller than that of background voxels, resulting in negative samples with higher weights in 2D slices. The accuracy of identifying negative samples as negative samples greatly increases the overall accuracy value. Therefore, the accuracy has little effect on evaluating segmentation results. According to the data in , it can be seen that the improved AARU-Net algorithm achieves more accurate aorta segmentation compared with U-Net and RU-Net. For common image segmentation metrics such as DSC, IoU, and HSD, AARU-Net achieves the best DSC and IoU, and the HSD value is very close to that of RU-Net. In addition, AARU-Net achieves the best precision and F1 score, indicating that its strong ability to distinguish between aortic and background voxels.
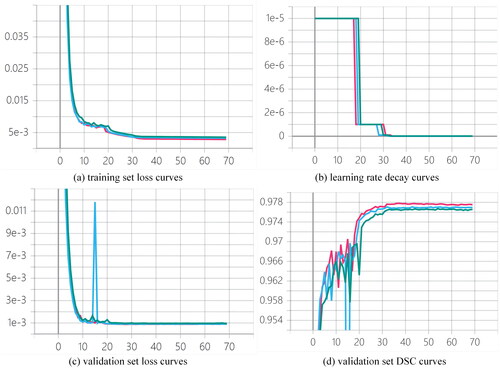
shows the training set loss curves, learning rate decay curves, validation set loss curves, and validation set DSC curves of U-Net, RU-Net, and AARU-Net during the training process. As shown in the figure, although AARU-Net achieves higher loss curves on training and validation sets than U-Net and RU-Net, and its validation DSC score is slightly lower than U-Net and RU-Net, its segmentation performance on testing sets is superior to U-Net and RU-Net, which is proven by . In addition, AARU-Net automatically decays learning rate by a ratio of 0.1 when there is overfitting tendency. Each decay of learning rate can further reduce loss value and improve DSC value. The network gradually converges after about 32 epochs, and then uses the optimal model to segment testing sets after training.
Figure 5. Training curves of (a) training set loss curves, (b) learning rate decay curves, (c) validation set loss curves and (d) validation set DSC curves of three networks during the training process, where green, blue and red represent AARU-Net, RU-Net and U-Net respectively.
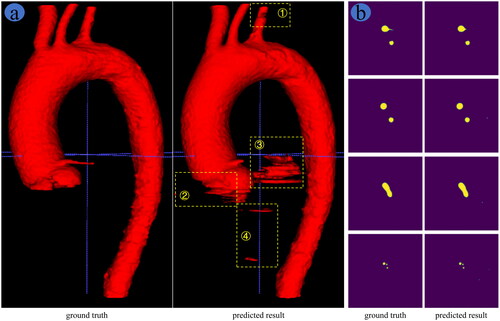
, respectively, show the 3D and 2D display of aorta segmentation results based on AARU-Net algorithm. As shown in , the predicted results have some under-segmentation at positions ① and ②, and obvious over-segmentation at positions ③ and ④ compared to the ground truth. Nevertheless, the overall segmentation effect of AARU-Net is comparatively accurate. The key positions of aortic arch branches are well segmented, as can be seen from slice display results in the fourth row of . The under-segmentation area does not affect AR navigation of IVFS, and the over-segmentation area can be trimmed through post-processing techniques. Therefore, the segmentation results of AARU-Net can meet the requirements of AR navigation of IVFS.
Figure 6. Comparison of network prediction results and ground truth, (a) 3D reconstruction image and (b) 2D slice display.
3.2. Virtual-real registration results
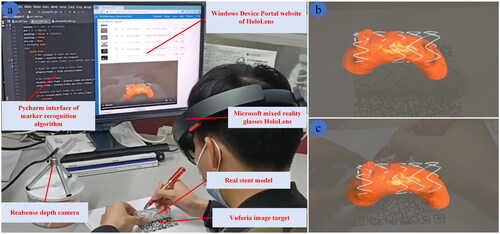
The real scene of registration experiment conducted by the researchers is shown in . It should be noted that head should be kept in a slow and steady motion or still position after registration. If head moves quickly, the in situ AR image displayed in HoloLens will shake, resulting in registration errors. In the experiment, the HoloLens device portal website is used to record AR scene displayed in HoloLens, and registration error is evaluated using RealSense depth camera and marker recognition algorithm. The registration result of the 3D in situ AR image and the real stent is shown in . shows the AR scene displayed when wearing the HoloLens before and after registration, respectively. The results show that the virtual-real registration effect based on Vuforia is comparatively well, and the virtual and real stents overlap well. Therefore, the proposed AR navigation method can assist doctors in performing IVFS effectively.
Figure 7. Registration experiment results. (a) Real scene of registration experiment. AR scene screenshot of wearing HoloLens (b) before registration and (c) after registration.
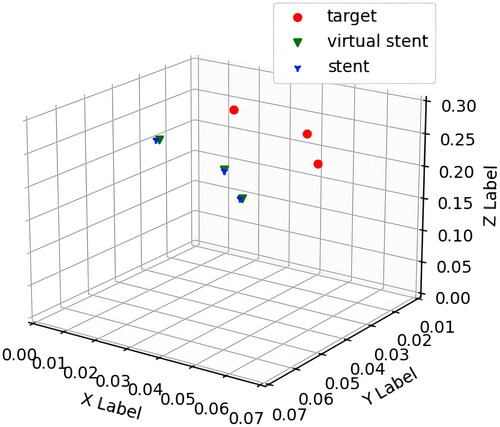
The marker points of Vuforia image target and stent-graft are recognized using recognition algorithm based on HSV colour space model. The spatial coordinates obtained are averaged to reduce errors. Since the spatial relationship of marker points between image target and virtual stent has been designed in Unity, the spatial coordinates of virtual marker points can be calculated based on those of marker points on image target. The spatial coordinates obtained of marker points after virtual-real registration are shown in . The FRE value is calculated using EquationEq. (4)(4)
(4) and is approximately 2.070 mm. After consulting with vascular surgery experts, it is determined that the error value is within an acceptable clinical range.
Figure 8. Spatial coordinates obtained of marker points after registration (units: meter). Red dots, green triangles and blue triangles represent spatial coordinates of three marker points on Vuforia image target, virtual stent model and real stent, respectively.
4. Discussion
The main contribution of this study is that the proposed method can achieve in situ AR display of IVFS. The paper utilizes a trained network model to achieve fast and automatic aorta segmentation. The segmentation results meet data requirements for AR navigation in fenestrated endovascular repair. Under a simple registration experiment condition, virtual-real registration method based on Vuforia is used to achieve virtual-real registration of an AR image and stent-graft. The registration accuracy can meet the needs of IVFS. The proposed AR navigation method provides 3D in situ AR image to intuitively and visually locate fenestration positions. Therefore, the method has clinical application value and can assist doctors in performing IVFS.
The introduction section covering numerous studies on deep learning-based aorta segmentation, many papers use U-Net as basic architecture for research. However, datasets used in most studies are patient data collected from hospitals, and only a few are public datasets. Differences in datasets and significant variations in sample size of these studies make it impossible to compare directly with this study. Therefore, we only compare segmentation results of our achieved networks to evaluate performance of AARU-Net algorithm. Additionally, some limitations are observed in entire aorta segmentation results. The segmentation performance of AARU-Net algorithm is poor for specific disease segments, such as aortic aneurysms, due to multiple types of aortic diseases in datasets. We assumed that the training effect was limited by multiple types of aortic diseases in the dataset. However, this paper focuses on AR navigation for IVFS of aortic arch branches. The improved algorithm achieves comparatively precise segmentation in thoracic aorta images. This indicates that the segmentation results can be applied to AR navigation for IVFS.
AR surgical navigation system developed by Xu et al. achieved an average distance error of 0.809 ± 0.05 mm and an FRE of approximately 1 mm [Citation4]. Liao et al. achieved an average position error of 1.12 ± 0.30 mm [Citation6]. Marker-based and markerless registration methods were used in both studies, resulting in high precision registration. Guo et al. reported a target registration error of 4.24 mm using a surface registration algorithm in Chinese master dissertation, while Miao et al. achieved an average registration error of 2.4 mm by AR Toolkit with NDI optical markers. In this study, the positioning accuracy of displayed images is limited by HoloLens, and there is some image shaking or deviation when using Vuforia markers for virtual-real registration [Citation7]. Nevertheless, a registration distance deviation of 2.070 mm is achieved in this study. The accuracy is sufficient for clinical applications of IVFS. Moreover, advantages of the proposed AR navigation method lie in its ability to intuitively display in situ AR image under simple experimental conditions, improving the accuracy of IVFS.
In future, nnU-Net can be researched to enable networks to tune the hyper-parameters automatically. Furthermore, our research team plans to integrate naked-eye 3D display technology into AR surgical navigation system. The system will be applied in vascular intervention surgery, eliminating extra burden of wearing glasses and enabling naked-eye in situ AR navigation.
5. Conclusion
In conclusion, this study proposes an AR navigation method to assist doctors in performing IVFS. The method combines AARU-Net-based automatic aorta segmentation and Vuforia-based virtual-real registration. As a result, the overlay display of 3D virtual images and real model is achieved to intuitively and accurately locate fenestration positions. The aorta segmentation and virtual-real registration experiments demonstrate that this method can provide assistance for doctors to perform IVFS.
Ethical approval
This study was approved by the Ethics Committee of Union Hospital, Tongji Medical College, Huazhong University of Science and Technology.
Disclosure statement
No potential conflict of interest was reported by the author(s).
Additional information
Funding
References
- Bossone E, Eagle KA. Epidemiology and management of aortic disease: aortic aneurysms and acute aortic syndromes. Nat Rev Cardiol. 2021;18(5):1–12. doi: 10.1038/s41569-020-00472-6.
- Swerdlow NJ, Wu WW, Schermerhorn ML. Open and endovascular management of aortic aneurysms. Circ Res. 2019;124(4):647–661. doi: 10.1161/CIRCRESAHA.118.313186.
- Coles-Black J, Barber T, Bolton D, et al. A systematic review of three-dimensional printed template-assisted physician-modified stent grafts for fenestrated endovascular aneurysm repair. J Vasc Surg. 2021;74(1):296–306.e291. doi: 10.1016/j.jvs.2020.08.158.
- Chen X, Xu L, Wang Y, et al. Development of a surgical navigation system based on augmented reality using an optical see-through head-mounted display. J Biomed Inf. 2015;55:124–131. doi: 10.1016/j.jbi.2015.04.003.
- Chan HHL, Haerle SK, Daly MJ, et al. An integrated augmented reality surgical navigation platform using multi-modality imaging for guidance. PLoS ONE. 2021;16(4):e0250558. doi: 10.1371/journal.pone.0250558.
- Han B, Li R, Huang T, et al. An accurate 3D augmented reality navigation system with enhanced autostereoscopic display for oral and maxillofacial surgery. Int J Med Robot. 2022;18(4):e2404. doi: 10.1002/rcs.2404.
- Pérez-Pachón L, Sharma P, Brech H, et al. Effect of marker position and size on the registration accuracy of HoloLens in a non-clinical setting with implications for high-precision surgical tasks. Int J Comput Assist Radiol Surg. 2021;16(6):955–966. doi: 10.1007/s11548-021-02354-9.
- Shu X-J, Wang Y, Xin H, et al. Real-time augmented reality application in presurgical planning and lesion scalp localization by a smartphone. Acta Neurochir (Wien). 2022;164(4):1069–1078. doi: 10.1007/s00701-021-04968-z.
- García-Mato D, Moreta-Martínez R, García-Sevilla M, et al. Augmented reality visualization for craniosynostosis surgery. Comput Methods Biomech Biomed Eng: Imaging Vis. 2021;9(4):392–399. doi: 10.1080/21681163.2020.1834876.
- Gao Y, Zhao Y, Xie L, et al. A projector-based augmented reality navigation system for computer-assisted surgery. Sensors (Basel). 2021;21(9):2931. doi: 10.3390/s21092931.
- Liao H, Inomata T, Sakuma I, et al. 3-D augmented reality for MRI-guided surgery using integral videography autostereoscopic image overlay. IEEE Trans Biomed Eng. 2010;57(6):1476–1486. doi: 10.1109/TBME.2010.2040278.
- Chen F, Cui X, Han B, et al. Augmented reality navigation for minimally invasive knee surgery using enhanced arthroscopy. Comput Methods Program Biomed. 2021;201:105952. doi: 10.1016/j.cmpb.2021.105952.
- Ma L, Zhao Z, Chen F, et al. Augmented reality surgical navigation with ultrasound-assisted registration for pedicle screw placement: a pilot study. Int J Comput Assist Radiol Surg. 2017;12(12):2205–2215. doi: 10.1007/s11548-017-1652-z.
- Ronneberger O, Fischer P, Brox T. U-net: convolutional networks for biomedical image segmentation. In: Medical image computing and computer-assisted intervention—MICCAI 2015. Cham: Springer International Publishing, 2015; p. 234–241. doi: 10.1007/978-3-319-24574-4_28.
- He K, Zhang X, Ren S, et al. Deep residual learning for image recognition. 2016 IEEE Conference on Computer Vision and Pattern Recognition (CVPR). Las Vegas, NV, USA, 2016; p. 770–778. doi: 10.1109/CVPR.2016.90.
- Oktay O, Schlemper J, Folgoc LL, et al. Attention U-Net: learning where to look for the pancreas. ArXiv e-prints, 2018: arXiv:1804.03999.
- Chen LC, Papandreou G, Kokkinos I, et al. DeepLab: semantic image segmentation with deep convolutional nets, atrous convolution, and fully connected CRFs. IEEE Trans Pattern Anal Mach Intell. 2018;40(4):834–848. doi: 10.1109/TPAMI.2017.2699184.
- Sieren MM, Widmann C, Weiss N, et al. Automated segmentation and quantification of the healthy and diseased aorta in CT angiographies using a dedicated deep learning approach. Eur Radiol. 2022;32(1):690–701. doi: 10.1007/s00330-021-08130-2.
- Maher GD, Fleeter CM, Schiavazzi DE, et al. Geometric uncertainty in patient-specific cardiovascular modeling with convolutional dropout networks. Comput Methods Appl Mech Eng. 2021;386:114038. doi: 10.1016/j.cma.2021.114038.
- Shaw L, Samady H, Baskaran L, et al. Automatic segmentation of multiple cardiovascular structures from cardiac computed tomography angiography images using deep learning. PLoS ONE. 2020;15(5):e0232573. doi: 10.1371/journal.pone.0232573.
- Jiang Z, Do HN, Choi J, et al. A deep learning approach to predict abdominal aortic aneurysm expansion using longitudinal data. Front Phys. 2020;7(235):1–13. doi: 10.3389/fphy.2019.00235.
- Pirruccello JP, Chaffin MD, Chou EL, et al. Deep learning enables genetic analysis of the human thoracic aorta. Nat Genet. 2022;54(1):40–51. doi: 10.1038/s41588-021-00962-4.
- Comelli A, Dahiya N, Stefano A, et al. Deep learning approach for the segmentation of aneurysmal ascending aorta. Biomed Eng Lett. 2021;11(1):15–24. doi: 10.1007/s13534-020-00179-0.
- Caradu C, Spampinato B, Vrancianu AM, et al. Fully automatic volume segmentation of infrarenal abdominal aortic aneurysm computed tomography images with deep learning approaches versus physician controlled manual segmentation. J Vasc Surg. 2021;74(1):246–256.e246. doi: 10.1016/j.jvs.2020.11.036.
- Saitta S, Sturla F, Caimi A, et al. A deep learning-based and fully automated pipeline for thoracic aorta geometric analysis and planning for endovascular repair from computed tomography. J Digit Imaging. 2022;35(2):226–239. doi: 10.1007/s10278-021-00535-1.
- Yu Y, Gao Y, Wei J, et al. A three-dimensional deep convolutional neural network for automatic segmentation and diameter measurement of type B aortic dissection. Kor J Radiol. 2021;22(2):168–178. doi: 10.3348/kjr.2020.0313.
- Cheng J, Tian S, Yu L, et al. A deep learning algorithm using contrast-enhanced computed tomography (CT) images for segmentation and rapid automatic detection of aortic dissection. Biomed Signal Process Control. 2020;62:102145. doi: 10.1016/j.bspc.2020.102145.
- Lyu T, Yang G, Zhao X, et al. Dissected aorta segmentation using convolutional neural networks. Comput Methods Programs Biomed. 2021;211:106417. doi: 10.1016/j.cmpb.2021.106417.
- Chen D, Zhang X, Mei Y, et al. Multi-stage learning for segmentation of aortic dissections using a prior aortic anatomy simplification. Med Image Anal. 2021;69:101931. doi: 10.1016/j.media.2020.101931.