
Abstract
Legislated stadium subsidies—the allocation of public funding toward stadium projects without a direct vote by citizens—has been the primary funding mechanism in more than 80% of the major professional sport stadium projects occurring in North America between 2005–2020. In the absence of a public vote, the degree to which citizens support a stadium subsidy is unclear. To investigate how citizens first appraise, and then respond to, a legislated stadium subsidy, we surveyed voters in Franklin County, Ohio, about the public purchase of Nationwide Arena, the anchor property of Columbus’s downtown Arena District. The results of structural model testing provided support for eight of 11 hypotheses. Both perceived stadium impact and trust in government were significant predictors of one’s evaluation of the public-financing plan. In turn, this evaluation impacted voter attitudes toward the stadium’s primary tenant, policymakers associated with the plan, and the democratic process in general.
法定体育馆补贴次级结果
法定体育场补贴, 即未经公民直接投票决定就将资金分配到体育场项目的公共资金, 从2005年开始一直到2020年, 都是美国北部地区80% 以上主要专业体育场项目的主要资助机制。没有了公民投票, 市民在体育馆建设上的补贴支持程度就尚不明确。为了了解市民是如何对体育馆补贴政策做出评估、响应, 我们采访了俄亥俄州富兰克林县的选民, 从全国竞技场(Nationwide Arena)的购票情况以及他们拥有哥伦布市市中心竞技场的主要房产的情况做了调查。结构模板测试为十一种假设中的八种假设提供了论证支持。两种调查结果发现选民受到体育场的影响并且信任政府, 这两点都对个人公共融资计划评估产生重要预测。反过来, 评估影响了选民对体育场主要所有者、与计划相关的决策者以及大体上的民主进程的态度。
1. Introduction
Nearly all North American professional sport stadium constructions and renovations have been financed in part through public subsidies. According to Long (Citation2013), the average public cost of the 121 facilities in use in 2010 across the major North American professional sports leagues was $259 million. In each stadium case, the decision to subsidise the project was arrived upon using one of two democratic methods: a vote by citizens (i.e., referendum or initiative) or a vote by legislators. In the former, each citizen can theoretically express her preference toward a particular policy ( for exceptions, see Fort, Citation1997, Citation1999 ); in the latter, elected representatives act on the behalves of their constituents (Hutchinson, Berg, & Kellison, Citation2018).
Given the availability of rich empirical material that comes with public votes, stadium-related examples of direct democracy have captured the attention of scholars, who have almost exclusively examined the factors leading to yes or no votes (e.g., Horn, Cantor, & Fort, Citation2015; Kellison & Mondello, Citation2012). Despite direct democracy’s ideal objective—to ensure that the desires of the majority of citizens are realised through policymaking—the literature contains examples of voters rejecting stadium-subsidy issues at the ballots, only for policymakers to utilise alternative procedures for allocating public funds toward a stadium project (e.g., Fort, Citation1999). Additionally, Fort’s (Citation1997) analysis of stadium referendums showed the amount of public funding invested in sports facility projects typically exceeds the median voter’s preference, thereby underscoring a criticism of direct democracy.
While examples of public stadium votes appear with some regularity in the literature, the vast majority of public stadium subsidies are awarded in the form of a legislated stadium appropriation, a no-vote subsidy (Kellison & Mondello, Citation2014). Since 2000, more than 50 stadium projects have been allocated public funds based on the decisions of elected officials, compared to 15 stadium-subsidy issues brought directly before voters (Center for Sport & Urban Policy, Citation2018a). When it comes to legislated stadium appropriations, researchers have focused on policymaker motives and the influence of powerful urban regimes and media outlets (e.g., Spirou, Citation2010).
Regardless of the democratic procedure used, the decision whether to subsidise a stadium project has almost always been the outcome of interest among researchers. Implicit in the literature on legislated stadium appropriations—and explicit in the case of Fort’s (Citation1997) referendums analysis—is the assertion that in some cases, stadium subsidies are not reflective of the electorate’s preference. Such opposition may have little influence on the outcome itself, but dissatisfied citizens may express their discontent in other ways. In this study, we consider the subsidy itself an antecedent of future behaviour. The purpose of this study was to investigate the ways in which citizens first appraise, and then respond to, a legislated stadium appropriation. These secondary outcomes reflect the possibility that voters, while absent from the stadium-subsidy decision itself, remain consequential. Despite the commonsense prediction that enacting policies contrary to the public’s preferences will displease voters, the target (or targets) and extent of this discontent is unclear. It is also unknown whether voters who support a legislated stadium subsidy will attach similarly positive feelings toward those connected to the subsidy, including the team and policymakers. In the following section, we discuss why a reaction beyond indifference should be expected at all.
2. Theoretical Foundations
2.1. Citizens and Their Representatives
At the heart of the debates over legislated stadium appropriations, subsidies awarded after a referendum defeat, and subsidies impacted by a reversion threat (Fort, Citation1997) is a philosophical argument about the nature of political representation. The so-called mandate–independence controversy considers the principles that inform an elected official’s legislative decisions. As Pitkin (Citation1967) notes, policymakers who take a mandate position act based on the preferences of their constituents, while representatives adhering to an independence philosophy are free to act on their own accord. Under the mandate model, elected delegates serve as proxies “sent to pursue [their] constituents’ will and not [their] own” (p. 146). On the other hand, under the independence philosophy, elected trustees are “experts…best left alone to do [their] work” (p. 147). Pitkin acknowledges the wide variance that may occur between the mandate and independence poles, as well as the possibility that individuals may change their positions based on a given issue.
It is worth noting that around the world, stadium projects regularly rely on government subsidies as primary or secondary funding mechanisms. As detailed by Kellison, Sam, Hong, Swart, and Mondello (Citationin press), the funding sources and underlying democratic mechanisms may differ across contexts and states. For instance:
When stadium projects are initiated with the intent of hosting an international mega-event, the central government frequently contributes a great deal of capital toward a project. In states like Korea, Australia, and Canada, subsidies from central and/or provincial governments can also be important funding sources for professional sports stadiums. In places like the US, on the other hand, municipal governments typically provide the largest portion of public subsidies. (pp. 32–33)
Kellison et al. explored the incidence of public stadium finance and public participation across various geopolitical systems and observed clear examples of citizens engaging in democratic deliberation across regime types ranging from so-called full democracies to authoritarian regimes. As they noted, “the observation of town forums and citizen demonstrations in several case-study regions suggests the tools of public participation are available and utilized by citizens living in democratic states” (pp. 32–33). Notably, despite the apparent availability of democratic mechanisms to citizens, in practice, these tools may not be readily accessible. Furthermore, the researchers concluded by acknowledging that even in states with strong democratic foundations, the efficacy of citizens’ participative actions remained unclear.
The efficacy of a democratic system is often measured by the relationship between the public will and public policy. As Rehfeld (Citation2009) contends, however, it is neither necessary nor practical for this relationship to be balanced in every case. A nuanced understanding of democratic representation, Rehfeld argues, requires the collapsing of the delegate–trustee dichotomy into three key distinctions: aim (whether the aim of a policy is Republican or Pluralist), source of judgment (from where the policymaker is receiving knowledge), and responsiveness (the degree to which the policymaker responds to sanction). The inclusion of responsiveness is particularly important, as it suggests that the threat of reproach from constituents may nudge policymaker decisions.
Other attempts to recast the delegate–trustee classification have also implied some degree of constituent power. For example, Mansbridge (Citation2003) proposed four complementary models of representation in American democracy: promissory, anticipatory, gyroscopic, and surrogate. Of the four models, only promissory representation preserves a traditional understanding of accountability, in which elected officials serve at the voters’ will. On the other hand, anticipatory, gyroscopic, and surrogate forms of representation employ less rigid expectations of accountability. Still, as Mansbridge notes, the absence of a normative understanding of accountability does not “replace the criterion of constituent–representative congruence” (p. 526). That is, although the manner in which representatives are held accountable differs across models, all retain the assumption that a democratic system should be evaluated, at least in part, by the degree to which legislative actions align with constituent preferences.
One way in which policymakers may reconcile differences between their legislative record and the preferences of their constituents is by adopting a philosophy of civic paternalism, a political strategy based on the premise that elected officials must act in ways that serve the best interests of the community at large (Kellison & Mondello, Citation2014). Proponents of civic paternalism echo the argument that the will of the people need not be reflected in public policy. Indeed, because of the civically paternalistic leader’s presumed knowledge and expertise, the leader’s decision making is not informed by what people desire most, but rather, what is best for the people (cf. Chiu, Citation2002). Even under the political ideology of civic paternalism (and certainly for those adhering to Pitkin’s [Citation1967] mandate orientation), elected officials may be incentivised to assess public opinion whether it be for informing policy decisions or political calculus. Below, the motives and methods for measuring public opinion are discussed in further detail.
2.2. Measuring Voter Attitudes on Non-Voting Issues
As a function of liberal democracy, elected representatives govern on behalf of their constituents. In many ways, this system of representation is designed to relieve ordinary citizens from both the complexity and minutiae of day-to-day governance. Still, even if a citizenry is not directly voting on daily affairs, an effective democracy still requires its engagement and action (Kellison, Citation2016). An active and engaged electorate may participate in the democratic process in a number of ways other than voting for elected officials or on issues (via the tools of direct democracy, including referendums, initiatives, or recalls). Alternative methods include canvassing, signing petitions, donating time or money, voicing opinions (e.g., in letters, public speeches, or social media), and assembling (e.g., at rallies or protests, or exercising civil disobedience; Stout, Citation2010). These citizen-led actions may indicate support for or opposition of a political candidate or elected official, proposed or enacted legislation, or other civic or social issue. Like voting, rates of engagement in these other forms of democratic participation can vary depending on the perceived significance of an election, law, or policy, and even in cases attracting a great deal of public attention, a highly visible citizen-led campaign for or against a candidate or issue may not accurately reflect public sentiment overall.
Given the likelihood that the above examples of democratic participation are not wholly representative of the public will, those with a vested interest in collecting more accurate estimates of public opinion (including policymakers, campaign managers, special interest groups, members of the media, pollsters, and political scientists) may employ their own tools. For example, previous scholarship of stadium-related issues has featured a wide array of methodological approaches for appraising public support, including ethnography (Scherer, Citation2016) and content or narrative analyses of public meetings (Sam & Scherer, Citation2008), media reports (Buist & Mason, Citation2010), and weblogs (Norman, Ventresca, Szto, & Darnell, Citation2015).
Of all of the methods for measuring public attitudes, historically, the opinion poll has been relied upon most: “Over time, the primary tool for gauging public opinion—the public opinion poll—became synonymous with the definition of public opinion and served as one of the central mechanisms for public feedback and influence over the policy-making processes” (Goidel, Citation2011, p. 18). Challenges in design, implementation, and interpretation (Bishop, Citation2005) notwithstanding, the opinion poll can provide a straightforward indication of public favorability toward a candidate or issue. For that reason, polls may be employed at any point (or at multiple points) in the policymaking process, and their results may serve several different purposes.
2.3. Responding to Public Opinion
When constructed with care and rolled out with purpose, public opinion polls produce rich and timely data that are relevant to multiple stakeholder groups (Fried, Citation2012). As argued by Bardes and Oldendick (Citation2017), political candidates may use polling data to plan political strategy in advance of or during a pivotal campaign. Opinion polls can also shape the policy positions of elected officeholders when they choose to consult their constituents before championing a particular agenda item. Other groups with vested interests in public opinion data include “government agencies at all levels, [who] use surveys to assess their overall performance as well as to evaluate specific programs and to determine the needs of those whom they serve” and “the media, who make independent observations of the public’s views on a range of issues as well as take the public’s pulse on the job performance of elected officials” (Bardes & Oldendick, Citation2017, p. 63). Regardless of the source of a poll, its results can indicate the degree to which a given policy coheres with the public will.
When concluding from polling data a legislative proposal is unpopular among the polity, policymakers may take several courses of action. Organisers in Boston dropped the city’s bid to host the 2024 Olympic and Paralympic Games, citing “low poll numbers” as the top reason. In his explanation for dropping the bid, U.S. Olympic Committee chief executive Scott Blackmun stated, “We have not been able to get a majority of the citizens of Boston to support hosting…” (Arsenault & Levenson, Citation2015, p. A1). Other times, policymakers push forward with a project despite an unfavourable citizenry. In 2001, Mecklenburg County (North Carolina) voters rejected (57.3–42.7%) a $172-million subsidy package for a new Charlotte Hornets arena. However, because the vote was structured as a non-binding advisory referendum, county officials were able to pass a revised subsidy proposal without any public consultation (cf. Kellison, Citation2016). Similarly, in 2006, Sacramento County (California) voters rejected (71.4–28.6%) a proposal that would allocate $600 million toward a replacement for ARCO Arena, home of the Sacramento Kings; a replacement arena, the Golden 1 Center, was later financed through legislative procedure and opened in 2016 ( Center for Sport & Urban Policy, Citation2018a, Citation2018b ). In other cases, policymakers have avoided subjecting stadium subsidy proposals to a public vote for fear they would not pass, examples of which have been documented in New York (Kellison, Newman, & Bunds, Citation2017), Minneapolis (Kaszuba & Duchschere, Citation2011), and Atlanta (Pearl, Citation2014).Footnote1
The above examples indicate that at least some of the time, stadium subsidies occur in spite of general public opposition. Outside of the context of stadium-related cases, scholars have considered how individual voters respond to the election of a candidate or ratification of a law they do not support. While some reactions are involuntary—for instance, voters who experience physiological responses like stress after learning their preferred candidate lost an election (Stanton, LaBar, Saini, Kuhn, & Beehner, Citation2010)—our interest in this study is in deliberate, behavioral responses. For example, Lyons and Lowery (Citation1989; see also Hirschman, Citation1970; Tiebout, Citation1956) proposed a model illustrating four ways in which citizens respond to dissatisfaction: voice (e.g., contacting officials, discussing political issues, campaign work, campaign contributions, participating in neighborhood groups, participation in demonstration); loyalty (e.g., voting, speaking well of the community, show support for the community by attending public functions); exit (e.g., leaving or contemplating leaving the jurisdiction, opting for privatized alternatives to government services); and neglect (e.g., nonvoting, feeling that fighting city hall has no impact, distrust of city officials). Each of these four responses is positioned on a matrix with two classifying dimensions—active–passive and constructive–destructive—where voice is an active, constructive response; exit is an active, destructive response; loyalty is a passive, constructive response; and neglect is a passive, destructive response.
These responses have clear implications for policymakers and the institution of democracy. For instance, when dissatisfied citizens respond with constructive behaviors like participating in demonstrations or opposition campaigns, elected officeholders may feel pressure to legislate with greater responsiveness. For that reason, policymakers may refer to public opinion data before making a decision on a controversial issue, as noted in Burstein’s (Citation2003) characterization of the influence of public opinion: “So far as we can tell from published research, policy is affected by opinion most of the time; often—over half the time when public opinion has any effect—the impact really matters substantively” (p. 34). Meanwhile, dissatisfied citizens with destructive responses may withdraw from participation in elections or community events, actions that may reduce the efficacy of the democratic process.
As evidenced above, there are compelling reasons to take into account public opinion (even when the public is uninformed or apathetic; Mondello & Kellison, Citation2016), including its capacity to effect change: As argued by Mason, Washington, and Buist (Citation2015), “a shift in public opinion can influence the democratic process and shape policy decisions” (p. 544). Still, there are times when public policy and public will are inharmonious. When officeholders support legislation that is unpopular among the electorate—for example, allocating public funds toward a stadium project despite voter opposition in an advisory referendum—the public’s response is not meaningless, nor is it when officeholders promote favorable policies. In this study, we explore both the influencers and influence of public opinion in a stadium-subsidy case. Our approach to measuring public opinion is outlined below.
3. Measuring the Public Response to a Legislated Stadium Subsidy
Based on our interest in understanding (1) the factors that contribute to an individual’s support of a stadium-subsidy plan and (2) the effect of that support on multiple stakeholders, we employed Kellison’s (Citation2016) multistage model of the public response to a no-vote subsidy. This model was conceptualised under the premise that measuring public opinion is valuable even in cases of legislated stadium subsidies: “Though ultimately immaterial in the public-financing decision, public perception of the subsidy may not be inconsequential” (p. 469). That is, citizens with particularly strong feelings about a stadium subsidy may direct their support or anger toward individuals or groups associated with the financing plan, including the team or elected officials. While the original model was constructed to measure voter responses to no-vote stadium subsidies, nearly all aspects of the model could be applied to public votes outside of the stadium-subsidy context. The model is organised into three stages and includes 10 constructs and 11 research hypotheses (see ).
Figure 1. Final structural model.
Note. Dashed line indicates path was not significant at the .05 level. For illustrative purposes, each of the three stages is bounded by the paths (rather than constructs) contained within the respective stage; for example, Ideology moderates Plan → Policymakers is considered a Stage 2 outcome because the path is drawn within the Stage 2 boundaries. Omitted from this final structural model is TeamID, which was predicted to moderate the relationship between Plan and Consume (H3b) but was removed from analysis because of suspected multicollinearity with Consume; *p < .01. **p < .001.
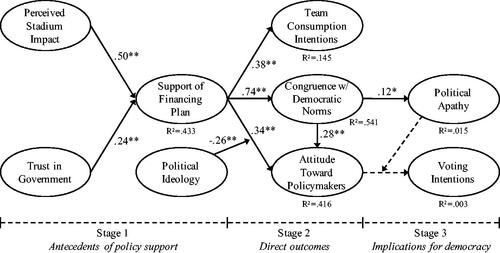
The model’s first stage, Antecedents of Policy Support, contains two factors theorised to influence whether an individual favours a public stadium-financing plan: Perceived Stadium Impact (Stadium) and Trust in Government (Trust). These predictors are not meant to be exhaustive. Instead, they show that in the absence of a public vote on a stadium-subsidy issue, citizens not only weigh the perceived tangible (e.g., job creation, anchoring entertainment district, attracting business activity, downtown growth) and intangible (e.g., civic pride, city status, excitement) benefits of the facility, but also the trustworthiness of the policymakers promoting the stadium project. This stage also introduces Support of Financing Plan (Plan) as an outcome variable. Two hypotheses predict the relationship between these variables:
H1: The perception that the value of the stadium is high will have a positive impact on a citizen’s support of the public stadium-financing plan
H2: Trust in government will have a positive impact on a citizen’s support of the plan to finance a professional sports stadium using public funds
With respect to H1, perceived stadium value is intentionally unspecific, as voters may measure a facility’s value based on tangible or intangible factors (or both). This approach is consistent with that taken by Kellison and Kim (Citation2017), who argued, “in the voter’s mind, a stadium’s value can be expressed in both economic and non-economic terms, with varying weights assigned to the individual benefits” (p. 477).
In the second stage, Direct Outcomes, the targets of an unfavourable (or favourable) legislated stadium subsidy are identified. The first target is the sports franchise associated with the stadium. As the primary tenant of the venue, the team is a key benefactor of a stadium subsidy. It is represented by one construct in the model, Team Consumption Intentions (Consume) and Team Identification (TeamID), and two hypotheses:
H3a: Citizen support of the public stadium-financing plan will have a positive impact on personal team consumption intentions
H3b: A citizen’s attitude toward the team will moderate the relationship between support of the public stadium-financing plan and team consumption intentions such that as attitude toward the team increases in favourability, the positive relationship between support of the public stadium-financing plan and team consumption intentions will strengthen. Alternatively, as attitude toward the team decreases in favourability, the positive relationship between support of the public stadium-financing plan and team consumption intentions will weaken
The second outcome of interest in an unpopular (or popular) stadium subsidy is Congruence with Democratic Norms (Congruence). This construct and its associated hypothesis centre on the institution of democracy itself:
H4: A citizen’s support of the public stadium-financing plan will have a positive impact on the personal assessment that the local political process is congruent with democratic norms
Elected officeholders are the third target of interest. Two constructs, Attitude Toward Policymakers (Policymakers) and Political Ideology (Ideology), are included. Additionally, three hypotheses are proposed:
H5a: Personal support of the public stadium-financing plan will have a positive impact on a citizen’s attitude toward local policymakers
H5b: A citizen’s political ideology will moderate the relationship between support of the public stadium-financing plan and the attitude toward local policymakers such that as a citizen’s political ideology corresponds to that of the policymaker, the positive relationship between support for the public stadium-financing plan and favourability toward local policymakers will strengthen. Alternatively, as a citizen’s political ideology moves away from that of the policymaker, the positive relationship between support of the public stadium-financing plan and favourability toward local policymakers will weaken
H6: A citizen’s assessment that the local political process is congruent with democratic norms will have a positive impact on the personal attitude toward local policymakers
The third stage, Implications for Democracy, illustrates how a legislated stadium subsidy can affect an individual’s participation in the democratic process, as measured by Political Apathy (Apathy) and Voting Intentions (Vote). Three hypotheses are included in this final stage:
H7: A citizen’s assessment that the local political process is congruent with democratic norms will have a negative impact on political apathy
H8a: A citizen’s attitude toward policymakers will have a curvilinear, U-shaped relationship with personal voting intentions, such that as a citizen’s attitude toward policymakers moves away from a neutral position (toward either extreme), the intention to vote will strengthen
H8b: Political apathy will moderate the relationship between a citizen’s attitude toward policymakers and voting intentions such that as political apathy increases, the curvilinear relationship between the citizen’s attitude toward policymakers and intentions to vote will weaken. Alternatively, as political apathy decreases, the curvilinear relationship between the citizen’s attitude toward policymakers and voting intentions will strengthen
On the surface, there is little incentive to consult the general public before a legislated stadium subsidy occurs. However, the fact that citizens do not have direct votes on such issues does not mean they are unimportant. While they may not affect the outcome of the stadium subsidy, citizens may express their support or opposition in other ways, including in the forms of voice, loyalty, exit, or neglect (Lyons & Lowery, Citation1989). In this study, we explore how citizens evaluate and respond to no-vote stadium subsidies by testing Kellison’s (Citation2016) conceptual model and research hypotheses outlined above. We discuss the research protocol for measuring these secondary outcomes next.
4. Method
4.1. Background
Our investigation focused on a legislated stadium subsidy that occurred in Franklin County, Ohio, in 2010 (cf. Kellison et al., Citation2017; Kellison & Mondello, Citation2014). Between 1978 and 1997, voters rejected five different proposals to publicly fund various stadium developments. The vote occurring in 1997 was tied to a multipurpose arena in downtown Columbus that would secure an expansion National Hockey League franchise. After that referendum defeat, a group of private investors agreed to finance the construction of a $150-million, 18,500-seat arena. A year later, groundbreaking for Nationwide Arena took place. The arena opened in September 2000, and the Columbus Blue Jackets began its inaugural season a month later. In the years that followed, more than $1 billion was invested to develop a downtown “arts and entertainment district” (Williams, Citation2015). The 75-acre Arena District includes commercial and residential spaces, more than 2,000 hotel rooms, numerous restaurants and bars, a 2,200-seat indoor concert hall and 4,500-seat amphitheater, and a 10,100-seat minor-league ballpark.
According to reports in the Columbus Dispatch, a decade of playing in a privately-owned arena had created severe financial hardships for the Blue Jackets’ ownership group, as the team’s lease agreement required the franchise to pay high annual rent fees and arena operating costs (Caruso, Citation2011). In 2011, citing concerns that the terms of the Blue Jackets’ agreement with Nationwide Realty was unsustainable and could lead the team to relocate, the Columbus City Council and Franklin County Commission agreed to purchase Nationwide Arena for $53.3 million, a cost to be funded entirely from casino-generated revenues. The public purchase and subsequent renegotiation of the Blue Jackets’ lease secured the team’s future in Columbus until at least 2039.
Given Franklin County residents’ historic reluctance to support the use of public funds for stadium projects, the announcement of the private-to-public ownership transfer of Nationwide Arena engendered considerable controversy (Hunter, Citation2011). Supporters expressed relief that the Blue Jackets would remain in Columbus, thereby securing a long-term tenant of Nationwide Arena, itself the anchor of the larger Arena District. On the other hand, opponents pointed to the county’s history of defeated stadium referendums and argued the casino revenues now earmarked for the arena could have been used for improvements to public education, welfare programs, or civil services. No public polling was conducted during the arena refinancing period.
4.2. Measurement
To measure the constructs and research hypotheses summarized above, we used a modified version of the Proxy Referendum on Public Stadium Appropriation (PROPSA; Kellison & Kim, Citation2017). The instrument is intended for “large-scale analyses of voter attitudes towards individuals, groups, and institutions” (p. 15), and previous administrations of the PROPSA have provided evidence of its reliability and validity (Kellison & Wendling, Citation2015). The PROPSA was designed to minimize the impact of measurement and nonresponse errors, common method variance, and social desirability bias (e.g., proximal separation of the predictor and criterion variables, reduction of ambiguous items and the social desirability of response choices, positive–negative item balance).
The revised PROPSA contained 55 items and one space for additional notes. Among these items were 38 statements measuring 10 latent constructs (making up the measurement model), five additional measures of public involvement, three measures of political efficacy, a multi-part item related to political-party affiliation, and eight demographic items. With few exceptions (i.e., Previous Voting Behavior, Future Voting Intentions, Political Ideology items), survey participants responded to the items using a 7-point, Likert-type scale. Most items used the anchors strongly disagree and strongly agree. In some cases, unique anchors were used to maintain consistency with PROPSA items originating from previously used instruments (e.g., Attitude Toward Policymakers and Political Ideology; American National Election Studies, Citation2012). Response options to demographic characteristics were consistent with those provided in the most recent U.S. Census (U.S. Census Bureau, Citation2012b).
4.3. Sampling
The purpose of this study was to better understand the attitudes of ordinary citizens in Franklin County toward the public purchase of Nationwide Arena. Based on this population of interest, a sample of residents from Franklin County was used for the principal study. A simple random sampling technique was used, as this method was expected to lend to the validity of the structural model (Hair, Black, Babin, & Anderson, Citation2009). Records were obtained from the Franklin County Board of Elections, which provided contact information (including name, address, date of birth, voter registration date, and previous elections participated in) of 809,513 registered voters in Franklin County. From this raw pool, we removed 180,163 inactive voters (i.e., voters who had neither re-registered nor voted during the past two federal election cycles or whose mailing address was reported as inaccurate). The remaining 628,990 cases were assigned random numbers, and 5,000 records were selected to receive survey packets. The packets included a cover letter; four-page, paper-and-pencil survey; raffle entry form; and postage-paid reply envelope. Survey packets were mailed upon Institutional Review Board approval.
5. Analysis and Results
5.1. Participants
Of the total 5,000 surveys mailed, 400 packets were returned as undeliverable. From the remaining pool of 4,600 voters, 492 individuals returned surveys, resulting in an initial response rate of 10.7%. The response rate was adequate, given the low response rates typical of mail surveys (Griffis, Goldsby, & Cooper, Citation2003). We reviewed each returned survey for completeness, and disqualified nine cases due to insufficient data (i.e., 5% or greater incidence of missing responses). Additionally, we removed one case because the respondent was not a registered voter in Franklin County. Finally, we checked survey responses for trustworthiness. To determine whether respondents were providing truthful answers, we compared an item related to previous voting activity (i.e., Did you vote in the 2012 Presidential election?) with data provided by the Franklin County Board of Elections that tracked voter participation in the general election on November 6, 2012. Seventeen individuals provided responses that conflicted with their actual voting behavior; we eliminated those cases from subsequent analyses.
The next step in the data screening process was to identify, analyze, and account for any instances of missing data. To determine whether a nonresponse pattern could be inferred, Little’s (Citation1988) missing complete at random (MCAR) test was conducted. The Little’s MCAR test statistic was not significant (χ2 = 1354.61, df = 1283, p > .08), indicating the probability of an observed variable’s missing datum was likely not dependent upon any other observed or unobserved measurements. However, because the normality assumption was violated (as described in the following section), a maximum-likelihood approach such as replacing the missing data with predicted values generated from an expectation-maximization algorithm was deemed inappropriate (Savalei, Citation2010). Therefore, an additional 67 cases with missing data were removed from the dataset. After all problematic cases were removed, the final usable response rate was 8.7% (N = 401). Using the recommendations of Krejecie and Morgan (Citation1970), we concluded that in order to obtain a representative sample of Franklin County’s 1.1 million residents with 95% confidence, the preferred sample size was 384. Thus, our usable sample size was deemed sufficient.
The median age of respondents was 52, and the female-to-male ratio was nearly equal (49.9–50.1%). The majority of respondents self-identified as White (85.8%), and more than 60% held a bachelor’s degree or higher. The median per capita income fell between $50,000 and $74,999. Lastly, more than 98% of the sample voted in the 2012 general election, as verified by the Franklin County Board of Elections. In , a demographic profile of the sample is provided and compared with all registered voters and all residents in Franklin County. In comparison with all Franklin County residents, the sample is generally older, more educated, and more affluent. The contrasts between the average voter in this study and the average Franklin County resident is somewhat expected based on File and Crissey’s (Citation2012) report of demographic trends among U.S. voters. As citizens age, attain higher levels of education, and increase their earnings, the likelihood they are registered voters also increases. Furthermore, as age, education level, and earnings increase, so too does the probability an individual will actually vote.
Table 1. Demographic comparison of sample, county registered voters, and all county residents.
5.2. Measurement Model
Prior to conducting confirmatory factor analysis (CFA), several inferential statistics assumptions were tested. First, correlations among the constructs were compared to identify potential cases of multicollinearity and singularity. Before computing the correlations, composite variables were created. All but one correlation (Consume–TeamID) were outside the .75–.95 range recommended by Grewal, Cote, and Baumgartner (Citation2004). The relationship between Consume–TeamID was highly correlated (r = .78), demonstrating the probability of multicollinearity. Given the predicted relationship between Consume and TeamID, this high correlation was unsurprising; still, the TeamID construct was ultimately removed from the testing of the structural model. As a result of deletion of the TeamID construct, H3b (i.e., TeamID will moderate Plan–Consume) was not tested in this study. Next, the multivariate normality assumption was tested. After the calculation and subsequent review of Mardia’s (Citation1985) coefficients of skewness (668.75; z = 103.86) and kurtosis (2858.47; z = 30.91), we determined the data did not follow a normal distribution. To correct for the violation of the normality assumption, the Satorra-Bentler (S-B) estimation model was used for CFA and path analysis (Satorra & Bentler, Citation1994).
After the estimation model was selected, the measurement model was examined using Mplus 8.2. As the leading part of Anderson and Gerbing’s (Citation1988) two-step process, the measurement model was examined for satisfactory fit prior to conducting path analysis. For this step, approximately half of the sample was randomly selected (n = 200). contains the standardized factor leadings, standard errors, t-values, construct reliability (CR) coefficients, and average variance extracted (AVE) coefficients of eight latent factors. All standardized factor loadings were significant at the .05 level. Additionally, all CR and AVE values exceeded .70 and .50, respectively, providing evidence of construct and convergent validity (Hair et al., Citation2009; Nunnally & Bernstein, Citation1994). We further evaluated discriminate validity by computing squared correlations and comparing these statistics with AVE values, as shown in . In every case, the AVE values exceeded each of the squared correlations, providing evidence of each construct’s distinctiveness. Finally, we evaluated model fit using the split-half sample data. Based on the satisfactory model fit demonstrated by the fit indices (S-B χ2/df = 957.142/630 = 1.52; RMSEA = .05; SRMR = .06; CFI = .96; TLI = .95), overall, the results provided evidence that the measures possessed adequate psychometric properties.
Table 2. Measurement model using split-half sample (n = 200).
Table 3. Comparison of AVE and squared correlations.
Table 4. Summary of hypothesis testing.
5.3. Structural Model
No modifications were made following assessment of the measurement model. The final component of data analysis was to test the research hypotheses using the full sample (N = 401). The hypotheses and hypothesized model were tested using simultaneous equations analysis. After paths were specified to represent the research hypotheses, the fit indices were computed and compared with the aforementioned rules of thumb. The model fit indices provided evidenced to conclude the model fit the data satisfactorily (S-B χ2/df = 995.79/513 = 1.94; RMSEA = .05; SRMR = .08; CFI = .96; TLI = .95), as all fit indices met the minimum standards suggested by Kline (Citation2016) and Hu and Bentler (Citation1999). The results of the structural model testing are illustrated in .
For the first stage of the model, the direct paths from Stadium (γ = .50; 95% CI = .43, .57) and Trust (γ = .24; 95% CI = .17, .31) to Plan were both significant in the anticipated direction, thus rendering support for H1 and H2, respectively. Collectively, these two predictors explained 43% of the variance in the Plan construct (ζ = .57; 95% CI = .51, .63).
In the next stage, the immediate outcomes of the voters’ support of the plan were examined. The direct paths from Plan to Consume (β = .38; 95% CI = .32, .45), Congruence (β = .74; 95% CI = .69, .78), and Policymakers (β = .34; 95% CI = .25, .53) were significant in the expected directions, thereby providing support for H3, H4, and H5, respectively. Indirect effects from Stadium (γ×β = .19; 95% CI = .14, .24) and Trust (γ×β = .09; 95% CI = .06, .12) through Plan to Consume were significant. In sum, Plan accounted for 15% of the variance in Consume (ζ = .86; 95% CI = .81, .91) and 54% of the variance in Congruence (ζ = .46; 95% CI = .40, .52). The direct path from Congruence to Policymakers was also significant in the predicted direction (β = .28; 95% CI = .20, .37), which supported H6.
To test H5b, multiple group analysis was employed to compare two models: one constraining the path coefficient from Plan to Policymakers, and the other freely estimating the path. Given the violation of the normality assumption, it was necessary to compute a difference test scaling correction (Satorra, Citation2000) and conduct the Satorra-Bentler scaled chi-square difference test. The result was significant at the .05 level, indicating the presence of a moderating effect. While we predicted that the more conservative an individual’s political ideology was, the more likely that person would be to find policymakers unfavorable (given the fact the entire county commission and city council was Democratic), moderation testing revealed the opposite was true: in general, as conservatism increased among respondents, the positive relationship between Policymakers and Plan increased. Voters with conservative political ideologies tended to have low levels of support for the financing plan when they had unfavorable opinions of policymakers. However, as support of the financing plan increased, conservative favorability of policymakers increased at a faster rate than those of both moderates and liberals. Together, Plan, Congruence, and Ideology explained 42% of the variance in Policymakers (ζ = .58; 95% CI = .52, .65). The indirect effects of the antecedents of policy support, Stadium and Trust, on the direct outcomes of Plan support were also examined. The indirect effects from Stadium (γ×β = .37; 95% CI = .31, .43) and Trust (γ×β = .18; 95% CI = .12, .23) through Plan to Congruence were significant. Furthermore, the indirect effects from Stadium (γ×β = .27; 95% CI = .23, .32) and Trust (γ×β = .13; 95% CI = .08, .18) through Plan to Policymakers were significant.
For the third stage, several hypothesized relationships were analyzed to determine the extent, if any, to which a citizen’s attitudes toward democracy changed as a result of the stadium-financing plan. The direct path from Congruence to Apathy (β = .12; 95% CI = .05, .20) was significant, and Congruence explained 2% of the variance in Apathy (ζ = .99; 95% CI = .97, 1.00). However, because the expected relationship between Congruence and Apathy was negative, H7 was supported, but not in the expected direction. To determine whether a curvilinear relationship existed between Policymakers and Vote (as posited by H8a), the quadratic function was employed. The results of this procedure indicated the nonlinear function did not explain any additional variance; therefore, H8a was not supported. The Policymakers predictor explained a negligible amount of variance in Vote (ζ = 1.00; 95% CI = .99, 1.00). Next, the moderating effect of Apathy on the Policymakers–Vote relationship was examined and found not to be significant; as a result, H8b was not supported. Finally, the indirect effect from Plan through Congruence to Apathy (γ×β = .09; 95% CI = .03 .15) was significant, while the indirect effect from Plan through Policymakers to Vote was not.
In total, six hypotheses were supported by the research findings. An additional two hypotheses were statistically significant, but the anticipated directions of the relationships were not supported. Conversely, two hypotheses were not supported by the research, and another was not tested in this study. A summary of the hypothesis testing results is provided in .
Table 5. Descriptive statistics.
Finally, descriptive statistics of the full sample were computed, a summary of which is provided in . In general, the sample attributed a high level of relevance to the Nationwide Arena public financing plan. Nearly 70% of respondents indicated they cared about the arena-financing issue (M = 5.13). Additionally, 70% of surveyed voters agreed that the financing plan for Nationwide Arena concerned everyone in Columbus (M = 5.11). When asked if they believed the financing plan was an important community issue, three quarters of the sample concurred (M = 5.19). Generally, the study’s sample was aware of the financing plan, with 76.5% noting they had at least some knowledge of the plan prior to completing the survey. Finally, nearly two-thirds of the sample said they expressed an interest in the issue by following news of the financing plan in the local press.
6. Discussion
6.1. Antecedents of Policy Support
In the absence of a public vote, it was unclear whether citizens supported the decision to purchase Nationwide Arena using casino-generated revenues. Therefore, one of the central purposes of this study was to determine the extent to which Franklin County residents supported the stadium subsidy and to identify reasons for their support of or opposition to the financing plan. Both Stadium and Trust were significant predictors of an individual’s support of the financing plan. The significant and positive relationship between Stadium and Plan was inferred by H1 and supported in previous research. For example, Mondello and Anderson (Citation2004) noted that as a voter’s anticipation of a new stadium’s benefits increased, so did the likelihood the voter would favor public financing for construction. An added caveat in this study is that Franklin County residents did not have to speculate about Nationwide Arena’s impact on the city. That is, voters could use 15 years of evidence to determine whether they believed the arena had benefitted Columbus.
The relationship between Trust and Plan was also significant in the hypothesized direction, as predicted by H2. While the strength of the relationship between Trust and Plan was less than half that of Stadium and Plan, these results nevertheless indicate that politics matters when one is assessing the value of a public-financing plan. Respondents generally showed moderate trust that their local government would work in the best interests of the citizenry (M = 4.17). As discussed by Kellison and Mondello (Citation2014), policymakers have noted their decision-making processes are influenced by ideologies of civic paternalism. The results of this study provide evidence that a policymaker’s trustworthiness played a role in the citizen’s evaluation of a public-financing plan. Thus, while decision-makers in Columbus may have the best of intentions, they must also be recognized by voters as faithful to the will of the people if citizens are to view the financing plan favorably.
For policymakers, the prospect of gaining the trust of the citizenry may prove to be daunting considering the acrimonious state of contemporary U.S. politics. Today, the American people’s contempt of government is expressed through historically low approval ratings of Congress (Pew Research Center, Citation2015), calls for term-limit and campaign finance reform (Pearson & Kidwell, Citation2009), growing support of third-party candidates (Goebel, Citation2002), and recall elections (Davey, Citation2012). Additionally, a Pew Research Center (Citation2018) study indicated “a striking mismatch between the public’s goals for American democracy and its views of whether they are being fulfilled” (p. 2). This conclusion was based on Pew’s finding that “on 23 specific measures assessing democracy, the political system and elections in the United States—each widely regarded by the public as very important—there are only eight on which majorities say the country is doing even somewhat well” (p. 2). One potential source of consolation may be the fact that Americans generally have shown greater trust and confidence in local government—the level of government most often given oversight of a stadium subsidy initiative—as opposed to state or federal government (McCarthy, Citation2016).
Arena and Trust represent two unique perspectives of the political process. The first factor, and the factor weighed perhaps most heavily, is the perceived impact of the arena on the community. Had the Columbus Arena District been only marginally prosperous, and by extension, downtown growth been minimal, citizens would probably be less apt to support any public funding initiatives. The results of the study also provided evidence that voters’ trust in their elected officials impacts whether they deem government-led projects appropriate. The significant relationship between Trust and Plan also demonstrated that voters might not have accepted the language of the local proposition at face value and might also have gone through processes of interpretation and deliberation before approving the initiative. For example, because the terms of the financing plan could be stated in fairly unspecific terms (i.e., Nationwide Arena is purchased using revenues generated from the local casino), voters might have deferred to policymaker trustworthiness before making a judgment about the financing plan.
Despite the predictive effects of Stadium and Trust on Plan, more than half of the variance in Plan was explained by other factors. If a goal of future research is to identify additional antecedents of support of a public-financing plan, characteristics of both the voter and the issue should be investigated. Examples of characteristics to consider include traditional dimensions of personality orientation (Zettler, Hilbig, & Haubrich, Citation2011), sources of information (Bowler & Donovan, Citation1994), political orientation (Branton, Citation2003), cost of investment, and team success. Understanding the factors that influence a voter’s favorability of a stadium-finance plan is important. In the case of direct democracy, this favorability is reflected in the passage of a public initiative or referendum.
6.2. Direct Outcomes
In the second and third stages of the hypothesized model, the consequences of a private citizen’s attitude toward the arena-financing plan were examined. As predicted in H3a, the relationship between Plan and Consume was significant in the expected direction, and the single predictor accounted for 14.5% of the variance in team consumption intentions. This positive relationship suggested that an individual supportive of the financing plan had intentions to attend a Blue Jackets game. To address the possibility that such a relationship could be explained by a citizen’s identification with the Blue Jackets, a moderating relationship was proposed in H3b. Under this scenario, an individual could be supportive of the financing plan but lack any intention to attend a hockey game at the arena. As discussed previously, however, this relationship was not examined due to the presence of multicollinearity between team identification and team consumption intentions. In general, the sample members reported low levels of both team identification (M = 2.95) and team consumption intentions (M = 3.18). In fact, over two-thirds of respondents indicated they were not Blue Jackets fans (i.e., Mean scores of TeamID were less than 4). Although the high correlation between TeamID and Consume was problematic psychometrically, the results of the path analysis were still telling. While unmeasured factors were more predictive of Consume, these results nevertheless indicated that an individual’s support of the financing plan was a factor in the decision making of some Blue Jackets game attendees.
The fact that, on average, respondents supported the financing plan despite having low levels of identification with the Blue Jackets and attendance intentions also suggests nonfans recognized the value of Nationwide Arena. This support may be the result of a number of factors. For instance, citizens who trusted their elected officials to legislate in ways that benefit the entire community may have had greater confidence in the plan. It is also possible respondents recognized the value of the arena as the anchor of a larger Arena District; perhaps they were patrons of the local restaurants and bars, concertgoers who enjoyed live music at the district venues, fans of the triple-A baseball team that played in the adjacent ballpark, residents of the area loft apartments, or employees of businesses headquartered in the district. In future investigations focused on a stadium that is part of a larger revitalization effort, when investigating consumer intentions, researchers should consider asking about not only the facility but also surrounding businesses and attractions.
As noted previously, when the tools of direct democracy are not employed, elected officials are expected to serve as a proxy for the general will. In this study, a voter’s assessment that local policymaking was congruent with democratic norms indicated whether she or he believed the financing plan reflected the general will of the people. The relationship between Plan and Congruence was significant in the expected direction, thus supporting H4. Additionally, Plan accounted for over half (54.1%) of the variance in Congruence. Based on the significant Plan–Congruence relationship, an individual was more likely to consider the Nationwide Arena financing plan reflective of the will of the people if she or he favored the plan. This explanation was supported by the literature on projection bias (cf. Robbins & Krueger, Citation2005). As defined by Van Boven, Judd, and Sherman (Citation2012), simple projection is “the tendency for people who hold a particular stance to perceive others as more likely to hold that stance” (pp. 84–85). This bias can be problematic because it leads individuals to assume the majority of the public shares their opinions. In the case of the Nationwide Arena case, a biased perspective may limit a person’s ability to recognize undemocratic procedures.
To examine the implications of the financing for policymakers, several predictors of policymaker favorability were examined. The path between Plan and Policymakers was significant in the expected direction, thereby providing support for H5a. One suggestion from this relationship is that there was some political significance to the adoption of a no-vote subsidy. Intuitively, it seems obvious that the favorability or unfavorability of an elected official is contingent upon whether the public supports the policies of that official. As supported by previous literature, this relationship was expected to be moderated by party preference, in which Republican voters, for example, were expected to have less favorable opinions of the all-Democratic county commission and city council, regardless of voters’ support of the plan (Erikson, Panagopoulos, & Wlezien, Citation2010). However, the results provide evidence that the opposite is true: as political ideologies increased in conservativeness, voter favorability of the policymakers increased. This unanticipated relationship indicated that the effect of a single issue (i.e., the public purchase of Nationwide Arena) is more pervasive than found through path analysis. While individuals typically vote along party lines, certain issues may lead to a reduction of party allegiance at the ballot box.
A second predictor of policymaker favorability, Congruence, was also found. This significant relationship provided verification that residents’ approval of local policymakers was not contingent upon only the content of the financing plan, but also the manner in which it was instituted. Therefore, policymakers seeking the approval of voters should consider both the content and delivery of their policies. Previous researchers provided evidence to support the contention that a process perceived as democratically legitimate would predict an individual’s approval of that process (Bos & van der Brug, Citation2010). Finally, while less than half of the variance in Policymakers was explained by the two predictors, the policymakers’ approval of the financing plan was undoubtedly connected to the way in which policymakers were perceived by the public. Accordingly, had the financing plan been heavily scrutinized by the public, policymakers might have anticipated political fallout at their next elections. (Recent cases in Miami and Atlanta illustrate the electoral consequences of voter backlash following unpopular no-vote stadium subsidies; Kellison et al., Citation2017.) But the long-term political effects appeared to be minimal, as no member of the Franklin County Commission and Columbus City Council who sought reelection lost her or his seat in the votes that immediately followed the refinancing of Nationwide Arena.
6.3. Implications for Democracy
The final stage related to the broader implications of the no-vote subsidy on democratic ideals. Based on previous literature, we expected political apathy to be high among those individuals who thought the arena financing process was incongruent with democratic norms. Under this rationale, a voter who thought the Nationwide Arena plan was unreflective of the will of the people would be disheartened by the democratic process. Additionally, we hypothesized that particularly high and low levels of favorability would empower voters to participate in elections. If a voter strongly supported a policymaker, the voter would endeavor to reelect the commissioner or council member; on the other hand, if a voter strongly opposed a policymaker, the voter would respond by going to the ballots and voting for the challenger. However, neither of these relationships was fully supported by the data.
While a significant relationship between Democracy and Apathy was found, the relationship was significant in an unexpected direction and Democracy explained less than 2% of the variance in Apathy. Meanwhile, Policymakers failed to account for any negligible variance in Vote, and the relationship between the two constructs was not significant. A kneejerk interpretation of the data is that the no-vote subsidy had little-to-no influence on a citizen’s attitudes toward democracy. Similarly, while attitudes toward the team, democracy, and policymakers changed based on one’s approval or disapproval of the financing plan, only the team was likely to experience changes in behavioral intentions among their fans (i.e., through attendance). Thus, while voters might have expressed disdain toward the democratic process and policymakers as a result of a no-vote subsidy, the long-term implications of the Nationwide Arena plan were minimal, as neither apathy nor voting intentions were engendered. Based on this initial conclusion, civic leaders who knowingly supported unpopular policies should be encouraged in that they could continue to promote these policies without creating new contingencies of angry voters. For the same reason, democratic advocates might be dispirited.
This interpretation may not fully capture the effects of the no-vote subsidy on the democratic process. This study was originally designed with the intent to capture a representative sample of persons living in Franklin County, Ohio. Additionally, we wanted to identify the general sentiment of voters as opposed to all citizens. A review of the Franklin County voter registration records revealed that these two goals were compatible. Based on U.S. Census Bureau estimates and Franklin County Board of Elections records, 90% of residents aged 18 and older were registered to vote for the 2012 general election (Franklin County Board of Elections, Citation2012; U.S. Census Bureau, Citation2012a). Of registered voters, 71.1% participated in the 2012 general election, as did 64% of all eligible citizens in Franklin County. Given the high ratio of registered voters to unregistered citizens (9:1), it is reasonable to suspect that the average registered voter is representative of the wider county population. During the data collection and entry stages of this study, however, it became clear that the sample was not entirely representative of the county population. Perhaps the best indicator of this fact was in the past election participation rates. Of the study participants whose data were retained for the principal data analysis, 394 of 401 (98.3%) voted in the highly contested 2012 general election. Additionally, over 90% of respondents reported with confidence their intentions to vote in the next election. Previous researchers have shown that the best indicator of future voter behavior is a composite between previous election activity and future voting intention (Murray, Riley, & Scime, Citation2009). Although the data failed to provide support for the hypotheses in the third stage of the public-response model, a more heterogeneous sample might have produced more telling evidence for these hypotheses.
While the sample’s high political engagement was unexpected, it should not have been unanticipated given the much-publicized effort to reach Ohio voters during the 2012 election season. In the months leading up to the 2012 presidential election between Barack Obama and Mitt Romney, the state was the epicenter of political activity. Recognizing Ohio as a key battleground state, the Obama campaign set up more field offices there (131, representing over one-fifth of all offices nationwide) than in any other state (Dwyer, Friedman, & Ng, Citation2012). Furthermore, no state was visited more by either candidate than Ohio (Obama: 22 visits; Romney: 51 visits; Dwyer et al., Citation2012). Over $177 million was spent on advertising in the state (Bell & Wilson, Citation2012), and more Ohioans were targeted by television ads than anyone else (219,414; Dwyer et al., Citation2012). With the high frequency and long duration of media and campaign attention on their state, Ohioans could recognize the significance of their votes more than most others (Lovejoy, Riffe, & Cheng, Citation2012). Indeed, the median voter in this study reported positive political efficacy, meaning she believes that politics and government are uncomplicated, ordinary citizens have a say in what government does, and public officials care about the thoughts of voters. A sample containing an even mix of politically involved and uninvolved citizens would be beneficial.
Based on the skewed distributions of both political apathy and voting intentions, we contend that while the results of hypothesis testing failed to support the third-stage relationships, this portion of the research is incomplete. Follow-up examinations must target a wider range of Franklin County residents, including those who are not registered to vote and inactive registered voters, using the applicable measures of the PROPSA. Additional approaches for improving stadium-related public polling are discussed next.
6.4. Limitations and Future Research
Of the 401 study participants, all but seven voted in the 2012 general election. A larger sample of nonvoters would have almost certainly improved what we know about the factors contributing to apathy and diminished voting intentions. This understanding could be additionally enhanced by surveying individuals with lower levels of awareness and interest in the Nationwide Arena financing plan. These individuals are likely among the 4,108 registered voters who did not return their survey packets. Given the presumed lack of political interest among non-respondents, it may also be necessary to adopt alternative research methods in order to attract their participation. Interviewing empaneled apathetic voters is one approach that could improve subsequent investigations. In addition to acquiring information specific to the no-vote subsidy, recommendations could also be given by the panel to improve participation in standardized surveys. Similarly, the population of interest could be expanded to include citizens who were not registered as voters. While these individuals would be more difficult to access (e.g., no records in the Board of Elections dataset), the feedback they provide could lead to better-informed hypotheses relating constructs such as democratic congruence, attitudes toward local policymakers, political apathy, and future voting intentions.
Second, the extent to which context—that is, the unique facets of Columbus and the Nationwide Arena financing plan—influenced the tested relationships in this study has not been determined. Perhaps the most unique feature of the Columbus case was that it involved a private-to-public ownership transfer of Nationwide Arena, rather than the construction of a new facility. Because the arena had already existed for 15 years, citizens could evaluate the public-financing plan based on actual evidence rather than speculating about the hypothetical benefits of a planned facility. Though the perceived benefits of a proposed new stadium could be measured using the PROPSA in its current form (i.e., job creation, increased business interest, improved city status), it is unclear whether citizens would display the same level of confidence in the stadium’s positive economic impact. Therefore, this line of research should be extended to investigate no-vote subsidies in any number of cities across the US; policymakers involved in stadium-finance decision-making should be surveyed, as should local citizens affected by the no-vote subsidy.
In future research, more attention should be given to consumers of a stadium’s primary tenant, given the generally low level of team identification among PROPSA respondents. Currently, it is unclear why few Blue Jackets fans responded to survey requests. Perhaps Blue Jackets fans represented only a small niche of the larger Franklin County population. Alternatively, it is possible that Blue Jackets fans (or hockey fans in general) who received the survey were uninterested in its focus on politics. It is somewhat difficult to imagine a widespread phenomenon in which devoted Blue Jackets fans received PROPSA packets, read the description of the study, and felt unmotivated to participate despite the relevance of the questions to something in which they are deeply interested. Thus, additional research is necessary to ascertain the reasons for the lack of hockey-fan representation in this sample.
7. Conclusion
Based on the results of the study, voters in Columbus who supported the decision to purchase the city’s downtown arena using public tax revenues based their judgments not only on the perceived economic impact of the facility, but also the trustworthiness of their elected officials. This study contributes a new understanding of the factors that impact a citizen’s assessment of a public stadium-financing plan. The congruence of decision-maker leadership style and citizen trust is important for policymakers seeking to pass provocative legislation. In particular, a civically paternalistic leader who relies on one’s own insight rather than the public’s consent may be challenged by political opponents and citizen activists if the leader’s expertise or motive is in question.
Additionally, this study has shown that teams associated with a public-financing plan are not immune to the public’s response. Obviously, the team has a vested interest in the outcome of a stadium-subsidy debate. For owners and team management, securing the capital necessary to rebuild or renovate an arena, ballpark, or stadium eliminates any uncertainty about the team’s future in a city. Prior to this investigation, it seemed as though the team seemingly faces few consequences when a no-vote subsidy was awarded. However, as demonstrated in this study, the team also has a vested interest in the public’s attitude toward the financing plan. Thus, even when a subsidy is awarded without direct public consent, the team may alienate potential consumers or be penalized with an abbreviated novelty period (Coates & Humphreys, Citation2005). What remains unclear is the extent to which the team should be involved during the subsidy-negotiation phase.
This work also adds to what we know about the stadium-financing case in central Ohio. As with most other no-vote-subsidy cities, there has been little effort to ascertain the views of ordinary Columbus citizens. Furthermore, previous research on all forms of stadium subsidies has focused on either the voting outcome or political consequence. This study contains the first large-scale analysis of voter attitudes toward myriad individuals, groups, and institutions. In brief, the results suggested that ordinary citizens reflect upon both the perceived impact of the stadium and the trustworthiness of their elected officials when considering the appropriateness of a stadium subsidy. Furthermore, whether a citizen approves or disapproves of a financing plan impacts her or his attitudes toward the team, policymakers, and the democratic process altogether. As much as a citizen might disapprove of the means or outcome of a no-vote subsidy, however, that disapproval has little impact on her or his political apathy or future voting intentions. Thus, even a citizen’s strong support for or disapproval of the legislated stadium subsidy does little to compel the individual to actually vote for or against the policymakers affiliated with the financing deal.
In previous research, it has been suggested that those involved in unpopular stadium-financing deals enjoy some level of political immunity (Carr, Citation2009). In Columbus, participants in this study indicated the legislated stadium subsidy was not politically risky. There were equal levels of approval and disapproval, with most respondents placing themselves somewhere along the middle. Moreover, those who disapproved did not respond by reliably voting against the policymakers behind the plan. The impact of the Nationwide Arena deal may have been somewhat muted by the fact the central issue was a transfer of ownership rather than the financing of a new arena that could cost taxpayers hundreds of millions of dollars. Other cases in other cities could yield much different responses among the local citizenry, and future research should consider how the scale of a project could have an effect on voter attitudes. Additionally, although not explicitly explored in this study, it is important to acknowledge that citizens’ attitudes toward stadium projects (or any political issue for that matter) are not formed in isolation. That is, a citizen’s willingness to support or oppose a public stadium financing initiative may be informed by a variety of sources, including “information shortcuts” supplied by the press or political elites (Mondello & Kellison, Citation2016). Alternatively, citizens may be absent in stadium debates because of apathy, lack of knowledge, or active suppression by government (Kellison et al., in press). In future research, scholars should consider how the public’s attitudes toward stadium issues are shaped, including the political and economic conditions under which these cases play out.
On the surface, legislated stadium subsidies may be problematic based on the assumption that public-stadium financing is a politically unpopular means for building or renovating professional sports facilities. In the Columbus case, this assumption was supported by precedent; four decades’ worth of attempts to build a publicly funded sports venue had failed to receive voter approval. Interestingly, the data did not support this assumption, leaving open the possibility that the no-vote subsidy may have been the politically preferable outcome. This suggestion is deserving of further critical analysis because it weakens the argument that legislated stadium subsidies undermine the public will. Even so, the pervasiveness of the legislated stadium subsidy raises new questions about the appropriateness of public-stadium financing. Future research on this financing phenomenon will allow us to see the full scope of its economic, social, and political significance.
Notes on Contributors
Timothy Kellison (Ph.D., Florida State University, U.S) is Director of the Center for Sport and Urban Policy and an Assistant Professor in the Department of Kinesiology and Health at Georgia State University. Dr. Kellison’s research focuses on sport in urban environments, including public policy and sport, urban and regional planning, and environmentally sustainable design
Yukyoum Kim (Ph.D., University of Florida, U.S) is a Professor in the College of Education at Seoul National University. Dr. Kim’s central research foci are sport marketing, sponsorship, and well-being
Jeffrey D. James (Ph.D., The Ohio State University, U.S) is Chair and the Mode L. Stone Distinguished Professor in the Department of Sport Management, Florida State University. Dr. James’s research is focused on the psychological connections people have with sports products and the impacts of such sport consumer behavior and sport marketing
Acknowledgement
The authors thank Gerald Ferris, Timothy Chapin, and Mary Stutzman for their assistance with this study.
Disclosure Statement
No potential conflict of interest was reported by the authors.
Additional information
Funding
Notes
1 To be clear, both legislative and advisory referendums are controversial. Legislative referendums may be viewed as the legislature “[shirking] its duty by referring controversial decisions to the people” (League of Women Voters of Hawaii, Citation2003, para. 6), and this controversy may be deemed even more intrusive when it comes to rights-related issues.
References
- American National Election Studies. (2012). The ANES guide to public opinion and electoral behavior. Ann Arbor, MI: University of Michigan, Center for Political Studies. Retrieved from http://electionstudies.org
- Anderson, J. C., & Gerbing, D. W. (1988). Structural equation modeling in practice: A review and recommended two-step approach. Psychological Bulletin, 103(3), 411–423. doi:10.1037/0033-2909.103.3.411
- Arsenault, M., & Levenson, M. (2015, July 28). Boston 2024: USOC and local group agree to pull bid for Olympics. Boston Globe, A1.
- Bardes, B. A., & Oldendick, R. W. (2017). Public opinion: Measuring the American mind (5th ed.). Lanham, MD: Rowman & Littlefield.
- Bell, P., & Wilson, R. (2012). Ad spending in the presidential battleground states. NationalJournal. Retrieved from http://www.nationaljournal.com
- Bishop, G. F. (2005). The illusion of public opinion: Fact and artifact in American public opinion polls. Lanham, MD: Rowman & Littlefield Publishers, Inc.
- Bos, L., & van der Brug, W. (2010). Public images of leaders of anti-immigration parties: Perceptions of legitimacy and effectiveness. Party Politics, 16(6), 777–799. doi:10.1177/1354068809346004
- Bowler, S., & Donovan, T. (1994). Information and opinion change on ballot propositions. Political Behavior, 16(4), 411–435. doi:10.1007/BF01498825
- Branton, R. P. (2003). Examining individual-level voting behavior on state ballot propositions. Political Research Quarterly, 56(3), 367–377. doi:10.1177/106591290305600311
- Buist, E. A., & Mason, D. S. (2010). Newspaper framing and stadium subsidization. American Behavioral Scientist, 53(10), 1492–1510. doi:10.1177/0002764210368081
- Burstein, P. (2003). The impact of public opinion on public policy: A review and an agenda. Political Research Quarterly, 56(1), 29–40. doi:10.1177/106591290305600103
- Carr, P. J. (2009, April). The politics of stadium financing: The price of mayoral support. Paper presented at the Annual Midwest Political Science Association Conference, Chicago, IL. Abstract retrieved from http://www.mpsanet.org
- Caruso, D. (2011, September 15). Saving the Blue Jackets. Columbus Dispatch. Retrieved from http://www.dispatch.com/content/stories/local/2011/09/15/saving-the-blue-jackets.html
- Center for Sport and Urban Policy. (2018a). North American professional sport referendums, 2000–present [online]. Retrieved from http://www.stadiatrack.org/vote
- Center for Sport and Urban Policy. (2018b). North American professional sport stadiums receiving public funding, 2005–present [online]. Retrieved from http://www.stadiatrack.org/public
- Chiu, Y. S. (2002). On the feasibility of unpopular policies under re-election concerns. Southern Economic Journal, 68(4), 841–858. doi:10.2307/1061495
- Coates, D., & Humphreys, B. R. (2005). Novelty effects of new facilities on attendance at professional sporting events. Contemporary Economic Policy, 23(3), 436–455. doi:10.1093/cep/byi033
- Davey, M. (2012, January 15). Governor who took on unions may face a closely watched recall election. New York Times. Retrieved from http://www.nytimes.com
- Dwyer, D., Friedman, E., & Ng, C. (2012). Election 2012: The campaign by the numbers. ABC News. Retrieved from http://abcnews.go.com
- Erikson, R. S., Panagopoulos, C., & Wlezien, C. (2010). The crystallization of voter preferences during the 2008 presidential campaign. Presidential Studies Quarterly, 40(3), 482–496. doi:10.1111/j.1741-5705.2010.03782.x
- File, T., & Crissey, S. (2012). Voting and registration in the election of November 2008. U.S. Census Bureau. Retrieved from http://www.census.gov
- Fort, R. (1997). Direct democracy and the stadium mess. In R. G. Noll & A. Zimbalist (Eds.), Sports, jobs and taxes: The economic impact of sports teams and stadiums (pp. 146–177). Washington, DC: The Brookings Institution Press.
- Fort, R. (1999). Stadium votes, market power and politics. The University of Toledo Law Review, 30, 419–441.
- Franklin County Board of Elections. (2012). Official audit results summary. Retrieved from http://vote.franklincountyohio.gov
- Fried, A. (2012). Pathways to polling: Crisis, cooperation, and the making of public opinion professions. New York: Routledge.
- Goebel, T. (2002). A government by the people: Direct democracy in America, 1890–1940. Chapel Hill, NC: The University of North Carolina Press.
- Goidel, K. (2011). Public opinion in a digital age: Meaning and measurement. In K. Goidel (Ed.), Political polling in the digital age: The challenge of measuring and understanding public opinion (pp. 11–27). Baton Rouge, LA: Louisiana State University Press.
- Grewal, R., Cote, J. A., & Baumgartner, H. (2004). Multicollinearity and measurement error in structural equation models: Implications for theory testing. Marketing Science, 23(4), 519–529. doi:10.1287/mksc.1040.0070
- Griffis, S. E., Goldsby, T. J., & Cooper, M. (2003). Web-based and mail surveys: A comparison of response, data, and cost. Journal of Business Logistics, 24(2), 237–258. doi:10.1002/j.2158-1592.2003.tb00053.x
- Hair, J. F., Black, W. C., Babin, B. J., & Anderson, R. E. (2009). Multivariate data analysis (7th ed.). Upper Saddle River, NJ: Prentice Hall.
- Hirschman, A. O. (1970). Exit, voice, and loyalty: Responses to decline in firms, organizations, and states. Cambridge, MA: Harvard University Press.
- Horn, B. P., Cantor, M., & Fort, R. (2015). Proximity and voting for professional sporting stadiums: The pattern of support for the Seahawk stadium referendum. Contemporary Economic Policy, 33(4), 678–688. doi:10.1111/coep.12108
- Hu, L., & Bentler, P. M. (1999). Cutoff criteria for fit indexes in covariance structure analysis: Conventional criteria versus new alternatives. Structural Equation Modeling, 6(1), 1–55. doi:10.1080/10705519909540118
- Hunter, B. (2011, May 11). Blue Jackets’ value to city goes beyond hockey. Columbus Dispatch. Retrieved from http://www.dispatch.com/content/stories/sports/2011/05/11/jackets-value-to-city-goes-beyond-hockey.html
- Hutchinson, M., Berg, B. K., & Kellison, T. B. (2018). Political activity in escalation of commitment: Sport facility funding and government decision making in the United States. Sport Management Review, 21(3), 263–278. doi:10.1016/j.smr.2017.07.005
- Kaszuba, M., & Duchschere, K. (2011, April 5). Stadium bill skirts vote on sales tax. Star Tribune, A1.
- Kellison, T. B. (2016). No-vote stadium subsidies and the democratic response. International Journal of Sport Management, 17, 452–477.
- Kellison, T. B., & Kim, Y. K. (2017). Public attitudes towards no-vote stadium subsidies: The development and validation of an ex post proxy referendum. International Journal of Sport Policy and Politics, 9(3), 469–489. doi:10.1080/19406940.2016.1247106
- Kellison, T. B., & Mondello, M. J. (2012). Organisational perception management in sport: The use of corporate pro-environmental behavior for desired facility referenda outcomes. Sport Management Review, 15(4), 500–512. doi:10.1016/j.smr.2012.01.005
- Kellison, T. B., & Mondello, M. J. (2014). Civic paternalism and political policymaking: The public justification for no-vote stadium subsidies. Journal of Sport Management, 28(2), 162–175. doi:10.1123/jsm.2012-0210
- Kellison, T. B., Newman, J. I., & Bunds, K. S. (2017). Framing democracy: Stadium financing and civic paternalism in Test Market, USA. Sport in Society, 20(11), 1548–1564. doi:10.1080/17430437.2017.1284805
- Kellison, T., Sam, M. P., Hong, S., Swart, K., & Mondello, M. J. (in press). Global perspectives on democracy and public stadium finance. Journal of Global Sport Management. doi:10.1080/24704067.2018.1531680.
- Kellison, T. B., & Wendling, E. (2015). Fan and nonfan participation in a suburban stadium strategy: An analysis of the Atlanta–Cobb no-vote subsidy case. Paper presented at the meeting of the Sport Marketing Association, Atlanta, GA.
- Kline, R. B. (2016). Principles and practice of structural equation modeling (4th ed.). New York, NY: Guilford Press.
- Krejecie, R. V., & Morgan, D. W. (1970). Determining sample size for research activities. Educational and Psychological Measurement, 30, 607–610. doi:10.1177/001316447003000308
- League of Women Voters of Hawaii. (2003). Initiative and referendum revisited. Retrieved from http://www.lwv-hawaii.com/initiative.htm
- Little, R. J. A. (1988). A test of missing completely at random for multivariate data with missing values. Journal of the American Statistical Association, 83(404), 1198–1202. doi:10.2307/2290157
- Long, J. G. (2013). Public/private partnerships for major league sports facilities. New York: Routledge.
- Lovejoy, J., Riffe, D., & Cheng, H. (2012). Campaign interest and issue knowledge: Did the media—and negative political advertising—Matter in “battleground Ohio?” Atlantic Journal of Communication, 20(4), 201–220. doi:10.1080/15456870.2012.711148
- Lyons, W. E., & Lowery, D. (1989). Citizen responses to dissatisfaction in urban communities: A partial test of a general model. Journal of Politics, 51(4), 841–868. doi:10.2307/2131537
- Mansbridge, J. (2003). Rethinking representation. American Political Science Review, 97(04), 515–528. doi:10.1017/S0003055403000856
- Mardia, K. V. (1985). Mardia’s test of multinormality. In S. Kotz & N. L. Johnson (Eds.), Encyclopedia of statistical sciences (vol. 5, pp. 217–221). New York: Wiley.
- Mason, D. S., Washington, M., & Buist, E. A. N. (2015). Signaling status through stadiums: The discourses of comparison within a hierarchy. Journal of Sport Management, 29(5), 539–554. doi:10.1123/jsm.2014-0156
- McCarthy, J. (2016, September 19). Americans still more trusting in local over state government. Gallup. Retrieved from https://news.gallup.com/poll/195656/americans-trusting-local-state-government.aspx
- Mondello, M. J., & Anderson, P. (2004). Stadiums, arenas, and sports referendums: A comparative analysis of cities involved in the stadium game. International Journal of Sport Management, 5(1), 43–71.
- Mondello, M. J., & Kellison, T. (2016). Sport stadium referendums: Factors influencing the success or failure of ballot initiatives. Journal of Contemporary Athletics, 10, 139–155.
- Murray, G. R., Riley, C., & Scime, A. (2009). Pre-election polling: Identifying likely voters using Iterative Expert Data Mining. Public Opinion Quarterly, 73(1), 159–171. doi:10.1093/poq/nfp004
- Norman, M., Ventresca, M., Szto, C., & Darnell, S. C. (2015). Driving to the “net”: Blogs, frames, and politics in the New York Islanders’ stadium saga. Journal of Sport & Social Issues, 39, 19–39. doi:10.1177/0193723514541282
- Nunnally, J. C., & Bernstein, I. H. (1994). Psychometric theory (3rd ed.). New York: McGraw-Hill.
- Pearl, M. (2014). Braves president: Cobb deal had to be kept under wraps. WXIA-TV. Retrieved from http://www.11alive.com/sports/mlb/atlanta-braves/braves-president-cobb-deal-had-to-be-kept-under-wraps/253151902
- Pearson, R., & Kidwell, D. (2009, February 15). Illinois considered corrupt, ethics reform and term limits might be solution. Chicago Tribune. Retrieved from http://articles.chicagotribune.com
- Pew Research Center. (2015). Beyond distrust: How Americans view their government. Retrieved from http://www.people-press.org/2015/11/23/beyond-distrust-how-americans-view-their-government/
- Pew Research Center. (2018). The public, the political system and American democracy. Retrieved from http://www.people-press.org/2018/04/26/the-public-the-political-system-and-american-democracy/
- Pitkin, H. F. (1967). The concept of representation. Berkeley, CA: University of California Press.
- Rehfeld, A. (2009). Representation rethought: On trustees, delegates, and gyroscopes in the study of political representation and democracy. American Political Science Review, 103(02), 214–230. doi:10.1017/S0003055409090261
- Robbins, J. M., & Krueger, J. I. (2005). Social projection to ingroups and outgroups: A review and meta-analysis. Personality and Social Psychology Review, 9(1), 32–47. doi:10.1207/s15327957pspr0901_3
- Sam, M. P., & Scherer, J. (2008). Stand up and be counted: Numerical storylines in a stadium debate. International Review for the Sociology of Sport, 43(1), 53–70. doi:10.1177/1012690208094426
- Satorra, A. (2000). Scaled and adjusted restricted tests in multi-sample analysis of moment structures. In R. D. H. Heijmans, D. S. G. Pollock, & A. Satorra (Eds.), Innovations in multivariate statistical analysis. A festschrift for Heinz Neudecker (pp. 233–247). London: Kluwer Academic Publishers.
- Satorra, A., & Bentler, P. M. (1994). Corrections to test statistics and standard errors in covariance structure analysis. In A. von Eye & C. C. Clogg (Eds.), Latent variables analysis: Applications for developmental research (pp. 399–419). Newbury Park, CA: Sage.
- Savalei, V. (2010). Expected versus observed information in SEM with incomplete normal and nonnormal data. Psychological Methods, 15(4), 352–367. doi:10.1037/a0020143
- Scherer, J. (2016). Resisting the world-class city: Community opposition and the politics of a local arena development. Sociology of Sport Journal, 33(1), 39–53. doi:10.1123/ssj.2015-0054
- Spirou, C. (2010). Cultural policy and the dynamics of stadium development. Sport in Society, 13(10), 1423–1437. doi:10.1080/17430437.2010.520934
- Stanton, S. J., LaBar, K. S., Saini, E. K., Kuhn, C. M., & Beehner, J. C. (2010). Stressful politics: Voters’ cortisol responses to the outcome of the 2008 United States Presidential election. Psychoneuroendocrinology, 35(5), 768–774. doi:10.1016/j.psyneuen.2009.10.018
- Stout, J. (2010). Blessed are the organized: Grassroots democracy in America. Princeton, NJ: Princeton University Press.
- Tiebout, C. M. (1956). A pure theory of local expenditures. Journal of Political Economy, 64(5), 416–424. doi:10.1086/257839
- U.S. Census Bureau. (2012a). Columbus (city) quickfacts from the US Census Bureau. Retrieved from http://www.census.gov
- U.S. Census Bureau. (2012b). Statistical abstract of the United States: 2012. Retrieved from http://www.census.gov
- Van Boven, L., Judd, C. M., & Sherman, D. K. (2012). Political polarization projection: Social projection of partisan attitude extremity and attitudinal processes. Journal of Personality and Social Psychology, 103(1), 84–100. doi:10.1037/a0028145
- Williams, M. (2015, October 17). Arena district a blueprint for other cities’ development. Columbus Dispatch. Retrieved from http://www.dispatch.com/content/stories/business/2015/10/18/1-copy-right.html
- Zettler, I., Hilbig, B. E., & Haubrich, J. (2011). Altruism at the ballots: Predicting political attitudes and behavior. Journal of Research and Behavior, 45, 130–133. doi:10.1016/j.jrp.2010.11.010