
ABSTRACT
Considerable effort has been expended to construct culverts and fishways that allow for fish passage. However, the designs have seldom considered behaviour, energetics, and biomechanics of fish. In this study, we performed controlled experiments, in which upstream-migrating Alewife (Alosa pseudoharengus) and Brook Trout (Salvelinus fontinalis) were allowed to volitionally enter either one of two open channels. These channels were outfitted with horizontally and vertically oriented baffles. The flow structure was characterized using acoustic Doppler velocimeter measurements. The added baffles had a marked influence on the flow field, which was distinct between horizontal and vertical baffles, indicative of horizontally and vertically orientated vortices, respectively. Passage success was measured, both in terms of attraction and ascent performance under each flow condition. The results indicated that Alewife and Brook Trout staged significantly more attempts into the vertical baffled channel compared to the horizontal baffled channel. However, Alewife traversed greater distances swimming in the channel with the horizontal baffles at the lower flow condition. Brook Trout also swam further under low flow but traversed similar dtistances in both channels. This information furthers our understanding of both ascent performance and behavioural responses of fish in relation to turbulent flow and roughness orientation.
Introduction
Culverts, which have varying characteristics with respect to water depth, velocity, and roughening elements, are generally used to divert rivers and streams under roads, railways, and other embankments (WDFW Citation2003). Fish movements may be hindered or prevented by culverts if the hydraulic conditions exceed fish swimming capacities or due to behavioural rejections (Haro et al. Citation2004; Gibson et al. Citation2005; Castro-Santos and Haro Citation2006). Consequently, culverts may impede fish movement, leading to extensive fragmentation of habitat; not only for anadromous and potamodromous species, but also for resident species that use different habitat over a range of time scales (Hendry et al. Citation2003).
Although considerable effort has been expended to construct culverts that allow for passage success, fish behaviour, energetics, and biomechanics have seldom been successfully integrated in the design of fish passage structures (Castro-Santos Citation2004; Castro-Santos and Haro Citation2006). Hydraulic complexity may benefit fish that minimize energetic expenditure by utilizing slow-flowing areas in the lee of natural structures (Everest and Chapman Citation1972; Morantz et al. Citation1987); and in some cases, fish may actually be able to extract energy from the associated vortices to enhance swimming performance (Coutant Citation1998; Hinch and Rand Citation2000; Liao et al. Citation2003a). Furthermore, some authors have argued that eddies in turbulent flow can serve as orienting signals for fish seeking passage past barriers (Pavlov and Lupandin Citation1994; Coutant Citation2001; Goodwin et al. Citation2006). Therefore, upstream-migrating fish might perform better when passing through culverts with heterogeneous flow patterns with elevated turbulence levels rather than uniform flow patterns and low turbulence. Herein, we define turbulence as eddy-induced velocity fluctuations of all three components about a statistically steady mean.
Findings on the effects of turbulence on the energetics and kinematics of fish suggest, however, a more complicated relationship (Liao Citation2007; Tritico and Cotel Citation2010; Lacey et al. Citation2012). Flows that have periodic components, such as steady Kármán vortex streets behind a specific obstacle geometry, may be beneficial for fish, but flows characterized by chaotic fluctuations in velocity may increase the energetic costs (Enders et al. Citation2003, Citation2005) and therefore repel fish (Cotel et al. Citation2006; Smith et al. Citation2006). Furthermore, the effect of turbulence on swimming ability is strongly affected by intensity, periodicity, orientation, and scale of vortices (Tritico and Cotel Citation2010; Lacey et al. Citation2012). These findings strongly suggest that certain types and characteristics of turbulence may be conducive to fish passage, while others may be inhibitory.
Some authors have recommended the application of baffles (Rajaratnam et al. Citation1990), riprap (McKinnon and Hnytka Citation1985) or the placement of natural bedload substrate (e.g. cobbles and small boulders (Behlke et al. Citation1991; Clay Citation1995)) within culverts. These enhance hydraulic heterogeneity and create areas of lower velocity in which fish may rest. However, these design efforts do not take into account the behavioural responses to the recommended flow conditions. Instead, the design efforts often rely solely on available swimming capacity data, which are sparse when it comes to complex flows. Moreover, several studies have called into question the reliability of these swimming capacity experiments, which are typically obtained using fish confined to swim chambers that tend to underestimate swimming performance (Peake Citation2004; Castro-Santos et al. Citation2013).
The aim of this study was therefore to explore the effects of common hydraulic conditions on the ascent performance of a salmonid and a non-salmonid fish species of different size and age stage through rectangular box culverts. Controlled experiments were performed in which fish volitionally enter either one of two open channels that were outfitted with horizontally and vertically oriented baffles, respectively. More specifically, the objectives were to analyze behavioural attraction and ascent performance responses of migratory Alewife (Alosa pseudoharengus Wilson) and Brook Trout (Salvelinus fontinalis Mitchell) to different conditions of turbulence and flow. In particular, we hypothesized that horizontal turbulent momentum exchange (a proxy for vertically oriented vortices), which match the body undulation of the swimming fish, is intrinsically more beneficial for fish passage than vertical turbulent momentum exchange (a proxy for horizontally oriented vortices).
Materials and methods
Fish
We conducted experiments with both Alewife and Brook Trout. Both species are of great ecological and cultural importance. They differ substantially in morphology and behaviour. The anadromous Alewife has a laterally compressed body and a carangiform swimming mode, whereas the stream-dwelling Brook Trout has fusiform body shape and a sub-carangiform swimming mode. Availability of experimental fish and the interest of funding organizations also played a role in the selection of the study species. Alewife were collected from Town Brook, Plymouth, MA, USA and transferred to the USGS-BRD S.O. Conte Anadromous Fish Research Center (hereafter referred to as the “Conte Lab”) located in Turners Falls, MA, USA for two to four days before testing. Upon arrival, Alewife were externally tagged using individually coded passive integrated transponder (PIT) tags (Digital Angel Corporation, model TX1415BE; length 32 mm, diameter 3.9 mm, dry weight 0.57 g, glass-encapsulated tags), measured for fork length, determined the sex, and held in open, flow-through ponds (Castro-Santos et al. Citation1996). The PIT tags were externally attached with a small fishhook bonded to the tag at the base of the dorsal fin of the Alewife.
Brook Trout were obtained from two different sources: (1) wild Brook Trout were captured by electrofishing in streams within a 12 km radius of the Conte Research Center, and (2) hatchery-reared Brook Trout were provided by the Mass Wildlife Fish Hatchery in Sandwich, MA, USA (Massachusetts Division of Fisheries and Wildlife). Tagging and handling of Brook Trout was similar to Alewife, except that PIT tags were surgically implanted to improve tag retention and sex was not determined. Each of these two tagging methods has been evaluated and there appears to be no substantial effect on behaviour or performance (Zydlewski et al. Citation2001; Castro-Santos Citation2005; Castro-Santos and Vono Citation2013). Brook Trout were held in circular tanks (1 m in diameter) for two to four days before the experimental trials and were fed commercial fish pellets and earth worms. The study was conducted during the upstream migration periods to the spawning sites in April for Alewife and in September for Brook Trout, respectively.
Experimental setup
The experiments were performed in two paired adjacent hydraulic open channels (18.0 × 0.8 × 0.8 m) with a common head tank (3.0 × 2.4 m) and a staging area (9.8 × 2.4 m) ((a)). Both channels were set at a 3.5% slope. The channels, comprised a wooden frame with plywood floors and walls, were built within a large concrete outdoor flume. One channel was fitted with vertical baffles, while the other channel was fitted with horizontal baffles. The baffles were made of wood, in the form of quarter-rounds, with a radius of 0.09 m. The baffles were attached every 0.5 m to either the floor or the walls of the channels (depending on treatment). First baffles were situated right at the edge of channel entrances.
Figure 1. Schematic asymmetric view of the experimental stream channels where vertical and horizontal baffles are seen in the left and right channels, respectively.
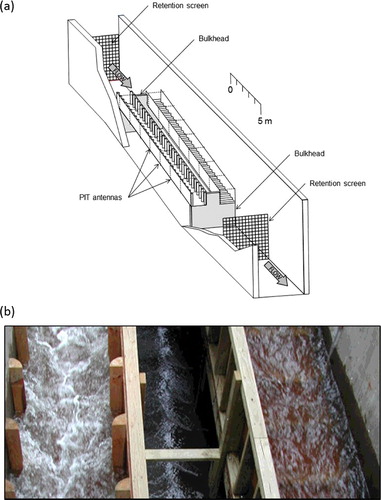
Experiments were conducted at high- and low-flow conditions. At high flow (approximately 0.63 m3/s), water depth in both channels was 0.4 m and flow was supercritical with a bulk Froude number of Fr = 1.18 and a bulk Reynolds number of Re = 8.5 × 10⁵ ((b)). Wall roughness between the two channels was matched as the length of the bed-mounted horizontal baffles (0.8 m) was equal to the total submerged length of the side wall mounted baffles (0.8 m) at a given section. The matched roughness between the two channels produced similar magnitudes of turbulence (i.e. Reynolds shear stresses), yet, different spatial distributions and characteristics (i.e. direction of dominant turbulent momentum exchange). At lower flows, roughness was not matched as the width of the channels could not be adjusted. Therefore, the length of the horizontal baffles remained at 0.8 m across the bottom of one channel while the combined submerged portion of the vertical baffles (on the side walls) was only 0.5 m in the paired channel. This resulted in differences in flows, mean velocities, and water depths between the paired channels. The vertical baffled channel had a supercritical flow of approximately 0.37 m3/s and a mean depth of 0.25 m (Fr = 1.2 and Re = 6.8 × 10⁵) while the horizontal baffled channel had a subcritical flow of approximately 0.31 m3/s and a depth of 0.3 m (Fr = 0.76 and Re = 4.7 × 10⁵).
Water to the stream channels was supplied via a control gate from an adjacent power canal fed by the Connecticut River. Water entered into a headtank before flowing through the channels and exiting into the staging area. To ensure steady flow conditions during a given trial, water depth and temperature were monitored every 1 min using two HOBO® water depth loggers (model U20-001-01, Onset, Bourne, MA, USA) that were installed in the headtank and the staging area. A third pressure sensor was used to monitor atmospheric pressure changes to allow for subsequent corrections to the water level data. Water levels above the channels’ inverts for high- and low-flow experiments were approximately 0.67 and 0.48 m, respectively. The standard deviation of the recorded water levels during the experiments was less than 0.01 m. Flow was discharged through two gates (2 m × 2 m) situated at the downstream end of the staging area. Water depths could be controlled throughout the entire system by adjusting the headtank and monitoring water levels against a scale installed on the flume walls.
Given that the two channels shared a common downstream staging area, fish could choose to enter either channel or remain in the staging area. The staging area contains several zones of quiescent flow where fish would rest and recover from attempts. Fish passage in the stream channels was monitored using an array of 16 rectangular PIT antennas, graduating each channel into 2.5 m increments. Each antenna monitored the full cross section of a channel, detecting PIT tags within 0.5 m of its cross-sectional plane. Each antenna was driven by an individual reader (TIRIS Series 2000 reader with a RF module emitting a 134.2 kHz electromagnetic energizing signal through an antenna; Texas Instruments, Austin, TX, USA). Readers were synchronized to charge and read simultaneously at 14 Hz, and PIT code, antenna, and time were recorded to the nearest 0.01 s by a single laptop computer running Multireader 4.0 software (Castro-Santos Citation2002).
Experimental procedure
Fish were held in six flow-through tanks (2 m × 8 m) that were adjacent to and hydraulically connected with the staging area. At the beginning of each trial, a retaining screen was lowered upstream of this connection to prevent access to the channels. Groups of 91 Alewife and 38 Brook Trout were crowded from these holding ponds into the staging area. Flows were then brought to trial conditions and the retaining screen was raised, allowing fish to gain access to the channels. For each species, four trials were conducted under each flow condition (low/high) lasting for circa 5.5 h (16 trials in total). Each group of fish was tested under the low- and high-flow conditions. The order of the test was selected at random.
Velocity measurements
The velocity field was measured using an acoustic Doppler velocimeter (ADV) (Sontek, San Diego, CA, USA) that measures the three velocity components in a sampling volume (diameter 6 mm, height 9 mm) located 0.05 m from the ADV transmitter. Measurements were taken at a frequency of 25 Hz for a duration of 60 s at each location approximately 9 m from the headtank. For each flow condition, horizontal measurement planes were sampled on a Δx = 0.1 m (longitudinal) by Δy = 0.1 m (lateral) grid starting at the downstream face of the baffle and continuing for a longitudinal distance of x = 0.5 m (). For the high-flow experiments, three horizontal planes were sampled at z = 0.05, 0.15, and 0.25 m, while for the low-flow experiments, two horizontal planes were sampled at z = 0.05 and 0.15 m, where z is the vertical distance from the floor. Measurements closer to the water surface were not possible as the ADV probe head must be submerged at a sufficient distance to avoid air entrainment and due to the blanking zone of the ADV (i.e. 0.05 m from the transmitter).
Figure 2. Plan view schematic of ADV measurement locations (black dots) for the (a) horizontal and (b) vertical baffled channels. Grey shading indicates baffle locations.
ADV velocity time series were processed using in-house MATLAB algorithms and MITT (MacVicar et al. Citation2014). Data series were despiked using the phase-space method as suggested by Goring and Nikora (Citation2002). Identified spikes were replaced using linear interpolation of adjacent time-step (nonspike) values. On average, 8.2% of the signal was replaced by interpolated values. Visual inspection of time series and velocity spectra was used to eliminate highly spiky and flawed time series. The ADV mean signal correlation values, COR, were likewise used to eliminate poor quality time series. While a threshold of COR = 70% is recommended to avoid introducing measurement bias (Lane et al. Citation1998), this threshold was found to be too restrictive as it eliminated most measurements in zones of high shear (close to the baffles). In order to preserve these crucial measurements, a threshold of COR = 50% was used. While not ideal, a similar relaxation of the recommended COR threshold has been performed by other researchers (Strom and Papanicolaou Citation2007; Lacey and Rennie Citation2012). In order to avoid biased results, only theoretically noise-free turbulent statistics were analysed in the current study (i.e. time-averaged velocities, ,
,
and Reynolds shear stresses,
,
,
), where ρ is the density of water and u, v, and w are, respectively, the instantaneous longitudinal, lateral, and vertical velocity components in m/s. The overbar represents time averaging, while the prime represents the fluctuating velocity components (i.e.
).
Fish data and statistical analysis
Passage success was evaluated in terms of (1) attraction (first and subsequent attempts to ascend a channel) and (2) maximum distance of ascent (Dmax; m) under each flow condition. An attempt was defined as gap of more than 30 s between detections at the channel entrance. Because trials were of finite duration, and because the channels were of finite length, both these variables were subject to censoring. This means that fish that failed to stage an attempt, for example, were still included in the analysis, forming part of the population from which the overall attraction and performance were calculated. Survival analysis methods are appropriate for analyzing these types of data and we followed the methodology developed by Castro-Santos (Citation2004).
For each fish, the timing of the first and the subsequent attempts were determined. Subsequent attempts were calculated as the time lag between the attempt initiation and the end of the previous attempt. The interval between the last attempt and the end of the trial was included as a censored observation of the final attempt time; for fish that staged no attempts, this means that the trial duration was included as a censored observation for the first attempt. Using this approach, data were included from all available fish, whether or not they actually entered the channel. First attempts were treated separately from subsequent attempts because first attempts may include some disproportionate effect of handling time and subsequent attempts may be influenced by effort expended and recovery time from previous attempts. To ensure reasonable sample sizes, only the first four attempts were considered for Alewife and one to five attempts for Brook Trout for both attempt and failure rate analyses.
Performance on a given attempt was described as Dmax (m), the maximum distance ascended by each fish. Fish that passed the entire 18 m of channel and entered the headtank were censored. Additionally, for every additional attempt, the Dmax of the previous attempt was identified and is hereafter referred to as previous attempt distance (prevDmax, m) for the respective attempt.
Possible effects of repeated use of fish in the trials under low- and high-flow conditions, respectively, were tested by including a binary variable (Run) that indicated whether it was the first or second time an individual fish had been introduced to the experimental arena.
Survival analysis was used to model (1) attempt rate or the proportion attempting per unit time and (2) failure rate or the proportion failing per unit distance (Allison Citation2010). We developed a predictive model using Proportional Hazards (Cox) regressions including explanatory variables such as channel configuration, flow condition, temperature, sex (only for Alewife), fish origin (only for Brook Trout), body length, Run, recovery time, and their interaction terms. Regression models were stratified by attempts. This approach allows the use of all attempts while avoiding pseudo-replication (Allison Citation2010). In the analysis of subsequent attempts, previous attempt distance (prevDmax) was added in the model as a potential explanatory variable.
Separate models were conducted for each channel because once a fish entered a channel, it was automatically censored in the other channel for the respective attempt (competing risk structure (Castro-Santos and Haro Citation2003)). We ranked the models using Akaike's information criterion (AIC) and selected the best-fitting model by choosing the highest ΔAIC of the competing models (Burnham and Anderson Citation2002). ΔAIC was calculated between the respective null model and the alternative, more complex models:(1)
All statistical tests were performed using SAS 9.1 software (SAS Institute Inc., Cary, NC, USA).
Results
Experiments were conducted with 547 adult Alewife (mean fork length LF of 228.5 ± 11.89 mm; 267 females and 280 males) and 158 Brook Trout (mean LF of 161.5 ± 52.0 mm; 82 wild and 76 hatchery-reared). Each fish was tested once under the low-flow condition and once under the high-flow condition. Water temperature during the experiments reflected ambient river temperature and ranged from 13.3 to 17.9 °C in April during the Alewife trials and from 15.3 to 18.4 °C in September during the Brook Trout trials.
Flow structure
The flow structure, described as spatially averaged longitudinal mean velocities by measurement plane (z = 0.05 m, 0.15 m, and 0.25 m), where the angled brackets represent spatial averaging over each measurement plane, was notably different between the paired channels (). The horizontal baffles create a vertical velocity gradient, which is most evident in the high-flow condition with
= 0.15 m/s near the bed at z = 0.05 m and
= 2.45 m/s at z = 0.25 m (). Values of
for the vertical baffled channel are more homogeneous throughout the water column with slightly smaller values close to the bed (
= 1.9 m/s compared to
= ∼2 m/s) as is expected due to bed friction (). The spatial distributions for the low-flow experiments are not shown, as they show similar spatial patterns as for the high-flow condition. While
is reduced in the low-flow condition, Reynolds shear stresses are of similar order of magnitude and are located in similar positions relative to the baffles for both the horizontal and vertical baffled channels. In –, velocity and position coordinates follow the right-hand rule. For the high-flow horizontal baffled channel (), slightly negative longitudinal velocities
= −0.045 m/s were measured near the bed behind the baffle at x, z = (0.1 m, 0.05 m) suggesting that reattachment of the boundary layer occurs between x = 0.1 m and 0.2 m. A maximum value of
= 2.53 m/s was measured in the upper plane (z = 0.25 m). Closer to the side wall, flow was directed towards the centre (negative
) with minimum values of
= −0.069 m/s. The spatial distribution of
shows a predictable intuitive trend of flow being forced up over the baffles and down towards the bed in the wake zone. This pattern is clearly observed for the z = 0.05 plane and can be seen in the upper measurement planes as well.
Table 1. Spatially averaged mean longitudinal velocities, and Reynolds shear stresses,
,
,
, for each measurement plane in the horizontal and vertical baffled channels under low- and high-flow conditions.
Figure 3. Plan views of time-averaged velocities, ,
,
in m/s over three horizontal planes z = 0.05, 0.15, and 0.25 m for the horizontal baffled channel at high-flow conditions. Flow is from left to right.
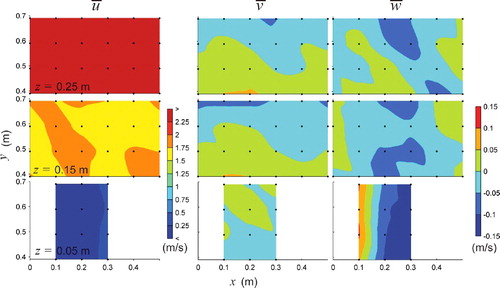
Figure 4. Plan views of time-averaged velocities, ,
,
in m/s over three horizontal planes z = 0.05, 0.15, and 0.25 m for the vertical baffled channel at high-flow conditions. Flow is from left to right.
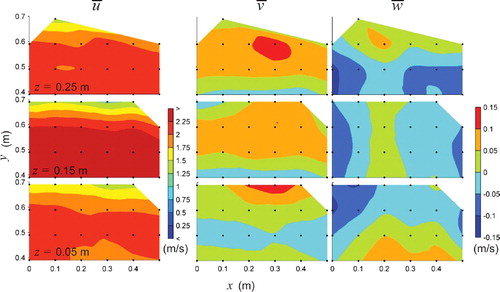
Figure 5. Plan views of Reynolds shear stresses, ,
,
in N/m2 over three horizontal planes z = 0.05, 0.15, and 0.25 m for the horizontal baffled channel at high-flow conditions. Flow is from left to right.
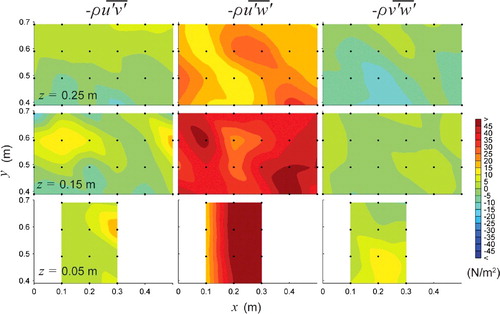
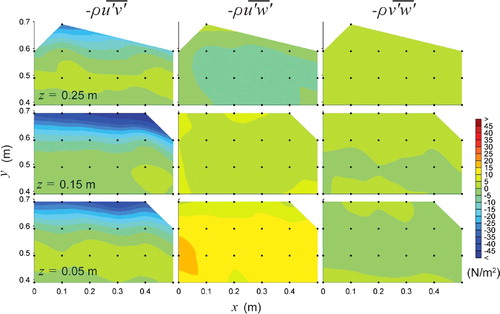
Figure 6. Plan views of Reynolds shear stresses, ,
,
in N/m2 over three horizontal planes z = 0.05, 0.15, and 0.25 m for the vertical baffled channel at high-flow conditions. Flow is from left to right.
For the vertical baffled channel (high flow), the spatial distribution of is similar for all sampling planes (). A large velocity gradient is observed on the left side of the channel (y = 0.6–0.7 m) adjacent to the left-side vertical baffles (see (b) for baffle placement relative to sampling points). Due to the physical placement of the vertical baffles, it was impossible to obtain ADV measurements in the recirculation zone behind the baffles, where negative
is expected. The minimum value of
observed was
= 1.19 m/s, which was likely in or just adjacent to the shear layer created by the baffle. Maximum values of
= 2.51 m/s were observed in the middle plane (z = 0.15 m). This value was very similar to the maximum value in the horizontal baffled channel for the same flow condition. The occurrence of maximum
values in the middle plane instead of the upper plane was likely due to secondary circulation and the highly complex flow induced by the vertical baffles. This can be attested to by the spatial distributions of
and
(). Values of
were in general positive close to the left side of the channel (y = 0.6–0.7 m) with values attaining
= 0.13 m/s (5% of the maximum
). At z = 0.25,
was positive near the wall and negative at the channel centre (minimum value of
= −0.11 m/s), suggesting that high-velocity upper layer fluid was being driven downward near the centreline due to secondary circulation. Near the bed at z = 0.05 m, the pattern was inversed (positive
near the centreline of the channel and negative
closer to the side). The alternating patterns of
suggest the occurrence of two stacked counter-rotating secondary cells (i.e. a bottom vortex and a surface vortex) as described by Rodriguez and Garcia (Citation2008), yet, the sampling grid used herein was not fine enough to fully characterize the secondary circulation.
Reynolds shear stresses represent the turbulent flux of fluid momentum exchange and give an indication of the direction of the dominant vortices in the flow (spatial mean values per measurement plane are presented in ). A clear distinction in the dominant Reynolds shear stress was observed with treatment (i.e. horizontal versus vertical baffles). For the horizontal baffled channel, the principal Reynolds stress dominated throughout the water column (), while with the vertical baffle treatment
dominated near the side wall and away from the bed ().
For the horizontal baffled channel, spatial mean values of were generally an order of magnitude higher than for
and
(see ). Maximum values of
= 65.39 N/m2 occurred close to the bed in the horizontal baffle wake zone and diminished towards the free surface where
equalled 49.0 and 31.7 N/m2 for z = 0.15 m and z = 0.25 m, respectively.
For the vertical baffled channel (high flow), high negative values of were observed over all measurement planes along the side wall with a minimum value of
= −61.35 N/m2 for the middle plane (z = 0.15 m). Comparisons of the spatial averages,
, for each plane showed that
dominated the middle plane yet was of similar magnitude as
for the lower plane (z = 0.05) due to bed generated of turbulence. The lower value of
for the upper measurement plane (z = 0.25 m) was in part due to the missing measurements close to the side wall (which were removed from the data analysis due to poor signal correlation).
First and repeated attempts in the stream channels
During the experimental trials, 50.3% of the Alewife staged at least one attempt to ascend one of the channels. Subsequently, 31.2% of the Alewife staged a second, 12.9% a third, and 5.7% a fourth attempt. Alewife entered the vertical baffled channel at twice the rate of entry into the horizontal channel (). Interestingly, Alewife needed an adaptation period of more than 2 h before attempting to swim into either channel ().
Table 2. Number of first and subsequent attempts that Alewife and Brook Trout staged during the experimental trials. Additionally, the number and percentage of attempts separated by the horizontal and vertical stream channels and their factorial (vertical/horizontal) difference are given.
Figure 7. Relationship between the elapsed time (min) and the percentage of Alewife entering the (a) horizontal and (b) vertical baffled channels under low (in grey) and high (in black) flow conditions. Solid and dotted lines indicate male and female fish, respectively.
For Brook Trout, 33.5% of the individuals staged at least one attempt to enter either one of the experimental stream channels. In addition, 26.8% of the Brook Trout staged a second, 19.8% a third, 12.5% a fourth, and 7.5% a fifth attempt. Similar to Alewife, Brook Trout staged 2.6-times more attempts into the vertical baffled channel in comparison to the horizontal channel (). In contrast to Alewife, however, Brook Trout had a shorter adaptation period to the experimental setting of circa 1 h before entering the stream channels ().
Figure 8. Relationship between the elapsed time (min) and the percentage of hatchery (in grey) and wild (in black) Brook Trout entering the (a) horizontal and (b) vertical baffled channels. Solid lines represent larger fish (>230 mm) and dotted lines smaller fish (<120 mm).
Attraction models
Attraction of Alewife to both channels increased with flow ((a,b) and ). In addition, males were more likely to enter a channel than females (). Fish length, which was of narrow range for Alewife, had no effect on attraction. Alewife from the first Run repeatedly entered the horizontal channel in subsequent attempts. However, entry into the horizontal channel decreased for experienced alewife ().
Table 3. First and repeated attempt rate models selected using the highest scoring ΔAIC for Alewife and Brook Trout in the horizontal (HOR = 0) and vertical (VER = 1) channels.
For the first attempts, the models with the highest ΔAIC scores for both the horizontal and vertical baffled channels included flow condition and sex (). The best-fitting model for repeated attempts in the horizontal channel also included prevDmax of the first attempt as well as the three-way interaction term – channel configuration × flow condition × prevDmax. Effect of prevDmax on attraction was variable among attempts with estimates having large standard errors and should be viewed with caution.
For Brook Trout, the first attempt was not affected by flow condition but repeated attraction to both channels increased with decreasing flow (); note that this is the opposite of the pattern observed in Alewife. With increasing temperature, Brook Trout displayed a higher attraction particularly to the vertical baffled channel. Wild Brook Trout displayed a higher attraction to the channels than hatchery fish and larger fish staged more first attempts than smaller fish ((a,b)). Fish from the first Run entered at a higher rate in the horizontal baffled channel than experienced fish from the second Run. Longer distances achieved in previous attempts resulted in reduced rates of subsequent attempts.
Performance models
In general, Alewife performed better in the horizontal channel with decreased flow and achieved the higher Dmax in the first-attempt swimming in the horizontal channel under the low-flow condition (). Fish body length (which was of narrow range) and sex had no effect on the achieved Dmax in the first attempt (). During the repeated attempts, Alewife achieved higher Dmax with increasing temperatures but lower Dmax at higher flows.
Figure 9. Relationship between the maximum distance of ascent (Dmax, m) during first attempt of Alewife and the percentage of Alewife succeeding to migrate in the horizontal (solid line) and vertical baffled channels (dotted line) under low (in grey) and high (in black) flow conditions.
Table 4. Best-fitting Cox models of distance of ascent (Dmax) for Alewife and Brook Trout selected using the highest ΔAIC between competing models. These models measure failure rate, meaning that negative values represent a greater Dmax.
Brook Trout also succeeded to swim further up the channels under low-flow conditions and larger fish ascended further up the channels than smaller fish (). Channel configuration had no significant effect on the first attempt in Brook Trout. However, during repeated attempts, Brook Trout performance improved when swimming in the vertical baffled channel ().
Figure 10. Relationship between the maximum distance of ascent (Dmax, m) during first attempt and the percentage of Brook Trout succeeding to migrate under low (in grey) and high (in black) flow conditions. Solid lines signify larger Brook Trout (>230 mm) and dotted lines smaller Brook Trout (<120 mm).
Discussion
In this study, volitional performance of migratory Alewife and Brook Trout was quantified in turbulent flows created by horizontally and vertically oriented baffles in rectangular box culverts. This stands in contrast to former studies in which ascent performance was measured under very artificial homogenous flow environments. The two-channel baffle treatments had a marked effect on flow structure, creating differently positioned low zones and variations in the distributions of Reynolds shear stresses. Reynolds shear stresses represent the turbulent momentum exchange and indicate the dominant direction of vortices in the flow. The high magnitudes of
over all the measurement planes for the horizontal baffled channel indicate a dominance of laterally oriented “roller” vortices shedding from the baffles and advecting to the surface. For the vertical baffled channel, the high magnitudes of
near the side wall (y = 0.55–0.7 m) indicate a dominance of vertical vortices spinning in the counterclockwise direction. The elevated magnitude of
do not appear to propagate to the centre of the channel where the magnitudes of all Reynolds shear stress terms are similar. Interestingly, the estimated
values are of similar order of magnitude to those observed behind a pebble cluster in a gravel-bed stream where a maximum value of
= 25.0 N/m2 was observed (Lacey and Roy Citation2008).
Under low-flow conditions, the roughness was not matched as the vertical baffled channel was approximately 38% less rough than the horizontal baffled channel resulting in a variation in discharge of 17% between the two channels. The lower discharge/velocities in the horizontal baffled channel under the low-flow condition may consequently have influences on the attraction and ascent performance results.
As hypothesized, a higher attraction to the channel with vertical baffles that created vertically oriented vortices was observed for both fish species in both flow conditions. Consequently, our findings are consistent with what one would expect if fish are attracted by vortices that match the body undulation of the swimming fish. Interestingly, although Alewife staged more attempts in the vertical baffled channel, fish actually achieved higher Dmax swimming in the horizontal baffled channel under low-flow conditions likely due to lower flow velocities. However, this performance might not be related to a benefit drawn from the horizontally oriented vortices because Alewife swam further away from the floor-mounted baffles under high-flow conditions, which was not an option under low-flow conditions. This behaviour suggested that Alewife seem to avoid strong horizontal vortices, perhaps related to the fact that they are an ocean-dwelling, schooling species that is not particularly adapted to bed-generated turbulent flow. Avoidance and disorientation in highly turbulent flow has also been observed for other clupeids such American shad (Larinier and Travade Citation2002; Haro and Castro-Santos Citation2012). In contrast, Brook Trout frequently sought shelter behind both horizontal and vertical baffles and therefore reached higher Dmax particularly in repeated attempts. As stream-dwelling fish, Brook Trout are confronted by bed-generated highly turbulent flows to which they may continuously correct their body position to adjust to the surrounding flow field. The increased Dmax in repeated attempts for Brook Trout swimming in the vertically oriented vortices is also consistent with observations by Liao et al. (Citation2003b), who observed that Rainbow Trout (Oncorhynchus mykiss Walbaum) extract energy from the vertically oriented vortices to enhance their ascent performance. Optimization of attraction to and performance in a box culvert could potentially be achieved by adjusting both size and spacing of the vertical baffles design to the fish size and behaviour of the targeted species.
The present study showed that fish with former experience may have a decreased attraction towards the channels. The fact that fish may stage multiple attempts when ascending a velocity challenge and have higher attraction under certain hydraulic configuration has been neglected for a long time in the field of fish passage, which has focused principally on the absolute swimming capacity of fish. It has been demonstrated that fish are likely to abandon an attempt before exhaustion and subsequently stage multiple attempts (Castro-Santos Citation2004; Haro et al. Citation2004). Consequently, the interplay between attraction and performance is crucial for successful fish passage design and underlines the importance of maximizing attraction to the passage structure entrance (Castro-Santos Citation2004). With multiple attempts to enter the channels, the probability of successful fish passage increases by giving the fish another opportunity to swim through the channel. Consequently, for Brook Trout with a similar performance in both channels but a much greater attraction to the vertical baffled channel, a largely superior passage success is expected in structures that produce vertically oriented vortices.
The results of the time-to-event (survival analysis) approach highlighted some important differences in the effect of the flow conditions on the attempts between the two species. While Alewife exhibit an increase in attraction with increasing flow, changes in flow and velocity had no effect on first attempts and led to a decline in the repeated attempts for Brook Trout. Similar inconsistent relationships have been observed for different species by Castro-Santos (Citation2004) and might likely be due to increased attraction with discharge for Alewife, which are ascending streams during spring period when discharges are high. In contrast, Brook Trout seem to have reduced attraction, which might reflect some ability to anticipate a potential barrier. With a decrease in flow, both species achieved higher Dmax. However, it should be emphasized that Dmax may not represent a locomotory event terminated by fatigue or physiological exhaustion (Castro-Santos Citation2004; Haro et al. Citation2004). Fish did not display any noticeable signs of fatigue at the end of the trial nor was any noteworthy mortality observed between or after the trials. In addition, recovery time did not have a direct effect on either attraction or performance. However, fish that showed higher Dmax in previous attempts seemed to attain reduced Dmax in following attempts, which may be a sign of fatigue or incomplete recovery. Whether the effect of flow on the attraction resulted directly from the changes in flow or with the associated changes in velocity cannot be distinguished in the present study. Future studies should attempt to test the influence of these variables separately.
Effects of temperature on aerobic swimming performance of fish are well established (Beamish Citation1978; Brett and Groves Citation1979). Correlations between temperature and attraction were observed, but the effect was not universal. Interestingly, for Alewife, no temperature effect on the attraction was observed; whereas Brook Trout exhibited an increase in first attempts in the vertical channel with increasing temperature in the horizontal channel. Alewife achieved longer distances in repeated attempts with increasing temperature. Variable or no effects of temperature on fish performance were also observed by Haro et al. (Citation2004) and might be due to the fact that sprint swimming is to a large extent fuelled by anaerobic metabolism and not effected by temperature within the temperature optimum of the respective species (Goolish Citation1991; Fraser and Huntingford Citation1994; Castro-Santos Citation2004).
The effect of sex was only tested for Alewife. Interestingly, males were more motivated swimmers than females but no differences in Dmax were observed between sexes, suggesting differences in attraction but not in swimming capacity.
For practical reasons, experimental studies are often performed with fish of hatchery origin. Several studies have demonstrated that cultured fish may diverge significantly from their wild fish population in behaviour, morphometrics, and energetics (Fleming et al. Citation1994; Johnsson et al. Citation2001; Enders et al. Citation2004). In the present study, differences in attraction were observed between wild and hatchery Brook Trout. Wild fish showed substantially higher attraction to the stream channels than hatchery fish; however, no effect was identified in the distance of ascent. Consequently, some caution should be taken when applying swimming performance models obtained from hatchery to wild fish and vice versa (Ney Citation1993).
Numerous studies have demonstrated the effect of fish size on the swimming performance (Bainbridge Citation1958; Brett Citation1965). No effect of fish size on the attraction or ascent performance was observed for Alewife, most likely due to the small range in body length between the fish tested in the experiments. However, larger Brook Trout staged more attempts and achieved higher Dmax than smaller fish.
Although this was a controlled laboratory study, the results highlight that survival analysis is a useful tool for the evaluation of passage success of species passing over or through anthropogenic structures during their migration. Anthropogenic structures may include culverts, dams or weirs that potentially delay migration of adult and juvenile anadromous fishes or disrupt feeding and spawning migration of potamodromous fishes. Additionally, survival analysis allows identifying explanatory variables influencing passage success, fish attraction and performance. The capacity to predict fish performance under various environmental conditions may help in effectively managing and restoring threatened migratory fish populations. The purpose of the models presented here is not only to identify explanatory variables that affect the attraction and performance of fish but also to analyze the effects in a fashion that allows fisheries managers and hydraulic engineers to predict fish passage in similar settings.
Working in an experimental channel has some limitations, for example, in regard to availability of test organism. Consequently, the attraction and ascent performance have been mainly studied on adult salmonids. Subsequently, the information gained here on attraction and performance of an upstream-migrating non-salmonid species (Alewife) and different life-stages of a salmonid species (juveniles versus adults) is a crucial contribution to the understanding of fish behaviour and performance in culverts and fishways. For laboratory studies, it is often challenging to produce conditions, which are transferrable to the prototype (real) scale. The large size of the artificial channels used herein (0.8 m wide) helps with the transferability of our results, since meter wide box culverts are commonly used under roadways. A common constraint of all hydraulic studies is acquiring sufficient velocity measurements to characterize the flow field. This is often a trade-off between sampling time and desired detail. For our study, sufficient velocity measurements were obtained to show the differences in flow structure between the two treatments, yet, additional measurement locations close to the wall (behind the baffles) would have provided a better description of the wake zone. Finally, this study, while limited in the number of species tested and trials/baffle geometries, suggests that a vertical baffle design in box culverts may attract more fish over bottom-mounted baffles that create horizontal vortices. Fish seem more likely to enter the vertical design, and more research is needed to confirm that this would lead to higher probability of passage as the study remains inconclusive in regard to distance of ascent. In addition, identification and characterization of fish attraction and performance over a wider range of fish species, designs and hydraulic configurations should be the object of future studies.
Acknowledgments
The authors would like to thank the staff at the USGS-BRD S.O. Conte Anadromous Fish Research Center, in particular John Noreika for valuable assistance in the experimental design, Phil Rocasah for directing the construction, and Steve Walk for organizing the experimental instrumentation. The authors would also like thank the anonymous reviewers whose comments improved the quality of the paper. All experiments, including the use of Alewife and Brook Trout, conformed to the U.S. Geological Survey Leetown Science Center animal care protocol and were approved by the Institutional Animal Care and Use Committee.
Disclosure statement
No potential conflict of interest was reported by the authors. Any use of trade, product, or firm names is for descriptive purposes only and does not imply endorsement by the U.S. or Canadian Government.
Additional information
Funding
References
- Allison PD. 2010. Survival analysis using SAS: a practical guide. 2nd ed. Cary (NC): SAS Institute; p. 336.
- Bainbridge R. 1958. The speed of swimming of fish as related to size and to the frequency and amplitude of the tail beat. J Exp Biol. 35:109–133.
- Beamish FWH. 1978. Swimming capacity. In: Hoar WS, Randall JR, editors. Fish physiology - locomotion. New York: Academic Press; p. 101–187.
- Behlke CE, Kane DL, Mclean RF, Travis MD. 1991. Fundamentals of culvert design for passage of weak swimming fish. Fairbanks (AK): Alaska Department of Transportation and Public Facilities. FHWA-AK-RD-90-10.
- Brett JR. 1965. The relation of size to rate of oxygen consumption and sustained swimming speed of sockeye salmon (Oncorhynchus nerka). J Fish Res Board Can. 22:1491–1501.
- Brett JR, Groves DD. 1979. Physiological energetics. In: Hoar WS, Randall JR, Brett JR, editors. Fish physiology - bioenergetics and growth. New York: Academic Press; p. 279–352.
- Burnham KP, Anderson DR. 2002. Model selection and multi-model inference: a practical information-theoretic approach. 2nd ed. New York: Springer.
- Castro-Santos T. 2002. Swimming performance of upstream migrant fishes: new methods, new perspectives. Amherst: University of Massachusetts.
- Castro-Santos T. 2004. Quantifying the combined effects of attempt rate and swimming capacity on passage through velocity barriers. Can J Fish Aquat Sci. 61(9):1602–1615. doi:10.1139/F04-094.
- Castro-Santos T. 2005. Optimal swim speeds for traversing velocity barriers: an analysis of volitional high-speed swimming behavior of migratory fishes. J Exp Biol. 208:421–432.
- Castro-Santos T, Haro A. 2003. Quantifying migratory delay: a new application of survival analysis methods. Can J Fish Aquatic Sci. 60:986–996.
- Castro-Santos T, Haro A. 2006. Biomechanics and fisheries conservation. In: Shadwick RE, Lauder GV, editors. Fish physiology. New York: Academic Press; p. 469–523.
- Castro-Santos T, Haro A, Walk S. 1996. A passive integrated transponder (PIT) tagging system for monitoring fishways. Fish Res. 28(3):253–261. doi:10.1016/0165-7836(96)00514-0
- Castro-Santos T, Sanz-Ronda FJ, Ruiz-Legazpi J. 2013. Breaking the speed limit - comparative sprinting performance of brook trout (Salvelinus fontinalis) and brown trout (Salmo trutta). Can J Fish Aquat Sci. 70(2):280–293. doi:10.1139/cjfas-2012-0186.
- Castro-Santos T, Vono V. 2013. Post-handling survival and PIT-Tag retention by alewives - a comparison of gastric and surgical techniques. N Am J Fish Manage. 33:790–794.
- Clay CH. 1995. Design of fishways and other fish facilities. Boca Raton (FL): Lewis Publishers.
- Cotel AJ, Webb PW, Tritico H. 2006. Do brown trout choose locations with reduced turbulence? Trans Am Fish Soc. 135(3):610–619. doi:10.1577/T04-196.1
- Coutant CC. 1998. Turbulent attraction flows for juvenile salmonid passage at dams. Oak Ridge (TN): Oak Ridge National Laboratory. ORNL/TM-13608.
- Coutant CC. 2001. Turbulent attraction flows for guiding juvenile salmonids at dams. Am Fish Soc Symp. 26:57–77.
- Enders EC, Boisclair D, Roy AG. 2003. The effect of turbulence on the cost of swimming for juvenile Atlantic salmon (Salmo salar). Can J Fish Aquat Sci. 60:1149–1160. doi:10.1139/F03-101
- Enders EC, Boisclair D, Roy AG. 2004. Differences in the costs of habitat utilization between wild, farmed, and domesticated juvenile Atlantic salmon (Salmo salar). Can J Fish Aquat Sci. 61:2302–2313. doi:10.1139/F04-211
- Enders EC, Boisclair D, Roy AG. 2005. A model of total swimming costs in turbulent flow for juvenile Atlantic salmon (Salmo salar). Can J Fish Aquat Sci. 62:1079–1089. doi:10.1139/F05-007
- Everest FH, Chapman DW. 1972. Habitat selection and spatial interaction by juvenile Chinook salmon and steelhead trout in two Idaho streams. J Fish Res Board Can. 29:91–100.
- Fleming IA, Jonsson B, Gross MR. 1994. Phenotypic divergence of sea-ranched, farmed, and wild salmon. Can J Fish Aquat Sci. 51:2808–2824.
- Fraser NHC, Huntingford FA. 1994. The effect of temperature on the burst swimming performance of juvenile Atlantic salmon parr. J Fish Biol. 45(Suppl. A):247. doi:10.1111/j.1095-8649.1994.tb01096.x
- Gibson RJ, Haedrich RL, Wernerheirn CM. 2005. Loss of fish habitat as a consequence of inappropriately constructed stream crossings. Fisheries. 30:10–17.
- Goodwin RA, Nestler JM, Anderson JJ, Weber LJ, Loucks DP. 2006. Forecasting 3-D fish movement behavior using a Eulerian–Lagrangian-agent method (ELAM). Ecol Model. 192(1–2):197–223. doi:10.1016/j.ecolmodel.2005.08.004
- Goolish EM. 1991. Anaerobic swimming metabolism of fish: sit-and-wait versus active forager. Physiol Zool. 64(2):485–501.
- Goring DG, Nikora VI. 2002. Despiking acoustic Doppler velocimeter data. J Hydraul Eng. 128(1):117–126.
- Haro A, Castro-Santos T. 2012. Passage of American shad: paradigms and realities. Mar Coast Fish. 4(1):252–261. doi:10.1080/19425120.2012.675975
- Haro A, Castro-Santos T, Noreika J, Odeh M. 2004. Swimming performance of upstream migrant fishes in open-channel flow: a new approach to predicting passage through velocity barriers. Can J Fish Aquat Sci. 61(9):1590–1601. doi:10.1139/F04-093
- Hendry K, Cragg-Hine D, O'Grady M, Sambrook H, Stephen A. 2003. Management of habitat for rehabilitation and enhancement of salmonid stocks. Fish Res. 62(2):171–192. doi:10.1016/S0165-7836(02)00161-3
- Hinch SG, Rand PS. 2000. Optimal swimming speeds and forward-assisted propulsion: energy-conserving behaviours of upriver-migrating adult salmon. Can J Fish Aquat Sci. 57(12):2470–2478. doi:10.1139/cjfas-57-12-2470
- Johnsson JI, Höjesjö J, Fleming IA. 2001. Behavioural and heart rate responses to predation risk in wild and domesticated Atlantic salmon. Can J Fish Aquat Sci. 58(4):788–794.
- Lacey RWJ, Neary VS, Liao JC, Enders EC, Tritico HM. 2012. The IPOS framework: Linking fish swimming performance in altered flows from laboratory experiments to rivers. Riv Res Appl. 28(4):429–443. doi:10.1002/rra.1584
- Lacey RWJ, Rennie CD. 2012. Laboratory investigation of turbulent flow structure around a bed-mounted cube at multiple flow stages. J Hydraul Eng. 138(1):71–84.
- Lacey RWJ, Roy AG. 2008. Fine-scale characterization of the turbulent shear layer of an instream pebble cluster. J Hydraul Eng. 137(7):925–936.
- Lane SN, Biron PM, Bradbrook KF, Butler JB, Chandler JH, Crowell MD, McLelland SJ, Richards KS, Roy AG. 1998. Three-dimensional measurements of river channel flow processes using acoustic Doppler velocimetry. Earth Surf Process Landforms. 23(13):1247–1267. doi:10.1002/(SICI)1096-9837(199812)23:13<1247::AID-ESP930>3.0.CO;2-D
- Larinier M, Travade F. 2002. The design of fishways for shad. Bull Fr Pech Piscic. 364:135–146.
- Liao JC 2007. A review of fish swimming mechanics and behaviour in altered flows. Phil Trans R Soc B. 362(1487):1973–1993. doi:10.1098/rstb.2007.2082
- Liao JC, Beal DN, Lauder GV, Triantafyllou MS. 2003a. Fish exploiting vortices decrease muscle activity. Science. 302(5650):1566–1569. doi:10.1126/science.1088295
- Liao JC, Beal DN, Lauder GV, Triantafyllou MS. 2003b. The Kármán gait: novel body kinematics of rainbow trout swimming in a vortex street. J Exp Biol. 206(6):1059–1073. doi:10.1242/jeb.00209
- MacVicar B, Dilling S, Lacey RWJ. 2014. Multi-instrument turbulence toolbox (MITT): open-source MATLAB algorithms for the analysis of high-frequency flow velocity time series datasets. Comp Geosci. 73:88–98.
- McKinnon GA, Hnytka FN. 1985. Fish passage assessment of culverts constructed to simulate stream conditions on the Liard River tributaries. Western Region: Department of Fisheries and Oceans; p. 1255.
- Morantz DL, Sweeney RK, Shirvell CS, Longard DA. 1987. Selection of microhabitat in summer by juvenile Atlantic salmon (Salmo salar). Can J Fish Aquat Sci. 44:120–129.
- Ney JF. 1993. Bioenergetics modelling today: growing pains on the cutting edge. Trans Am Fish Soc. 122:736–748. doi:10.1577/1548-8659(1993)122<0736:BMTGPO>2.3.CO;2
- Pavlov DS, Lupandin AI. 1994. Response of fish on water currents with different degree of turbulence. Dokl Akad Nauk. 339:427–430.
- Peake S. 2004. An evaluation of the use of critical swimming speed for determination of culvert water velocity criteria for smallmouth bass. Trans Am Fish Soc. 133(6):1472–1479. doi:10.1577/T03-202.1
- Rajaratnam N, Katopodis C, Fairbairn MA. 1990. Hydraulics of culvert fishways. 5. Alberta fish weirs and baffles. Can J Civ Eng. 17(6):1015–1021. doi:10.1139/l90-112
- Rodriguez JF, Garcia MH. 2008. Laboratory measurements of 3-D flow patterns and turbulence in straight open channel with rough bed. J Hydraul Eng. 46(4):454–465.
- Smith DL, Brannon EL, Shafii B, Odeh M. 2006. Use of the average and fluctuating velocity components for estimation of volitional rainbow trout density. Trans Am Fish Soc. 135(2):431–441. doi:10.1577/T04-193.1
- Strom KB, Papanicolaou AN. 2007. ADV measurements around a cluster microform in a shallow mountain stream. J Hydraul Eng. 133(12):1379–1389.
- Tritico HM, Cotel AJ. 2010. The effects of turbulent eddies on the stability and critical swimming speed of creek chub (Semotilus atromaculatus). J Exp Biol. 213(13):2284–2293. doi:10.1242/jeb.041806
- WDFW. 2003. Design of road culverts for fish passage. Washington (DC): Department of Fish and Wildlife Publication.
- Zydlewski GB, Haro A, Whalen KG, McCormick SD. 2001. Performance of stationary and portable passive transponder detection systems for monitoring of fish movements. J Fish Biol. 58:1471–1475.