
 ?Mathematical formulae have been encoded as MathML and are displayed in this HTML version using MathJax in order to improve their display. Uncheck the box to turn MathJax off. This feature requires Javascript. Click on a formula to zoom.
Abstract
Wetlands are sensitive to hydrological conditions and human influence. The Abras de Mantequilla wetland (AdM) located at the centre of the Guayas River Basin (Western Ecuador), was declared a Ramsar site (2000) due to its important role in the conservation of bird fauna diversity. The wetland also supports significant populations of fish, including endemic species. The area exhibits two seasons: (i) a wet season (January–May); and (ii) a dry season (June–December). For the area of interest data is scarce, and a hydrodynamic model did not exist. In order to evaluate the interannual hydrodynamics and inundation patterns variability of this wetland system, a 2D hydrodynamic model was developed using the Delft3D software suite. Local knowledge was combined with field observations and expert elicitation to construct an appropriate model for the area. Results show that the Abras de Mantequilla is a river-wetland system that experiences extreme variations in hydrodynamic conditions from low water depths and almost stagnant conditions during the dry season, to a very dynamic behaviour during the rainy season. The inundation area ranges between 5 to 27 km2, water depths vary from 0.4 to 9 m and flow velocities from 0.0 up to 0.9 m/s. The “Nuevo River” is the main inflow to the wetland, with an overall contribution of about 85–90%, with peak discharges during February and March. A numerical tracer analysis indicated that the wetland can be divided into three main areas (upper, middle and low), with higher residence times found in the middle area. Overall, based on numerical hydrodynamic simulations it was possible to obtain adequate indications of the relative importance of the different river inflow conditions, as well as spatial and temporal inundation patterns, velocities and residence times under hydrological conditions varying from dry to extremely wet years. Furthermore, the hydrodynamic model provides a basis for other studies such as water quality assessment and primary production dynamics, as well as for determining the habitat suitability for fish.
1. Introduction
Wetlands are among the most productive natural environments. Around 6% of the Earth’s land surface is covered by wetlands, which are key to preserving the biodiversity of the world. Wetlands provide multiple services to mankind: they often are a source for water supply; they function as storehouses of plant genetic material; and they often have high rates of primary production upon which numerous species depend (Halls Citation1997). Despite all the services wetlands provide, these systems have been subject to human disturbance since historical times, as well as newer threats from climate change (Matthews Citation1993; Halls Citation1997; Davidson Citation2014). A global meta analysis of more than 100 case studies on wetlands indicated that agriculture has been the main cause of wetland conversion, while economic growth and increase in population were identified as the most frequent underlying causes (Van Asselen et al. Citation2013). Furthermore, since wetlands play a crucial role in river basins, their degradation has led to the disruption of natural hydrological cycles. Consequently, remaining wetlands face an increase in frequency and severity of floods, droughts, and pollution (Ramsar Citation2010).
Hydrologic conditions are key drivers for wetland dynamics, structure and function, directly affecting abiotic factors, e.g. oxygen content, nutrient availability, sediment transport, that determine the conditions for biota development. For instance, changes in species composition have been observed, caused by minor changes in hydrologic conditions. However, when hydrologic patterns remain similar from year to year, the structure and functional integrity of the wetland’s biota can persist for a very long time (Mitsch and Gosselink Citation2007). The seasonal “hydroperiod” characterizes each type of wetland. The hydroperiods of many wetlands are driven by surface waters coming from adjacent rivers and lakes, affecting their inflows and outflows. Furthermore, a wetland can be seasonally or intermittently flooded (Poff et al. Citation2002; Mitsch and Gosselink Citation2007). Individual studies of wetlands have rarely consider the role of wetlands in the context of the river basin (Shamir and Verhoeven Citation2013), and are too often perceived as standalone elements. In developing countries, where wetlands are often strongly related to livelihoods, information on wetland functions, processes and values is scarce. Thus, management decisions for wetland use are frequently made without comprehensive information (Johnston et al. Citation2013).
The Abras de Mantequilla (AdM) wetland was one of the seven study areas selected for the WETwin project (funded by the European Commission under FP7). The WETwin project aimed to enhance the role of wetlands in integrated water resource management, more specifically to improve wetland management by maximizing the benefits from wetland use while maintaining ecological health, adapting wetland management to changing environmental conditions, and integrating the wetland system into the overall river basin management procedures (Johnston et al. Citation2013). The project selected wetland areas in a number of river basins located in three continents: the Danube in Europe, the Niger, White Nile and Olifants River in Africa, and the Guayas River Basin in South America (Johnston et al. Citation2013). The common characteristic of these areas is that all of them are inland wetlands connected to a river basin (Arias-Hidalgo Citation2012). The approach used in WETwin was to (i) involve stakeholders, (ii) combine qualitative, quantitative data, and expert elicitation (iii) evaluate management interventions, and (iv) provide tools for wetland assessment in a data poor context.
In the AdM wetland, quantitative biological information was available from previous studies: macroinvertebrates (Van den Bossche Citation2009), plankton and water quality (Prado et al. Citation2004; Citation2012), fish (Prado Citation2009; Revelo Citation2010), relations between biotic communities and water quality parameters (Alvarez-Mieles et al. Citation2013). Furthermore, a decision framework for the AdM wetland management was developed, taking into account the hydrodynamics of the surrounding river basin (Arias-Hidalgo Citation2012; Arias-Hidalgo et al. Citation2013). However, the hydrodynamic variability of the wetland itself was still to be evaluated.
Higher densities of organisms in the AdM wetland area compared with the river inflow were found by Alvarez-Mieles et al. (Citation2013), confirming its remarkable function as a habitat for aquatic communities. The study identified the need to assess the historical variations in hydrological and hydrodynamic conditions of this wetland system in order to safeguard the integrity of the aquatic communities (Alvarez-Mieles et al. Citation2013).
Due to rapidly advancing computational capacity, the development of mathematical modelling tools in the field of eco-hydraulics has evolved considerably over the past decades (Mynett Citation2002). In this study, the hydrodynamic model Delft3D-FLOW is applied to explore the AdM wetland response under variable hydrological conditions. A combination of hydrological and hydrodynamic models is used in a data scarce environment to assess interannual variability of this river-wetland system by:
Assessing the historical seasonal variability in hydrological conditions in the AdM wetland and associated river basin
Establishing the main inflows and outflows of the AdM wetland
Identifying the spatio-temporal variability of the main hydrodynamic features in the AdM wetland
Establishing the contributions of the various inflows
Estimating typical residence times in the AdM wetland
The work presented in this manuscript provided the basis for the habitat study “Spatial and temporal variations of habitat suitability for fish: a case study in the Abras de Mantequilla wetland, Ecuador” (Alvarez-Mieles et al. Citation2019), since the hydrodynamic simulations presented here provided the input for a HABITAT model.
2. Study area
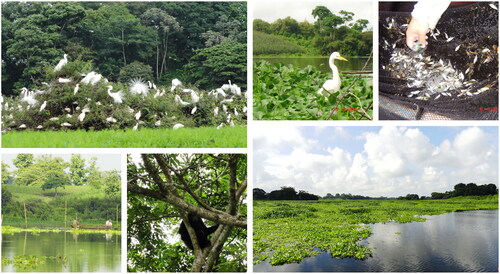
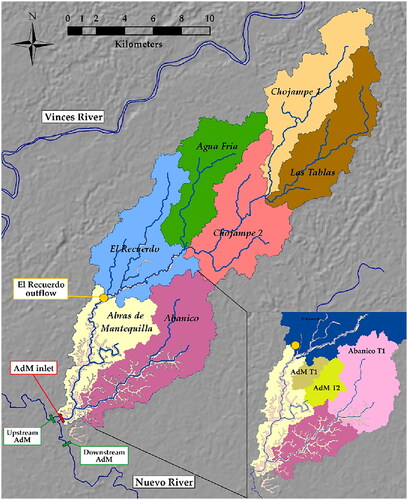
The Abras de Mantequilla (AdM) wetland is located at the centre of the Guayas River Basin (Western Ecuador) (). The wetland was declared a Ramsar site in March 2000, due to its important role in the conservation of bird fauna diversity. The wetland is also an “Important Bird and Biodiversity Area” (IBA) with 127 reported species (). Moreover, the AdM supports a significant population of indigenous fish, and is a source of food, a spawning site and a development area for those species of fish that depend upon the wetland (Ramsar Citation2014). A high variation in inundated area occurs in the wetland from dry to wet season (). The AdM wetland is subject to two major environmental disturbances: (i) short-term agriculture (rice, maize) on the land around the wetland, and (ii) the effects of the Baba dam located in the upper Quevedo-Vinces basin, which could reduce the Nuevo River flow (main AdM inflow) by 30% (Arias-Hidalgo Citation2012).
. Abras de Mantequilla wetland, location in Ecuador and Guayas River Basin. Right figure WETwin project database (Arias-Hidalgo, Citation2012).
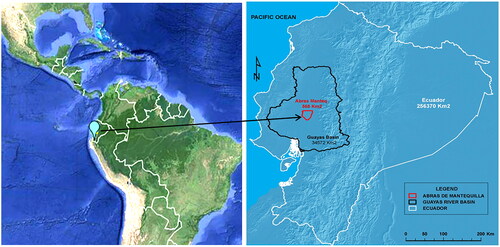
Figure 2. (a) Fauna at Abras de Mantequilla wetland during the wet season, and (b) Abras de Mantequilla wetland at “El Recuerdo”, same location during the dry season (left) and wet season (right).
2.1. Geographical conditions
2.1.1. Catchment topography
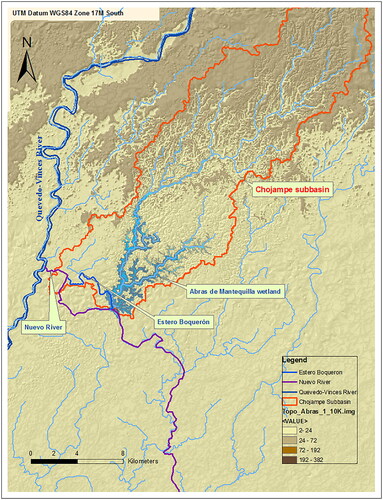
The river catchment topography was characterized using a Digital Elevation Map (1:50000) provided by IGM (Military Geographic Institute of Ecuador), which is complemented by maps from the Shuttle Radar Topography Mission (SRTM), with an initial resolution of 90m × 90m, resampled to 30m × 30m (http://www.ambiotek.com/srtm). The Abras de Mantequilla wetland topography is obtained from a 1:10000 scale topography available for the area of study, which was refined using a local topographic survey of the area along the main canals obtained during a field campaign in February 2011 (Arias-Hidalgo Citation2012). During this field campaign, an important effort was made to verify crucial points of this topographic map. The Digital Elevation Maps at the river basin and wetland scale are presented in and . The wetland part of the Chojampe subbasin () consists of branching water courses surrounded by elevations of 5–10 m (Quevedo Citation2008).
Figure 3. Digital Elevation Map at the Guayas River Basin Scale. Guayas River Basin (area with yellow line), Chojampe subbasin (area with red line). White arrows indicate flow directions. Source (Arias-Hidalgo, Citation2012).
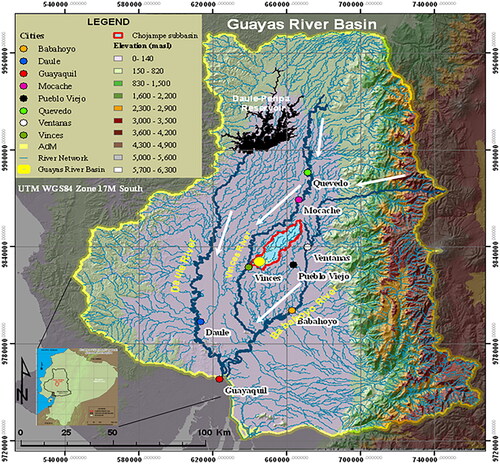
Figure 4. Digital Elevation Map at the AdM wetland scale. Source (Arias-Hidalgo, Citation2012).
2.1.2. Land use and soil properties
The AdM wetland area has been subject to considerable changes in land use over recent decades like the entire Western region of Ecuador. These variations have been more evident since 1958 due to the increase in population, followed by an increase of roads, and a gradual replacement of forest coverage (Dodson and Gentry Citation1991). According to a land use map of 2008 (Arias-Hidalgo Citation2012), the major part is used for short-term crops (45%) mainly maize and beans, followed by rice (26%) while the forest cover represents only around 3% of the total area of the wetland (Figures S1 and S2 in Supplementary Material (SM)). The soils of the Chojampe sub basin can be classified into four major categories: 48% consists of clays, loamy clays, inorganic clays; 36% are saturated soils and expansive clays; 13% are sandy soils; and 3% are sandy clays and loamy sands (Figure S3–SM).
2.2. Hydrological and meteorological conditions
Due to the proximity to the Equator, there are only two climatic periods: the wet season (January-May) and the dry season (June-December). Daily time series for discharges, water levels and meteorological data in the region were obtained from the National Institute of Meteorology and Hydrology of Ecuador (INAMHI).
2.2.1. Annual precipitation and seasonal variability
Pluviometric data for the study area was available over the period 1963–2012 from three gauging stations; (i) Pichilingue; (ii) Pueblo Viejo; and (iii) Vinces. The geographic position of Pichilingue station between the Upper Quevedo-Vinces basin and Chojampe basin, facilitates understanding the functioning of both basins and their interrelation ().
Figure 5. Measuring stations near the Abras de Mantequilla wetland: (i) Pichilingue (North of the Basin) (ii) Pueblo Viejo (East of Abanico subbasin); and (iii) Vinces (Near the confluence of Vinces and Nuevo River).
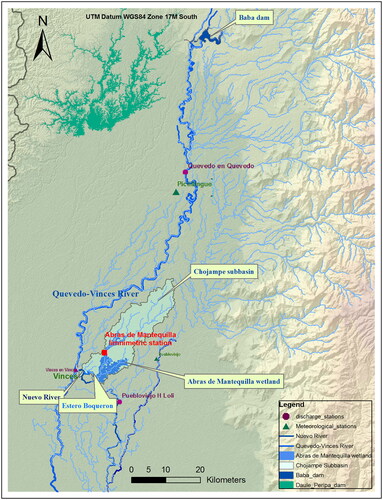
Figure 6. Annual precipitation at Pichilingue station (period 1963–2012).
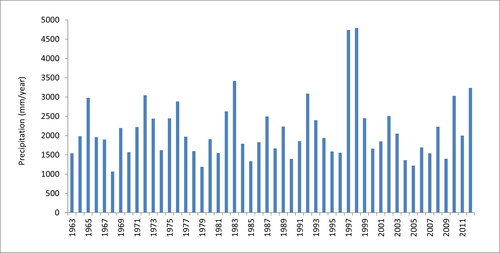
The highest annual precipitation at Pichilingue station was observed in the years 1997/1998 during an “El Niño” (ENSO) event, with values up to 4800 mm, whereas the lowest values were recorded in 1968, and 2005 (1066 mm and 1222 mm) ().
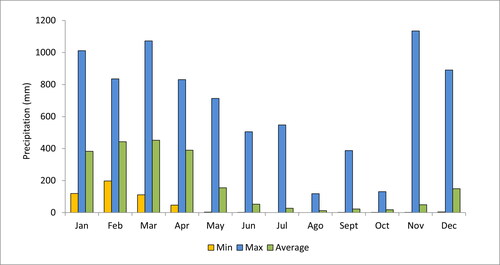
Extreme climate events (El Niño) cause precipitation levels to increase dramatically, extending the wet season up to 9 months or beyond. Maximum monthly values (up to 1100 mm) occurred during 1982–1983 and 1997–1998, which correspond to El Niño years. Minimum values during the wet season were seen to range from 47 mm to 198 mm (). During the dry season, minimum values are close to zero, while maximum values can vary. The spatial distribution of the mean monthly precipitation in Guayas River Basin (GRB) and AdM wetland are presented in Figure S4a (SM).
Figure 7. Minimum, Maximum and Average monthly precipitation in Pichilingue station (1962–2012).
2.2.2. Discharge and water level data
Daily time series for discharges were available for two stations: Quevedo en Quevedo and Vinces en Vinces ( and ). Both stations have complete data records without gaps during the period considered and are used to establish relations with other stations to estimate the discharges of AdM wetland system. One limnimetric station is located inside the wetland (), the AdM limnimetric station ().
Table 1. Discharge and water level data.
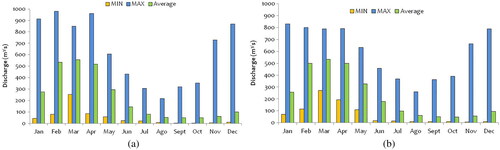
The main inflow into the wetland area is the Nuevo River, which is a diversion from the Vinces River. There are no streamflow measurement stations nearby the AdM wetland. Thus, the data of the Vinces and Quevedo rivers were used to estimate the boundary conditions of the wetland inflows (Section 3.2). The variability of the river discharges in both stations is presented in . The minimum, maximum and average monthly values were calculated from the data available for the periods detailed in . The figure shows a clear wet and dry season comparable to the precipitation pattern in Pichilingue station (). During the wet season, the maximum monthly discharges can reach 980 m3/s in “Quevedo en Quevedo station” and 830 m3/s in “Vinces en Vinces station.” Lower streamflow values in “Vinces and Vinces station” compared to “Quevedo en Quevedo station” occurred because the Nuevo River diversion occurs slightly upstream than “Vinces en Vinces station.” Maximum discharges were recorded for the periods 1982–1983 and 1997–1998 during the El Niño events. Monthly average discharges in both stations can reach 530 m3/s during the wet season, decreasing to 50 m3/s during the dry season.
Figure 8. Monthly discharges in (a) Quevedo en Quevedo, and (b) Vinces en Vinces stations. Period (1964–2010).
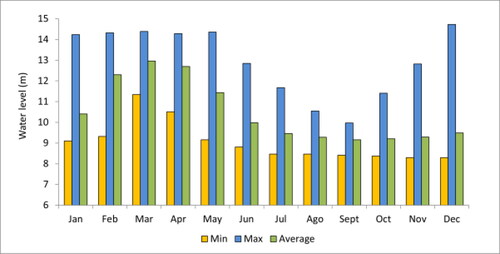
Water depth dynamics in the Abras de Mantequilla wetland was evaluated using the available limnimetric observation point located within the wetland. Monthly average water levels between 12.3 and 13.0 m were recorded for the wet season (corresponding to water depths of 6.3 and 7.0 m, respectively, since the reference bed level is 6 m). During the dry season, average water levels decreased to values between 9.2 and 9.5 m, and the minimum water level was 8.3 m ().
Figure 9. Monthly water levels in Abras de Mantequilla limnimetric station (1988–2007).
2.2.3. Hydrology of the Chojampe subbasin
The AdM wetland is part of the Chojampe subbasin, which has an area of around 259 km2 and is divided into seven small microbasins: Chojampe 1, Las Tablas, Chojampe 2, Agua Fria, El Recuerdo, Abras de Mantequilla and Abanico. The “El Recuerdo” microbasin collects the runoff from the five upper microbasins (Upper Chojampe) representing the second hydrological tributary to the wetland. Three small tributaries were also identified in the upper area of Abras de Mantequilla and Abanico microbasins: AdM T1, AdM T2, and Abanico T1, but their effect on the entire wetland is minimal due to their low flow rates. The microbasin areas of these three small tributaries were: 4 km2 for AdM T1; 7 km2 for AdM T2; and 28 km2 for Abanico T1 ().
Figure 10. Chojampe micro-basins and tributaries to the Abras de Mantequilla wetland (Galecio Citation2013).
3. Hydrodynamic model set up
In order to explore the flood patterns across the AdM wetland system, the Delft3D-FLOW module of the Delft3D software suite from Deltares was used to construct a 2D (horizontal x-y) model of the AdM wetland. The Delft3D suite is a fully integrated computer software package composed of several modules grouped in a common interface. The modules can be easily linked to each other for a multidisciplinary approach applicable for rivers, coasts, lakes and estuaries (Deltares Citation2013a). The model Delft3D has been widely applied in several aquatic environments, from coastal waters (Blauw et al. Citation2009; Li et al. Citation2010; Spiteri et al. Citation2011) to rivers (Chen et al. Citation2012; Barrera Crespo et al. Citation2019), tropical lagoons (Velez Citation2006), and reservoirs (Smits Citation2007), among others.
The Delft3D model provides dynamic spatial inundation maps for the entire wetland area, as well as temporal water depths and velocities at specific observation points.
3.1. Wetland schematization and grid construction
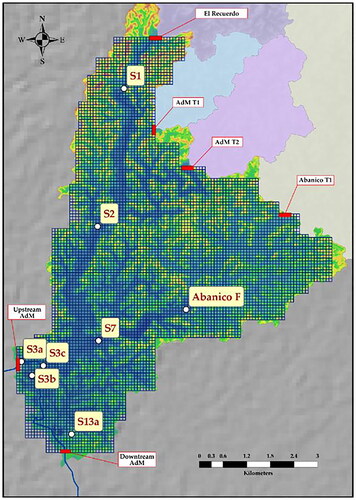
A 2D grid was built for the study area, as defined in . Since the main tributary to the wetland is the Nuevo River, the inlet section was implemented as part of the grid. The other four tributaries to the wetland are represented as input conditions. Virtual observation points were positioned at upper (S1), middle (S2, Abanico F), and lower (S7, S3c) areas of the wetland () to be able to evaluate the wetland behaviour at different areas. The grid cell size was 75 m × 75 m, which was considered suitable in view of topographical characteristics and computational time. The hydrodynamic grid had a total of 7,163 cells. Grid coordinates presented in Table S1 (SM).
Figure 11. Abras de Mantequilla wetland grid; boundary conditions (red lines): Upstream AdM (Nuevo river: main inflow to the wetland); Upper Chojampe (El Recuerdo, AdM T1, AdM T2, Abanico T1); Downstream AdM (wetland outflow). Observation points (white dots), located at upper (S1), middle (S2, Abanico F), low (S7, S3c) wetland areas. Source: (Galecio Citation2013).
3.2. Boundary conditions
The boundary conditions to the wetland were represented by the two Nuevo River reaches located upstream and downstream of the wetland, and the four tributaries located in the Chojampe subbasin. The main inflow conditions upstream and downstream of the inlet are driving the patterns of flooding and drying. Measured discharges at the Nuevo River inflow and outflow were not directly available, thus they were obtained from a correlation analysis performed between the discharge data of the “Quevedo en Quevedo” gauging station (located in the Vinces River), and the results of a 1D model previously developed in HEC-RAS for the Vinces catchment (Figure S5-SM) for an average year (2006) (Galecio Citation2013). Measured discharge data from the Quevedo en Quevedo station were correlated with the HEC-RAS modelled results of an upstream (inflow) and downstream (outflow) locations of the wetland. The correlation analysis indicated that the Nuevo River diverts around 40% of the Vinces River streamflow. The correlation analysis and equations are presented in the Section S4.1 and Figure S6 (SM). Although using a correlation approach is obviously an approximation, it was considered the most suitable procedure to overcome the absence of measurement data. The results of this approach exhibited a good linear correlation between the HEC-RAS model results and the data measured in the Quevedo gauging station (Figure S6-SM). The relation between the discharge and water level in Nuevo River (downstream AdM) was obtained from a rating curve (Figure S7-SM). The combined correlation and rating curve approach provided the boundary conditions for the model, including the seasonal variability of the inflows and outflows as presented in Figure S8 (SM).
The boundary conditions for the tributary El Recuerdo of the Chojampe subbasin were determined using HEC-HMS, a rainfall-runoff model (Galecio Citation2013). The model was based on a previous rainfall run-off simulation set-up developed by Arias-Hidalgo (Citation2012), who distinguished five microbasins located in the Upper Chojampe subbasin: Chojampe 1, Las Tablas, Chojampe 2, Agua Fria and El Recuerdo. These microbasins collect the rainfall from the upper part of the Abras de Mantequilla wetland generating a discharge outflow in the “El Recuerdo” microbasin (). The model used precipitation data from Pichilingue, Pueblo Viejo, and Vinces gauging stations (Figure S4b-SM). Information about soil type, topography, and size of the microbasins was evaluated. Several processes were considered in the model: water loss, transformation from rainfall to runoff, and base flow. The calibration point was the only gauging station in the wetland (Abras de Mantequilla limnimetric station), located 1.5 km downstream the outflow from the El Recuerdo microbasin. In order to obtain the discharge from this gauging station, the cross sections measured in the field were combined with the assumption that the velocities in this point were comparable to the one of the wetland inlet.
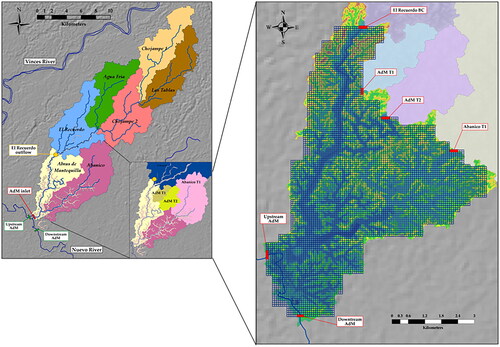
Figure 12. Abras de Mantequilla wetland (AdM) - main inflows and Hydrodynamic model schematization. Left panel: “El Recuerdo” (yellow dot) collects the run off of the five contributing microbasins from Upper Chojampe Sub-basin (Chojampe 1, Las Tablas, Chojampe 2, Agua Fria and El Recuerdo). Abras de Mantequilla wetland area (in light yellow). Right panel: Hydrodynamic model schematization - Abras de Mantequilla wetland grid (from Delft3D-FLOW). Boundary conditions (in red lines). Low boundary condition (Upstream AdM) represents the main inflow to the wetland “The Nuevo River-Estero Boquerón.” Upper boundary conditions (El Recuerdo, AdM T1, AdM T2 and Abanico T1). Source (Galecio Citation2013).
This rainfall-runoff model was also calibrated with the average rainfall year 2006. After calibration the model shows a good performance, with a Nash-Sutcliffe coefficient of 0.70 (Galecio Citation2013) (Figure S4c-SM). Afterwards, boundary conditions for different hydrological years were quantified using the calibrated model and adjusting the precipitation to the other years of interest. This procedure was used as an approximation because there was no data to calibrate the other years of interest. Finally, the boundary conditions of the other three microbasins (AdM T1, AdM T2, and Abanico T1) (, right panel) were estimated using the same model and procedure described above. The microbasins areas of these three small tributaries were: 4 km2 for AdM T1; 7 km2 for AdM T2; and 28 km2 for Abanico T1 (, right panel).
3.3. Tracer analysis and residence times
The contributions of each tributary (inflows) at “specific wetland locations” were evaluated based on a tracer analyses using the WAQ module of the Delft3D software suite coupled with Delft3D-FLOW (Section S6 (SM)). Six conservative tracers were added to the model: one for each boundary condition: Upstream AdM (Nuevo River inflow), El Recuerdo, AdM T1, AdM T2, Abanico T1, and one as the initial condition. For each conservative tracer the initial concentration was 1.0 g/m3. No tracer is added to the Downstream AdM (Nuevo River outflow) boundary condition since it always flows out of the wetland.
Five observation points were selected in order to cover different wetland areas: S1 and S2 (Abras de Mantequilla branch), Abanico F (Abanico branch), S7 and S3c both located in the low wetland area closer to the Nuevo River inflow. The relative contribution of each tributary at each of these observation points was analyzed directly from the modelled tracers. Furthermore, the results were obtained for each year of interest (from a dry year to an extremely wet year).
The residence times for specific wetland areas were calculated using a passive tracer approach with prescribed initial conditions, in accordance with the procedure proposed by Takeoka (Citation1984). The procedure considers the remnant function, which is defined as the concentration at time t (C(t)) of a compound having an initial concentration C0. From this concentration variation, the residence time was defined by EquationEq. (1)(1)
(1) as:
(1)
(1)
4 Model calibration
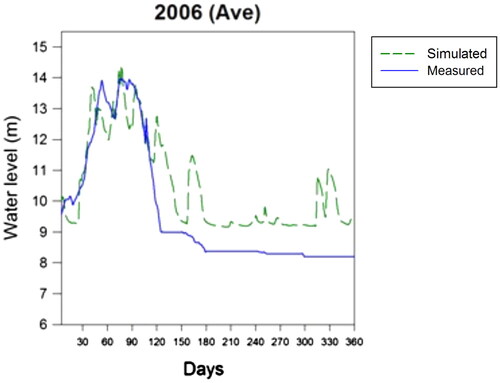
Measured and simulated values of water levels at the AdM limnimetric station “El Recuerdo” were compared in order to assess the performance of the 2D model. For the calibration, simulated water levels of the average year (2006) were compared with measured levels. The magnitude of the water levels during the wet season was adequately represented, although simulated values showed more variation than the observed ones. The results show a good overall representation of the variability during the wet season, while during the dry season water levels do not show much variability (). The reference bed level in the wetland is 6 meters above sea level (m.a.s.l.). A conservative Manning coefficient of 0.04 was used for the whole area. Little variation was observed when varying the Manning coefficient. Since, the rate of change of flow velocities during the beginning and end of the wet season is relatively low, this implies that the filling and emptying process of the wetland is governed by the storage equation rather than by the momentum equation. As a consequence the flow resistance coefficient (Manning’s n) plays only a minor role and was kept at the standard value 0.04.
Figure 13. Simulated and measured water levels at Abras de Mantequilla limnimetric station “El Recuerdo” for the average year (2006).
5. Model performance
The model performance was evaluated by comparing measured and simulated values of water levels at El Recuerdo for other hydrological conditions. The performance of the model was measured using the Nash-Sutcliffe coefficient (Nash and Sutcliffe Citation1970) (2). This coefficient is often used for the analysis of hydrologic time-series to determine the relation between two sets of data (2).
(2)
(2)
where:
NS = Nash-Sutcliffe coefficient (−∞ < NS < 1)
Hobs = observed water level (m)
= average of observed water level (m)
Hsim = simulated water level (m)
The outcomes indicate a satisfactory performance of the model (NS = 0.77), despite data scarcity, and a correlation coefficient of 0.86 for the dry year, and 0.83 and 0.90 for a wet year (). For a dry year, the model reproduces the magnitude and timing of the water levels satisfactorily, although a shift of a few days was observed. The wettest years (1992 & 1998) showed an adequate representation of the temporal pattern, although simulated values were slightly lower than the measured ones for both simulations (). The performance for extreme years was again measured with the Nash-Sutcliffe coefficient. Overall, the NS coefficients exhibit a satisfactory performance of the model, ranging from 0.67 to 0.83 with correlation coefficients over 0.86 (). Relative metrics were also applied to evaluated the performance of the model (Domínguez et al. Citation2011). Mean relative error (MRE), and mean absolute relative error (MARE) resulting values were not higher than 0.07. Since, for a perfect model the result of both metrics would be zero, the resulting values indicated also a satisfactory performance of the model.
Figure 14. Simulated and measured water levels at Abras de Mantequilla limnimetric station “El Recuerdo”. For: dry year (1990), wet year (1992), and extreme wet year (El Niño-1998). X axis represents a calendar year from January to December (in days).
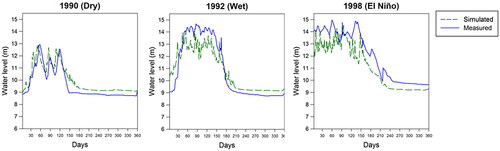
Table 2. Model performance for the different years.
6. Interannual variability in hydrodynamic conditions
The main objective of developing a hydrodynamic model was to assess the wetland hydrodynamic functioning and seasonal patterns under different hydrological conditions in order to evaluate the natural variability of this wetland-river system during the period (1963–2010) when there was no important water abstraction from the wetland system and inflows (e.g. a dam). To evaluate this variability several steps were performed: first, daily time series of precipitation for the period (1963–2010) were analysed to determine the driest and the wettest year during this period. From the analysis, the driest year recorded 1397 mm of precipitation, the wettest one 4791 mm. Secondly, the years of interest were evaluated considering their total precipitation and return period, allowing the selection of particular years that can describe the variability of this system. Three years were identified to represent extreme years: 1990 (dry); 1992 (wet); 1998 (extreme wet-El Niño) (Galecio Citation2013).
The quantification of the six boundary conditions: Nuevo River inflow and outflow; El Recuerdo, AdM T1, AdM T2, Abanico T1, was performed following the procedure described previously in Section 3.2. Initial water levels for the model were determined for the different conditions in two areas: the wetland and the river inlet. For the wetland, the water levels were estimated from the limnimetric station located in the wetland. For the river inlet, the water levels were estimated based on the water levels downstream from the wetland, which were calculated with the rating curve (Figure S7-SM). Initial velocities were set to zero. The initial water levels for the simulated years are presented in Table S2 (SM).
6.1. Water depth and inundation area
Minimum and maximum simulated water depths at different wetland areas are presented in . One observation point at each wetland area was selected to illustrate this range. The upper wetland showed minima between 1.2–1.5 m and maxima between 5.2–7.0 m. Values that were validated by local farmers during the fieldwork campaigns developed in the wetland.
Table 3. Simulated water depths results (m) of observations points located at the upper, middle, and lower wetland areas, for the different conditions.
The middle area had minima from 0.5–1.5 m and maxima from 4.2–8.6 m. At the lower area, minima ranged from 0.4–1.5 m, and maxima were up to 8.6 m. Considering the different simulated conditions, maximum values occurred during the El Niño year 1998 when higher water depths occurred. Minimum water depths were observed during the dry year. Overall, the wetland experienced historical fluctuations ranging from 0.4–8.6 m.
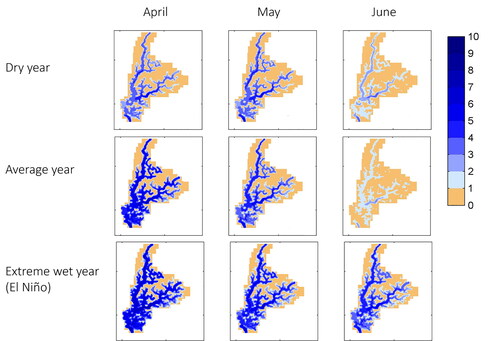
The flood variability during the first six months of the year (January-June) for extreme and average years is presented in and . shows the inundation patterns (January to March), and (April to June). The peak of the wet season mostly occurs during February-March (). Results from the spatial analysis indicate that during a dry year (1990) the flooding was evident from February till May, while during the wettest year (1998) it was extended till June. The average year follows a similar pattern to the one of the dry year (). Although the typical wet season is from January to May, the figure also shows the month of June, which is considered a transition month in Ecuador. The representation of the dry season with a typical low inundation extent is depicted for the average year 2006 in Figure S9 (SM).
Figure 15. Water depth (m) maps (January-March) first trimester of the year. February-March are mostly the peak months of the wet season. For: dry year (1990), extreme wet year (El Niño-1998), and average year (2006). Scale bar indicates the water depth range (m).
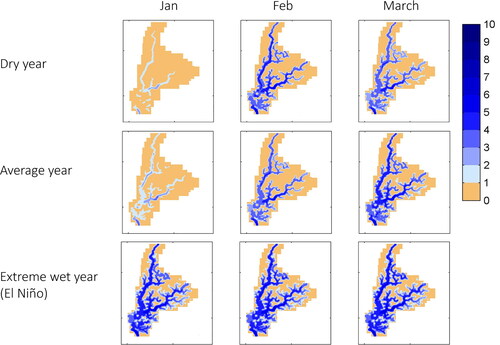
Figure 16. Water depth (m) maps (April-June), June is considered as transition month to the dry season. For: dry year (1990), extreme wet year (El Niño-1998), and average year (2006). Scale bar indicates the water depth range (m).
6.2. Flow velocities
Several ecological processes are driven by flow velocities, hence, it is important to analyse the flow patterns occurring in both the wetland area and at the inflows, under different conditions. Measured values from two campaigns developed in 2011 and 2012 indicated that flow velocities in the wetland area were up to 0.4 m/s, and in the river inflow up to 0.8 m/s (Table S3-SM). In the wetland area higher values were measured at observation point S7 (0.4 m/s) due to the proximity to the main inflow from Nuevo River () with values between 0.6–0.8 m/s. Since the campaigns took place in the middle of the wet season (February 2011 and March 2012), these measured values represent typical flow velocities during this period of the year at these observation points. Measured and simulated flow velocities were in the same range (Tables S3 and S4-SM). Pooled velocities from sites located in the three wetland areas showed that average simulated velocities ranged from 0.01–0.10 m/s, with maximum values up to 0.54 (1998-El Niño year). In the Nuevo River average values were up to 0.28 m/s, and maximum ones up to 0.78 m/s (1992) (Table S4-SM). Thus, measured velocities were closer to the maximum simulated velocities, confirming that the measurements were performed during the peak of the wet season.
Table 4. Residence time (days), at upper, middle and low wetland observation points.
6.3. Variability in inundation area and volume
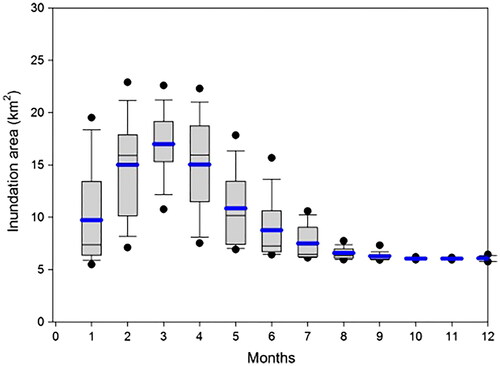
The variability of the wetland inundation area and volume is valuable because it provides an overall representation of what the system has experienced historically in terms of inundation area patterns. Water level results from the hydrodynamic simulations were used in combination with a stage-volume curve to estimate the corresponding inundated areas and volume for each day of the simulation period (one year). The stage-volume curve was built from the available topography of the wetland (). The inundation variability was calculated with daily simulated inundation results for different hydrological conditions. Results show that the wetland is experiencing changes in inundation area ranging from 5–23 km2 () and Figure S10 (SM).
Figure 17. Stage-volume curve for Abras de Mantequilla wetland.
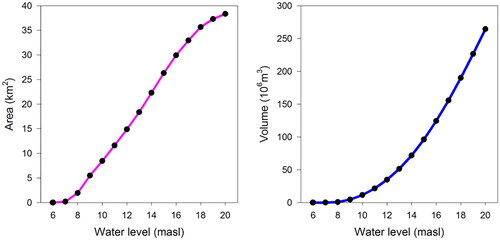
Figure 18. Boxplot of wetland inundation area (km2). Built with a stage volume curve and Delft3D-FLOW simulations results (one year simulation), from: dry year (1990) and extreme wet year (El Niño-1998). Each month built with the daily values of each simulation. Blue line (mean). Upper and lower black dots show the 5th and 95th percentiles. Months display from left to right: January (1), to December (12).
6.4. Contributions to the inflows
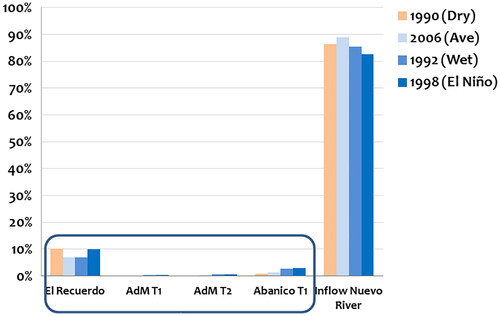
The overall contributions to the inflows were estimated using a mass balance analysis (Galecio Citation2013; Alvarez-Mieles Citation2019). Results of this analysis determined that overall the Nuevo River inflow accounted for 86% of the total inflow, and the four tributaries from Chojampe subbasin for 11% of the total inflow (average of all simulations), and this pattern was maintained for the different years simulated, with minor oscillations in the contribution percentages (). The contribution of Nuevo River inflow ranged from 83% (1998-El Niño) to 89% (2006). During wettest years, the contribution of the total inflow of Chojampe was higher than for the rest of simulations, indicating an increase in runoff during this extreme wet condition.
Figure 19. Relative importance (%) of inflows in AdM for the different conditions/years simulated. In blue box: El Recuerdo and Chojampe small tributaries.
6.5. Tracer analysis
The contributions of the different inflows at “specific wetland locations” were evaluated based on tracer analyses using the WAQ module of the Delft3D software suite coupled with Delft3D-FLOW (Section S6 (SM)). For this purpose, one conservative tracer was assigned to each boundary condition of the model, while an additional tracer was assigned to the initial condition. A spatial representation of the tracer analysis for the two main inflows is presented in .
Figure 20. Conservative TRACERS transport at the two main inflows of AdM. Upper panel: El Recuerdo inflow; Lowe panel: Nuevo River inflow. One snapshot per month (Snapshots only for wet season).
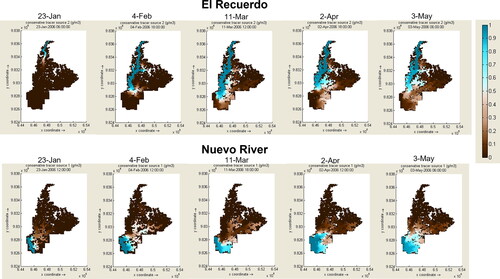
The numerical tracer analysis results show that the upper wetland area (S1) is controlled by the Upper Chojampe (90–96%), influence that decreases in the middle area (S2) to (70–83%). At these two observation points, the Nuevo River inflow was found not to be important (Figure S11-SM). Results from Abanico F, also located on the middle part of the namesake branch, indicate that this point is dominated by the corresponding microbasin (40–78%) being higher during the wettest years. In this branch, the Nuevo River also showed an influence (4–28%) that decreased in the wettest years. At the lower wetland area (S3c and S7) the Nuevo River was the main source of incoming water. At the intersection of the two branches (S7) the influence of the Nuevo River was between 19 and 52%, being higher during dry years. Upper Chojampe and Abanico also showed similar contributions over the years, while Abanico showed higher contributions during wettest years (up to 40%). At S3c, the closest wetland point to the inflow, the Nuevo River provides the dominant inflow (44–66%) being relatively constant, except for the El Niño year. The contribution of the Upper Chojampe subbasin at this point was between 23 and 39% (Figure S11-SM).
6.6. Residence times
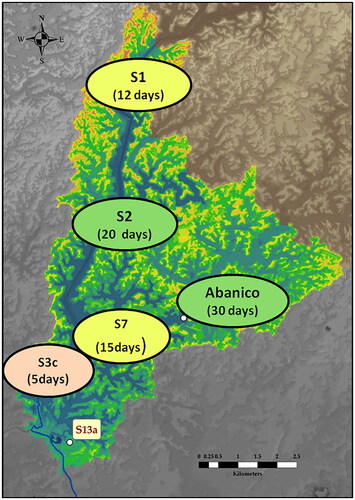
Several biogeochemical processes are driven by residence times. The residence time was computed for every observation point involved in the tracer procedure. The results indicate that the middle wetland areas (S2 and Abanico F) are the ones with higher residence times with averages of 20 and 30 days, resp. The lowest residence times were found in the upper (S1) and lower (S3c) wetland areas, thus areas dominated by the inflows, with average values of 12 and 5, resp. () and ().
Figure 21. Residence time (days), at upper, middle and low observation points. Values represented correspond to the average values from .
7. Discussion
7.1. Natural variability of hydrodynamic conditions
The Abras de Mantequilla wetland is a river-wetland system that experiences extreme variations in hydrodynamic conditions: from low water depths and almost stagnant conditions during the dry season, to a very dynamic behaviour during the rainy season. The Vinces River, located in the Quevedo-Vinces basin, diverts around 40% of its water to the Nuevo River, which constitutes the main inflow to the system. The wetland flooding starts in January and continues till April, with the exception of extreme wet years, when the rainy season can last until June.
Temporal analysis of the hydrological conditions showed that the timing of peak discharges varies from year to year, but usually occurs during the months of February and March. Results from the hydrodynamic model indicated that historically the wetland experienced significant variations in water depth ranging from 0.4 to 9 m, and flow velocities up to 1 m/s. The maximum discharges from the Nuevo River into the wetland system also showed high variations between the conditions simulated, increasing up to three times in magnitude from a dry condition year to an extreme wet one. Overall, these extremes in hydrodynamic conditions characterize this wetland system as being highly dynamic.
The evaluation of inundation patterns showed that during the rainy season the wetland has higher water depths (up to 9 m) and inundated areas can reach maxima of around 27 km2, depending on the year and condition evaluated. During the dry season, the inundation area is reduced to more or less constant values of around 5 km2.
The results from the hydrodynamic simulations revealed that the “Nuevo River” is the main inflow into the wetland, with an overall contribution around 80–90%. The four tributaries from the Chojampe subbasin contribute around 10–15%. From these four tributaries, the inflow from the Upper Chojampe subbasin at the point “El Recuerdo” is the most important, contributing up to 10% of this inflow. The Nuevo River is the main outflow of the wetland (95%), while evaporation, evapotranspiration and infiltration account for the rest.
In relation to the Surface runoff, it is important to remark that precipitation contribution directly in wetland area was not higher than 4% of the total inflow to the wetland, therefore, surface run-off was a small source of water to the wetland. The most important source of water for the wetland is the streamflow from the Nuevo River and, in a lesser degree, the Upper Chojampe subbasin. The baseflow was not analyzed since the main objective was to study the wetland at a seasonal time scale; hence, individual storm hydrographs were not studied.
7.2. Spatial analysis, tracer analysis and residence times
The tracer analysis indicated that the wetland could be divided into three main areas (upper, middle and lower) based on the influence of the aforementioned inflows at the selected points. The “upper part” of the wetland was dominated by the Upper Chojampe inflow where the contribution of the Nuevo River was almost negligible, due to the topographic characteristics of the upper wetland area located in a higher altitude. In addition, the water contribution from the Upper Chojampe tributary is strong enough to restrict the water from the Nuevo river from reaching this area of the wetland. Overall, this area has average residence times of about 12 days.
The “middle part” of the wetland represents a transition area mainly influenced by the Upper Chojampe subbasin for the Abras branch (S2), and by the Abanico subbasin for Abanico F. In this area, the Nuevo River showed an influence for both branches, but, since the Abanico branch has lower discharges than the Abras branch, the influence of the Nuevo River reaches further upstream (Galecio Citation2013). Average retention times in the middle areas are about 20 to 30 days for Abras (S2) and Abanico branch respectively. Thus, longer retention times are an important feature of the middle area, promoting an increase in biological and chemical processes, and explaining the higher concentrations of organic nutrients, and higher densities of biotic communities (algae, macroinvertebrates, and littoral fish) found in the middle area (Alvarez-Mieles Citation2019).
The “lower part,” located between the Nuevo River and the confluence of the two main branches of the wetland, is characterized by a strong influence from the Nuevo River. Nonetheless, this area experiences a mixing of the different tributaries, which is determined by the changes in magnitude of the Nuevo River. Thus, an increase in discharge of Nuevo River nearly removes the contribution from Upper Chojampe and Abanico subbasins. Higher velocities characterize this area compared to the middle and upper area, and this pattern was observed during all conditions simulated. Due to the high dynamics of this area, retention times have average values of about 12 days at the junction of the two branches, and 5 days close to the Nuevo River inlet point.
7.3. Wetland functioning and effects of infrastructure projects
The wetland functioning was seen to mainly depend on the Nuevo River, which determines the timing and magnitude of the inundation patterns. Since the Nuevo River is diverted from the Vinces River, it is expected that the effect of the Baba dam, located in the upper Vinces River catchment, may reduce the Nuevo River flow. Previous research in the study area determined that the dam operation might reduce the flow of the Vinces River immediately down the dam by about 70%. Nevertheless, due to the contribution of the two rivers Lulu and San Pablo, the Vinces River is expected to recover in the downstream section and the final annual reduction of flow may be about 30% (Arias-Hidalgo Citation2012; Arias-Hidalgo et al. Citation2013). Although this reduction may affect the overall hydrodynamic pattern, the analysis of historical minimum flows over the period 1962–2010 indicated that the wetland has experienced lower values than the ones that could be attributed to the dam operation that started during the period 2012–2013. However, these historical minimum values need to be considered as specific events of low flows, thus it cannot be assured that the wetland can sustain its current functioning and dynamics if the flow is reduced permanently.
7.4. Hydrodynamics relations with aquatic ecology, water quality, pollution and land use
The AdM wetland is a system that experiences a marked and strong seasonal variation in flushing rates, and as a result in inundation areas. During the wet season (January-May) the system exhibits a great variability in inundation area due to the rainfall peak events during a given year (intra-annual), and inter-annual rainfall variability. During the dry season, the wetland decreases dramatically and water remains only in the main channels (observations in situ), with a similar pattern from year to year. Thus, the AdM wetland can be classified as a “temporary wetland with a predictable pattern” (Brock et al. Citation2003).
Regarding ecological aspects, variations in hydrodynamics features have a direct relation with the ecology of aquatic biotic communities. The impact of drought on the biota is influenced by factors such as previous hydrological history (system used to dry recurrently), the timing of this drying period, and availability of refuges for the biota during the dry period (Boulton Citation2003). However, there is also a difference between seasonal droughts (e.g. predictable dry periods in tropical areas), and the supra-seasonal droughts that are “unpredictable.” This distinction is crucial because a “seasonal drought” is simply an extreme of the hydrological pattern of a specific water system, with perhaps littler impact on the occurrence of biota, even if having a major effect on the relative abundance of species (Lake Citation2003). From the previously exposed about how species can adapt to “predicted seasonal droughts,” it is possible to assume that the aquatic species at AdM wetland are already adapted to this seasonal dry period occurring from June to December. Thus, the sustainability of the AdM wetland system will depend on the maintenance of the wet-dry cycles under the range that the system has experienced “historically.”
Regarding flow velocities, an extensive macroinvertebrates study developed at the end of the dry season in the Guayas River Basin (GRB) found that higher scores of biotic indices (BMWPCol) were associated with higher flow velocities found in the upstream sites of the catchment (Damanik-Ambarita et al. Citation2016b). In contrast, in AdM (lowland area of the GRB), higher scores of (BMWPCol), as well as higher densities were found in wetland sites with lower velocities and presence of aquatic vegetation, as described in a study developed during the wet season (Alvarez-Mieles et al. Citation2013). Different sampling seasons as well as type of environment (upper vs lower catchment), and presence of aquatic vegetation may explain these differences. Flow stream velocity has been found to be a key hydro-morphological variable determining the occurrence of macroinvertebrates (Damanik-Ambarita et al. Citation2016a) and fish (Alvarez-Mieles et al. Citation2019).
In AdM wetland, the areas characterized with low flow velocities and associations of aquatic macrophytes were determined as key habitat zones for littoral fish communities (Alvarez-Mieles et al. Citation2019), thus describing also the importance of low flow velocities in a system. Stream velocities thresholds for macroinvertebrates were identified in the GRB (Nguyen et al. Citation2018), who found that “running water taxa” started increasing in abundance and frequency from 0.03 to 0.4 m/s. The combination of thresholds responses to stream velocities with other key environmental variables will support in the definition of ecological flows (Nguyen et al. Citation2018). Furthermore, ecological water quality in the GRB was found to be mainly affected by hydro-morphological than physico-chemical variables in a study relating land use with water quality (Damanik-Ambarita et al. Citation2018).
Regarding water quality and pollution, AdM wetland exhibits concentrations under the limits of the Ecuadorian water legislation (MAE Citation2003). A study on water quality dynamics in AdM (Alvarez-Mieles et al. Citation2021) determined that AdM wetland exhibits concentrations of nutrients and primary production in the range of other similar tropical systems, and that higher concentrations were mainly observed during the wet season driven by the high inflows occurring during this period. Furthermore, the wetland is also affected by non-point sources due to land use, mainly agricultural activities around the wetland. Simulation results of the water quality-ECO model developed for AdM wetland determined that the hydrodynamic behaviour of this river-wetland system causes oxygenated conditions over the year (Alvarez-Mieles Citation2019; Alvarez-Mieles et al. Citation2021). Furthermore, peaks in nutrients concentrations were directly related to peaks in stream flow discharges, while Chlorophyll-a concentrations in the area close to the main inflow were inverse related to these peaks in discharges (Alvarez-Mieles et al. Citation2021), describing this system as highly linked to the seasonal hydrology.
7.5. Ecosystems services and seasonality
Flood regulation, primary production, habitat for species, fisheries, and ecotourism are the main ecosystems services attributed to the AdM wetland system. Considering that during the wet season, approximately 30% of the Quevedo River discharge is diverted to the Nuevo River, AdM wetland is certainly a flood regulating system for the central area of the GRB.
Regarding wetland primary productivity, a yearly mass balance calculation of phytoplankton biomass (Alvarez-Mieles Citation2019, Alvarez-Mieles et al. Citation2021), determined that the internal primary production biomass in this wetland system may increase up to four times from a dry year to a extreme wet year, with values up to 9000 tons/ year. Considering the importance of primary production in supporting the next levels of the trophic change, this is a remarkable ecosystem service of this wetland.
Fisheries studies in the wetland (Florencio Citation1993) and surrounding river basin (Revelo Citation2010) described the entire area as highly productive for fishing activities, and enhanced the value of AdM wetland as a nursery area for the fish communities. Since the beginning of the flooding season in January till March, the system provides the perfect conditions for spawning, as explained by Revelo (Citation2010) who found that 70% of the collected specimens reported an advance stage of sexual maturity during the peak months of the wet season. Thus, one of the main ecosystems services this wetland provides is habitat for fish communities, with some species even endemic of this area (Alvarez-Mieles et al. Citation2019).
Furthermore, the wetland has been selected as a study area of several investigations from ecological interactions (Alvarez-Mieles Citation2019), macroinvertebrates (Van den Bossche Citation2009), fish (Ochoa Ubilla et al. Citation2017), water quality (Alvarez-Mieles et al. Citation2021) and ecotourism (Vera Leon Citation2020). Ecotourism activities in the wetland started increasing since the wetland was declared Ramsar site in 2000. Currently, an itinerary named “safari fluvial” along the main wetland branches to appreciate the local biodiversity is one of the main activities (Vera Leon Citation2020) together with the “regattas” (A. Moran pers comm, 2019), both during the wet season.
7.6. Dealing with data limitations and uncertainties
Regarding available data, a topographic map of the wetland was elaborated based on several sources from different institutions (Section 2.1.1), followed up by an insitu topographic data collection campaign that allowed the refinement of essential points of the wetland topography. The indirect calculation of the Nuevo River discharges via a correlation analysis (Section 3.2) constituted our best suitable way forward to overcome the data limitations. However, both the DEM and the correlation analysis implemented in this study contain uncertainties. In view of these uncertainties, the model results presented in this article need to be considered as an “indication” of the hydrodynamics behaviour in this wetland.
Despite these limitations, our results contribute to overcome one of the main pitfalls known in wetland management (wetlands considered as standalone elements), and more specifically the lack of understanding on how the AdM wetland is connected to the Nuevo River, and to which extent the wetland is depending on its surrounding river catchment. Thus, our results provide indications on the relative importance of the different inflow conditions, as well as on spatial and temporal inundation patterns, velocities, and residence times under different hydrological conditions, from dry to extremely wet years. Temporal patterns of inundation area (including minimum and maximum historical scenarios) provided an indication on the overall range of inundation areas that AdM wetland has faced historically in the past 50 years.
8. Conclusions and recommendations
The AdM wetland is subject to hydrological conditions that exhibit a clear seasonal variability. The inundation volumes and areas vary by more than a factor of three between dry and wet years. Consequently, the wetland is experiencing large variations in inundation area, water depth, and flow velocities. Overall, it can be concluded that the wetland is a highly dynamic system in terms of its seasonal hydrological forcing and hydrodynamic response. In order to verify the hydrological regime and hydrodynamic flows in the river-wetland system, it is strongly recommended to install two streamflow gauging stations: one at the entrance of the Nuevo River and one at the outflow of “El Recuerdo” subbasin. In this study, the Nuevo River inflow was derived from a correlation analysis using the Quevedo gauging station, and not with a direct measurement at the entrance of the Nuevo River inflow. Inside the wetland, the limnimetric station stopped functioning in 2007, thus a new water level station is recommended for continuously measuring water level fluctuations in the wetland. A pluviometric station inside the wetland is also required. A new discharge gauging station at “El Recuerdo” and the pluviometric station inside the wetland can be of great help to reduce uncertainties and improve model outputs.
The numerical modelling approach enabled to improve the understanding of how this tropical river-wetland system works. Since hydrology and hydrodynamics are key drivers for wetland underlying ecological processes, this work provides a basis for subsequent studies that integrate physical and ecological processes: (i) nutrients availability and primary production (Alvarez-Mieles et al. Citation2021); (ii) relation between biotic communities and abiotic components; (iii) habitat for aquatic communities (Alvarez-Mieles et al. Citation2019), among others. In addition, the findings of this study become essential for assessing future conditions in this wetland system e.g. due to increase in water intake for agriculture, effects of dam operation, and implications of climate change.
The outcomes of this study were shared with local communities, and environmental authorities, with the aim to increase awareness and bridge the gap between scientific studies and policy makers. An overall understanding of AdM system is essential for the development of a management plan and the application of an Integrated River Basin Management approach for this river-wetland system.
Supplemental Material
Download MS Word (3.9 MB)Acknowledgments
This study was part of the Ph.D. research of the first author (funded by NUFFIC-The Netherlands Fellowship Programme), and the M.Sc. of the second author (funded by ERASMUS Mundus Fellowship). The sampling campaign was sponsored by the EU WETwin Project. Hydrological and meteorological data was provided by INAMHI (Instituto Nacional de Meteorología e Hidrología-Ecuador). The National Institute of Fisheries (INP) in Guayaquil-Ecuador provided support with the logistics. Topographic survey was developed by Juan Carlos Pindo and Mijail Arias-Hidalgo from ESPOL (Escuela Superior Politécnica del Litoral) in Guayaquil-Ecuador. Special thanks to Mijail Arias-Hidalgo for his valuable work setting up the 1D hydrodynamic model from the surrounding river catchment. His work was essential in providing the basis for setting the 2D model of the present article. We appreciate the support from Abdón Moran for facilitating the boat motors. Special thanks to the local inhabitants of Abras de Mantequilla wetland, Telmo España, Jimmy Sanchez, Angel Sanchez and Simon Coello for boat transportation and for sharing their valuable local knowledge.
Disclosure statement
No potential conflict of interest was reported by the authors.
Related Research Data
References
- Alvarez-Mieles G. 2019. Ecological modelling of river-wetland systems: a case study for the Abras de Mantequilla wetland in Ecuador [PhD thesis]. The Netherlands: Water Sciences and Engineering. IHE-Delft.
- Alvarez-Mieles G, Corzo G, Mynett AE. 2019. 6 - Spatial and temporal variations′ of habitat suitability for fish: a case study in Abras de Mantequilla Wetland, Ecuador. In: Corzo, G. & E. A. Varouchakis (eds), Spatiotemporal analysis of extreme hydrological events. Elsevier; p. 113–141.
- Alvarez-Mieles G, Irvine K, Griensven AV, Arias-Hidalgo M, Torres A, Mynett AE. 2013. Relationships between aquatic biotic communities and water quality in a tropical river–wetland system (Ecuador). Environ Sci Policy. 34(0):115–127.
- Alvarez-Mieles G, Spiteri C, Troost TA, Mynett AE. 2021. Water quality and primary production dynamics of a tropical river-wetland system: a case study for the Abras de Mantequilla wetland, Ecuador (submitted).
- Arias-Hidalgo M, Villa-Cox G, Griensven AV, Solórzano G, Villa-Cox R, Mynett AE, Debels P. 2013. A decision framework for wetland management in a river basin context: The “Abras de Mantequilla” case study in the Guayas River Basin. Ecuador. Environ Sci Policy. 34(0):103–114.
- Arias-Hidalgo M. 2012. A decision framework for integrated wetland-river basin management in a tropical and data scarce environment. [PhD thesis].Delft, The Netherlands: UNESCO-IHE, Institute for Water Education . p. 180.
- Barrera Crespo PD, Mosselman E, Giardino A, Becker A, Ottevanger W, Nabi M, Arias-Hidalgo M. 2019. Sediment budget analysis of the Guayas River using a process-based model. Hydrol Earth Syst Sci. 23(6):2763–2778.
- Blauw AN, Los HFJ, Bokhorst M, Erftemeijer PLA. 2009. GEM: a generic ecological model for estuaries and coastal waters. Hydrobiologia. 618(1):175–198.
- Boulton AJ. 2003. Parallels and contrasts in the effects of drought on stream macroinvertebrate assemblages. Freshwater Biol. 48(7):1173–1185.
- Brock MA, Nielsen DL, Shiel RJ, Green JD, Langley JD. 2003. Drought and aquatic community resilience: the role of eggs and seeds in sediments of temporary wetlands. Freshwater Biol. 48(7):1207–1218.
- Chen Q, Wu W, Blanckaert K, Ma J, Huang G. 2012. Optimization of water quality monitoring network in a large river by combining measurements, a numerical model and matter-element analyses. J Environ Manage. 110:116–124.
- Damanik-Ambarita M, Everaert G, Forio M, Nguyen T, Lock K, Musonge P, Suhareva N, Dominguez-Granda L, Bennetsen E, Boets P, et al. 2016a. Generalized linear models to identify key hydromorphological and chemical variables determining the occurrence of macroinvertebrates in the Guayas River Basin (Ecuador). Water. 8(7):297.
- Damanik-Ambarita MN, Boets P, Nguyen Thi HT, Forio MAE, Everaert G, Lock K, Musonge PLS, Suhareva N, Bennetsen E, Gobeyn S, et al. 2018. Impact assessment of local land use on ecological water quality of the Guayas river basin (Ecuador). Ecol Inf. 48:226–237.
- Damanik-Ambarita MN, Lock K, Boets P, Everaert G, Nguyen THT, Forio MAE, Musonge PLS, Suhareva N, Bennetsen E, Landuyt D, et al. 2016b. Ecological water quality analysis of the Guayas river basin (Ecuador) based on macroinvertebrates indices. Limnologica Ecol Manage Inland Water. 57:27–59.
- Davidson NC. 2014. How much wetland has the world lost? Long-term and recent trends in global wetland area. Mar Freshwater Res. 65(10):934–941.
- Deltares 2013a., Delft3D-FLOW User Manual. Simulation of multi-dimensional hydrodynamic flows and transport phenomena, including sediments. Delft, The Netherlands: Deltares, p. 702.
- Dodson CH, Gentry AH. 1991. Biological extinction in Western Ecuador. Ann Missouri Botanical Garden. 78(2):273–295.
- Domínguez E, Dawson CW, Ramírez A, Abrahart RJ. 2011. The search for orthogonal hydrological modelling metrics: a case study of 20 monitoring stations in Colombia. J Hydroinform. 13(3):429–442.
- Florencio A. 1993. Estudio bioecológico de la laguna Abras de Mantequilla. Vinces-Ecuador. Revista Ciencias Mar Limnologia. 3(1):171–192.
- Galecio E. 2013. Hydrodynamic and Ecohydrological modelling in a tropical wetland: The Abras de Mantequilla wetland (Ecuador). [MSc thesis]. Delft, The Netherlands: Water Sciences and Engineering Department, UNESCO-IHE, p. 139.
- Halls AJ. 1997. (ed.) Wetlands, biodiversity and the Ramsar convention: The Role of the convention on wetlands in the conservation and wise use of biodiversity. Gland, Switzerland: Ramsar Convention Bureau.
- HydroTest n.d. HydroTest statistical assessment of hydrological forecasts. https://hydrotest.org.uk/HTMain.html.
- Johnston R, Cools J, Liersch S, Morardet S, Murgue C, Mahieu M, Zsuffa I, Uyttendaele GP. 2013. WETwin: A structured approach to evaluating wetland management options in data-poor contexts. Environ Sci Policy. 34(0):3–17.
- Lake PS. 2003. Ecological effects of perturbation by drought in flowing waters. Freshwater Biol. 48(7):1161–1172.
- Li H, Arias M, Blauw A, Los H, Mynett AE, Peters S. 2010. Enhancing generic ecological model for short-term prediction of Southern North Sea algal dynamics with remote sensing images. Ecol Modell. 221(20):2435–2446.
- MAE 2003., Titulo IV Reglamento a la Ley de Gestión Ambiental para la Prevención y Control de la Contaminación Ambiental; Libro VI de la Calidad Ambiental. Texto Unificado de Legislación Secundaria del Ministerio del Ambiente del Ecuador. Anexo 1 Norma de Calidad Ambiental y de Descarga de Efluentes: Recurso Agua; D.E. 3399 R.O. 725, Diciembre 16, 2002 & D.E. 3516 R.O. Edición Especial N° 2, Marzo 31., Ecuador.
- Matthews GVT. 1993. The Ramsar convention on wetlands: its history and development. Gland, Switzerland: Ramsar Convention Bureau.
- Mitsch WJ, Gosselink JG. 2007. Wetlands, 4th ed. Hoboken, NJ: John Wiley & Sons, p. 582.
- Mynett AE. 2002. Environmental Hydroinformatics: the way ahead (opening keynote). 5th International Conference on Hydroinformatics, 1:p. 31–36. Cardiff, UK: IWA Publishing.
- Nash JE, Sutcliffe JV. 1970. River flow forecasting through conceptual models part I – A discussion of principles. J Hydrol. 10(3):282–290.
- Nguyen THT, Forio MAE, Boets P, Lock K, Damanik Ambarita MN, Suhareva N, Everaert G, Van der Heyden C, Dominguez-Granda LE, Hoang THT, et al. 2018. Threshold responses of macroinvertebrate communities to stream velocity in relation to hydropower dam: a case study from The Guayas River Basin (Ecuador). Water. 10(9):1195.
- Ochoa Ubilla BY, Mendoza Nieto KX, Vivas Moreira R, Urdánigo Zambrano J, Ferrer-Sánchez Y, 2017. Estructura de tallas de captura y relación longitud-peso de peces nativos en el humedal Abras de Mantequilla, Ecuador. cyt. 9(2):19–27.
- Poff NL, Brinson MM, Day JW. 2002. Aquatic ecosystems and global climate change. Technical Report, Pew Center on Global Climate Change, Arlington, p. 1–36.
- Prado M, P. Macías J, Cajas E, Elías, Revelo W, CF. 2004. Prediagnostico de las condiciones fisicas, quimicas y biologicas en el sistema hidrico de la Provincia de Los Rios. Guayaquil, Ecuador: National Institute of Fisheries (INP), p. 29. [In Spanish]
- Prado M, Revelo W, Castro R, Bucheli R, Calderón G, Macías P. 2012. Caracterización química y biológica de sistemas hídricos en la Provincia de Los Ríos-Ecuador. Guayaquil, Ecuador: Instituto Nacional de Pesca, p. 100. [In Spanish]
- Prado M. 2009. Aspectos biologicos y pesqueros de los principales peces de aguas continentales de la provincia de Los Ríos durante Julio del 2009. Boletin Cientifico Técnico Instituto Nacional Pesca. 5:11–13.
- Quevedo O. 2008. Ficha Ramsar del Humedal Abras de Mantequilla – Ecuador, Guayaquil, Ecuador. [In Spanish]. English version available in: https://rsis.ramsar.org/ris/1023
- Ramsar 2010., River basin management: Integrating wetland conservation and wise use into river basin management. Ramsar handbooks for the wise use of wetlands. Vol. 9, 4th ed. Ramsar Convention Secretariat, Gland, Switzerland, p. 90.
- Ramsar 2014., The list of wetlands of international importance. http://www.ramsar.org/pdf/sitelist.pdf.
- Revelo W. 2010. Aspectos Biológicos y Pesqueros de los principales peces del Sistema Hídrico de la Provincia de Los Ríos, durante 2009. Boletin Cientifico Técnico Instituto Nacional Pesca. 20(6):53–84. [In Spanish.]
- Shamir U, Verhoeven JTA. 2013. Management of wetlands in river basins: The WETwin project. Environ Sci Policy. 34(0):1–2.
- Smits J. 2007. Development of DELFT3D ECO. Calibration for a tropical stratified reservoir in Singapore. Delft, the Netherlands: WL-Delft Hydraulics.
- Spiteri C, Maren B. v, Kessel T. v, Dijkstra J. 2011. Effect Chain modelling to support Ems-Dollard management. J Coast Res. 61:226–233.
- Takeoka H. 1984. Fundamental concepts of exchange and transport time scales in a coastal sea. Cont Shelf Res. 3(3):311–326.
- Van Asselen S, Verburg PH, Vermaat JE, Janse JH. 2013. Drivers of wetland conversion: a global meta-analysis. PLoS One. 8(11):e81292–13.
- Van den Bossche M. 2009. Performance of biological indices based on macroinvertebrate communities in the assessment of the Abras de Mantequilla wetland (Ecuador). MSc, Gent Universiteit, Gent, Belgium, 94.
- Velez C. 2006. Integrated Water Quality and Ecosystem Modelling a Case Study for Sonso Lagoon, Colombia [MSc thesis]. Delft: Water Sciences and Engineering, Hydroinformatics Department, UNESCO-IHE. p. 137.
- Vera Leon J. 2020. Determinación de la potencialidad turística de la avifauna del humedal Ramsar Abras de Mantequilla para el diseño de un recorrido aviturístico. Bachelor, Carrera de Turismo, Universidad de Guayaquil, Guayaquil, Ecuador.