
 ?Mathematical formulae have been encoded as MathML and are displayed in this HTML version using MathJax in order to improve their display. Uncheck the box to turn MathJax off. This feature requires Javascript. Click on a formula to zoom.
ABSTRACT
Objective
The aim of this work was to examine the fidelity and validity of an aviation simulation using eye tracking.
Background
Commercial head-mounted virtual reality (VR) systems offer a convenient and cost-effective alternative to existing aviation simulation (e.g., for refresher exercises). We performed pre-implementation testing of a novel aviation simulation, designed for head-mounted VR, to determine its fidelity and validity as a training device.
Method
Eighteen airline pilots, with varying levels of flight experience, completed a sequence of training ‘flows.’ Self-reported measures of presence and workload and users’ perceptions of fidelity were taken. Pilots’ eye movements and performance were recorded to determine whether more experienced pilots showed distinct performance and eye gaze profiles in the simulation, as they would in the real-world.
Results
Real-world expertise correlated with eye gaze patterns characterized by fewer, but longer, fixations and a scan path that was more structured and less random. Multidimensional scaling analyses also indicated differential clustering of strategies in more versus less experienced pilots. Subjective ratings of performance, however, showed little relationship with real-world expertise or eye movements.
Conclusion
We adopted an evidence-based approach to assessing the fidelity and validity of a VR flight training tool. Pilot reports indicated the simulation was realistic and potentially useful for training, while direct measurement of eye movements was useful for establishing construct validity and psychological fidelity of the simulation.
Introduction
Alongside surgery, the aviation industry has traditionally led the way in developing high-fidelity synthetic training environments (e.g., see, Caro, Citation1973). However, despite being highly advanced and widely accepted within the field, aircraft simulators are very expensive and often hard to access. Therefore, there is a niche for more cost-effective and portable methods of simulation to bridge the gap between classroom instruction and high-fidelity aviation simulators. Commercial standalone virtual reality (VR) headsets could address this need and provide additional flexibility for preparatory or refresher training. The value of this approach for addressing skill fade issues has been highlighted by the recent pandemic, where more than two-thirds of the world’s 22,000 mainline passenger airliners were grounded at one point (Source: flightglobal.com). Consequently, new methods for refresher training need to be developed and tested.
For commercial VR technologies to be effective in aviation training, they must support sufficient transfer of learning from the VR environment to the real environment (see, Barnett & Ceci, Citation2002). Indeed, the ultimate test of a VR training environment is not whether it looks and feels authentic, but whether it generates improvements in real-world skilled performance. Crucially, various outcomes that predict transfer of learning can be determined before a simulation is implemented. Harris and colleagues (Harris et al., Citation2020) have recently outlined a conceptual framework to help guide such evidence-based testing, through evaluating whether training is sufficiently realistic to drive ‘real-world’ skill improvements. The present work adopts these recommendations to examine a novel VR flight simulator, designed to (re)train flight competencies in commercial airline pilots.
Harris et al. (Citation2020) outline fidelity and validity as key concepts for pre-implementation testing of simulated environments. Fidelity refers to the realism of the simulator; in particular, the similarity of the visual elements with the real environment, but also the realism of the affective states, cognitions, or behaviors that the simulation elicits from its users (Gray, Citation2019; Harris et al., Citation2020; Perfect et al., Citation2014). Hence fidelity contains many subtypes, like physical, psychological, affective, and biomechanical fidelity. The most important types of fidelity will depend on the goals of the training. In a medical context, for instance, a VR exposure therapy tool which aims to desensitize the user to an aversive stimulus (e.g., Botella et al., Citation2007) requires high affective fidelity (achieving realistic emotional responses). However, realistic movements (biomechanical fidelity) will most likely be peripheral to training success. One way of assessing the overall fidelity of an environment is to measure users’ sense of presence, that is their experience of actually existing inside the virtual environment (Baños et al., Citation2004; Slater, Citation2009; Slater & Sanchez-Vives, Citation2016). If the environment is not sufficiently realistic to immerse the user, then their sense of presence will be limited. This is an approach that has previously been adopted when testing sporting simulators (e.g., Harris, Buckingham, et al., 2020b; Le Noury et al., Citation2020).
Validity refers to whether a test, model, measurement, or simulation provides an accurate representation of its real equivalent. Two key types of validity exist in the context of VR training (see, ): face validity, which is a user’s subjective view of how realistic a simulation is, and construct validity, which is a more objective assessment of the correspondence between the real and virtual tasks (Bright et al., Citation2012; Harris, Buckingham et al., Citation2021; Wood et al., Citation2021). Face validity is closely related to aspects of fidelity (particularly physical fidelity) but refers to the more subjective assessment by the user of whether the technological features of the system, which constitute its fidelity, are ‘good enough’ to provide a compelling experience. Assessments of face validity often depend on user feedback about the realism of a simulator, as is commonly performed for surgical (Bright et al., Citation2012; Sankaranarayanan et al., Citation2016) and flight (Perfect et al., Citation2014) simulators. Achieving good face validity is an initial step that is important to meet, as it may be a barrier to users engaging with the training. However, it will not ensure that training is actually effective (Dahlstrom et al., Citation2009). Construct validity, on the other hand, depends on some level of functional correspondence between the real and VR tasks. Consequently, a good indicator of construct validity is whether real-world expertise equates to expertise in the simulator. If so, this indicates a functional correspondence between the real and VR tasks that should support effective training (Harris et al., Citation2020). Comparisons of novice versus expert performers in the simulation is, then, a good way to establish construct validity (e.g., as in Bright et al., Citation2012; Harris et al., Citation2021; Wood et al., Citation2021).
Table 1. Summary of VR terminology.
In the present work we tested a novel aviation training tool (see, ), developed for commercial VR platforms, which simulates key scenarios used in the process of commercial Type Rating pilot certification. During the early stages of training, trainee pilots are expected to quickly become familiar with the flight deck, control location, and orientation (Adanov et al., Citation2020; Valenta, Citation2018). Traditionally, this is achieved using paper mock-up flight decks and 2D computer learning. However, this approach fails to deliver on some of the keys aspects of effective learning that support transfer of training, such as active and exploratory practice (Freeman et al., Citation2014; Prince, Citation2004). The simulation described in this work aims to provide active practice of core competency drills to allow pilots to refresh their skills in a realistic way. Pilots can familiarize themselves with the flight deck and learn the position and function of controls, as well as practicing fault responses and ‘flow check’ procedures.
Figure 1. View from within the simulation showing the cockpit and the pilot avatar.
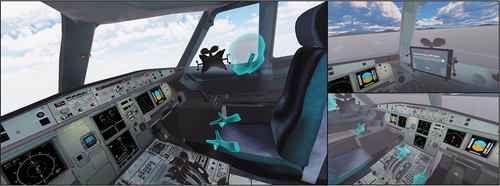
The simulation that was developed was also embedded with eye tracking technology, which is now a common feature of many commercial VR headsets. Eye tracking has been widely used in the study of human performance, both as a way to index expertise (Brams et al., Citation2019; Gegenfurtner et al., Citation2011; Janelle & Hatfield, Citation2008; Wilson et al., Citation2015) and as a way to accelerate learning (Causer et al., Citation2011; Vine & Wilson, Citation2011). Although eye movements are heavily context-dependent, experts generally show highly efficient gaze control and are able to extract the most important information from the environment when performing skilled actions and decision-making operations. For instance, aeronautical studies have shown that pilots’ visual scanning strategies develop with level of expertise (Haslbeck et al., Citation2012; Haslbeck & Zhang, Citation2017; Yang et al., Citation2013; Ziv, Citation2016), and generally reflect a move toward shorter and more frequent fixations indicative of more rapid scanning of the instruments. Lounis et al. (Citation2021) found shorter dwell times, and more complex transition sequences as indexed by entropy and Lempel-Ziv complexity. Consequently, as well as looking at the relationship between real-world expertise and simulator performance (i.e., construct validity), we aimed to assess whether real-world experts showed different gaze behaviors in the simulation. Eye movement differences would indicate that the simulation had good psychological fidelity in that it was sufficiently realistic to elicit different cognitions and visual behaviors between novices and experts, much as the real world would (Gray, Citation2019; Harris, Bird, et al., Citation2020).
In summary, the objectives of this study were to perform a number of pre-implementation assessments of the aircrew competency training simulation, guided by a recent framework for testing simulated training environments (Harris et al., Citation2020). Firstly, we assessed users’ sense of presence in the simulation to test fidelity and collected expert reports on the face validity of the simulation as a training tool. We also aimed to assess the relationship between real-world expertise and performance (expert ratings) to establish construct validity. To further assess the construct validity and psychological fidelity of the simulation, we next examined the relationship between real-world expertise and eye movement indicators of expertise. It was predicted that if the simulation accurately recreates the demands of the real skill there should be relationships between real-world experience, performance in the simulation, and eye movement indicators of expertise. We implemented a dimension reduction technique, known as Multidimensional Scaling, to establish whether there was a clear clustering of eye gaze strategies (i.e., a signature of expertise) for more and less experienced pilots. In addition, we collected descriptive measures of workload to understand the cognitive and attentional demands placed on users. Together, these pre-implementation assessments were designed to provide an early indicator of whether the simulation will be an effective training tool.
Methods
Participants
Participants were all airline pilots, recruited through an opportunity sample of attendees at the L3 Harris Airline Academy (Crawley, Gatwick, UK). Inclusion criteria required that these individuals were familiar with A320 aircraft systems, but they did not have to be type rated or have had any particular number of flight hours (real or simulated). Eighteen participants (17 male, 1 female) took part in the testing. Participants had a mean age of 39.2 years (SD = 14.3, range = 22–62) and held a range of flight-related roles, including seven Captains, five cadets, two first officers, and two Type Rating Instructors. They had an average of 2856.2 hours flying experience on A320 series aircraft (SD = 2819.0, range = 0–7500). As we used an opportunity sample to access this skilled population, no a priori power calculation was conducted, but in order to understand the type of effects we were powered to detect we ran a sensitivity analysis using G*Power (Faul et al., Citation2007). For the correlational analyses, 18 participants were sufficient to detect an effect of r = 0.67 with 90% power, r = .6 with 80% power, or r = 0.5 with 60% power, given a two tailed test and α = 0.05. Prior to data collection the study procedures were reviewed by the departmental ethics review board at the University of Exeter and all participants signed an informed consent form when attending testing.
Design
We adopted an observational design with all participants completing the same flight scenarios, the order of which was counterbalanced across participants to account for any practice effects.
Tasks and Materials
The VR environment was built using Unity (2019.4; Unity technologies, CA) and C# and displayed using the Pico Neo 2 eye headset (Pico Interactive, San Francisco, CA, US). The Pico Neo 2 headset is a 6-degrees-of-freedom standalone headset with a 101° degree field of view and weighs 690 grams. The headset has inbuilt eye tracking which records pupil position at 90 Hz, to a spatial accuracy of 0.5°. The eye tracking functionality was integrated into the VR environment using the Pico SDK for Unity.
A total of seven flight scenarios were simulated, each of which form part of the Type Rating certification process that is required for flying a commercial jet. During these simulations, participants interacted with a virtual flight-deck environment (illustrated in ) and performed a series of tasks using the Pico hand controllers. Three exercises were ‘flow’ scenarios, where pilots conducted a predetermined sequence of actions that confirm switch positions and control settings for a given stage of flight. Specifically, we simulated the After Start Flow, Taxi Flow, and After Landing Flow procedures that are specified for A320 aircraft operations (see, ). Participants undertook the role of ‘Pilot Flying’ for these customary safety routines and were informed that they must complete each action in the correct, pre-specified order to progress through the task. Furthermore, four ‘fault’ exercises were also simulated, where pilots undertook the role of ‘Pilot Monitoring’ and were tasked with responding to common, unanticipated flight issues through interactive electronic display checks and simple procedural movements (see, for an overview). Participants were told that they could take short breaks and remove the headset between scenarios, and that they could take the headset off at any time if they felt uncomfortable. Some chose to take breaks out of the headset between scenarios while others chose to remain in VR.
Table 2. Simulated aviation scenarios in the virtual-reality training tool.
For assessment of psychological fidelity, analyses focused on gaze responses in just the Rejected Take-Off and Blue System Hydraulics faults. In the former scenario, pilots were required to perform a number of safety-critical visual checks and monitoring operations upon receiving a number of consecutive safety alerts on the runway. Such behaviors would be reflected in their dynamic gaze responses (e.g., in their fixation patterns and scanning strategies, as in Haslbeck et al., Citation2012; Haslbeck & Zhang, Citation2017; Yang et al., Citation2013). Conversely, the Blue System Hydraulics fault was selected because it included an additional voice-over cue, where pilots were informed about an ongoing safety issue within the cabin (see, ). Importantly, this additional safety alert did not require a response from the pilots; it simply served to ‘surprise’ participants in a manner that could be potentially disruptive to their attentional control (e.g., see, Landman et al., Citation2017). Therefore, analysis focused on the efficiency of gaze control during these heightened, potentially-distracting task demands.
Measures
Expertise
To quantify flying expertise, participants self-reported the following information: total number of flying hours accumulated on A320 aircrafts; command hours on Generation 3 or 4 commercial aircraftsFootnote1; and number of months since their last A320 flight.
Self-report
After undergoing all flight scenarios participants removed their headset and completed the following self-report measures:
Presence
To understand the user experience and the fidelity of the environment, participants reported their experience of presence using a validated questionnaire (the Presence Questionnaire; see, Slater et al., Citation1995). The Presence Questionnaire consists of six questions (each on a scale of 1–7) about whether users felt as though they really existed in the VR environment. Interpretation was based on the scale anchors, with scores above the mid-point indicating that users felt more like they existed in the virtual world than the real world (as in Usoh et al., Citation2000).
Workload
The Simulation Task Load Index (SIM-TLX; Harris et al., Citation2019) was used to assess the level of cognitive demand experienced during the simulation. The SIM-TLX is an adaptation of the NASA-TLX (Hart & Staveland, Citation1988) for measuring workload in VR. A 21-point scale is used to index the following nine bipolar workload dimensions: mental demands; physical demands; temporal demands; frustration; task complexity; situational stress; distractions; perceptual strain; and task control. The participant is asked to rate the level of demand they felt during the preceding task for each of the nine aspects of workload from ‘very low’ to ‘very high.’ This allows different aspects of workload to be assessed individually. The SIM-TLX has been used previously for evaluating VR training environments (Harris, Hardcastle et al., Citation2021; Sudiarno & Wahyuni, Citation2020).
Face Validity
We used a bespoke questionnaire to assess the face validity of the simulation. On a scale of 1–10, participants were asked to indicate whether they thought the environment and the movements were convincing, whether they would be motivated to use the tool again, and whether they thought it would be a useful training device (full questionnaire is available here: https://osf.io/c2tz9/). Values that are above the mid-point on this scale (i.e., ≥ 6) indicate support for these itemized statements.
Performance
Task performance in the two fault scenarios was scored by an expert flight trainer. The behavior of all the participants was saved in a custom binary file which enabled each of the scenarios to be replayed by the research team. The expert trainer rated pilot’s performance in relation to the following domains: knowledge; leadership and teamwork; problem solving; situational awareness; workload management; application of knowledge, and communication. Scores were aggregated to provide an overall performance metric. When some of the performance domains could not be accurately assessed (e.g., if the recording temporarily froze), the performance score was aggregated over the remaining dimensions.Footnote2
Eye Movements
The following metrics were used to index pilots’ strategy for scanning and monitoring the displays during the fault scenarios.
Entropy
Entropy, as a concept from information theory (Shannon, Citation1948), describes uncertainty about outcomes. When applied to eye tracking it indexes the level of randomness or variability in eye movements and has been previously used in assessing aviation performance (Allsop & Gray, Citation2014; Lounis et al., Citation2021; Vine et al., Citation2015) and can index whether a pilot is performing a structured and systematic scanning pattern, or a highly variable and inefficient one (Lounis et al., Citation2021). We adopted a simple measure of entropy described by Shannon and Weaver (Citation1949), sometimes referred to as Gaze Transition Entropy (Lounis et al., Citation2021) which quantifies the complexity of the scan in ‘bits,’ according to the formula:
This formula describes the sum of the probabilities of fixating each area of interest (AOI), conditional upon the previously fixated AOI, with i representing the “from” AOI and j representing the “to” AOI. If gaze location was strategic and directed at only important sequences of locations, entropy would likely be low.
Inter-saccadic Angles (Spatial Anisotropy)
The size of inter-saccadic angles can be used to describe the pathway of successive saccades. Persistent saccades continue moving in a similar direction while anti-persistent saccades return in the (approximately) opposite direction. A higher proportion of antipersistent saccades may indicate that a search has been terminated quickly, or that eye movements are moving back and forth across the cockpit a lot. Following Amor et al. (Citation2016), we first calculated the intersaccadic angle, that is the change in angle between successive saccades and could then identify persistent and antipersistent saccades. Intersaccadic angle (θd) was defined as
where and
are the change in the x and y components of the i-th saccade such that
equates to the difference in angle between successive saccades. Persistent saccades were operationalized as those continuing in the same direction (within 90° in either direction) and antipersistent as those that changed direction (more than 90° change).
Fixation Rate and Search Rate
Fixation rate refers to the number of visual fixations made per second. Search rate is a development of fixation rate and is calculated from the number of fixations divided by duration, and indexes whether pilots are using a visual strategy of a few long fixations or dwells (low search rate) or more frequent and shorter fixations (high search rate) to attend to more locations more quickly. Search rate has previously been used as a metric to characterize visual search behavior (Harris, Buckingham et al., Citation2021; Janelle, Citation2002; Williams et al., Citation1994) and index expertise (Janelle & Hatfield, Citation2008; Williams, A. Mann et al., Citation2007).
Saccade Amplitude
The distance between the initiation location and the termination of each saccade (in degrees of visual angle) was calculated to capture whether pilots were making large shifts in their gaze location, or smaller movements to nearby areas.
Data Analysis
Participants’ combined binocular gaze vector, head position and rotation (x,y,z; pitch, yaw, roll), and gaze intersection points (i.e., where the gaze vector collided with the virtual world) were recorded from the virtual environment and analyzed using an automated approach in MATLAB (Mathworks, MA, US). Eye-tracking data were first resampled to a consistent 60 Hz and then denoised using a dual-pass, zero-phase Butterworth filter at 30-Hz (Fooken & Spering, Citation2019). Gaze fixations – periods in which the eye was stable on a location – were detected using a spatial dispersion algorithm (Krassanakis et al., Citation2014). Fixation events were operationally defined as clusters of successive gaze point records that fell within 1° of visual angle for >100 ms (Salvucci & Goldberg, Citation2000). Saccades were operationalized as portions of data where gaze acceleration (°/s2) exceeded five times the median acceleration (as in D. L. Mann et al., Citation2019). Saccade onset and offset times were identified from acceleration minima and maxima (Fooken & Spering, Citation2020). Gaze analysis code is available online: https://osf.io/c2tz9/.
Statistical analysis was conducted using JASP v0.15 (JASP Team, Citation2021). Univariate outliers (p < .001) for gaze and kinematic variables were identified and Windsorised by changing the outlying values to 1% larger (or smaller) than the next most extreme score (Tabachnick & Fidell, Citation1996). This was only required for one fixation duration value. The demographic data for one participant was missing, so they were excluded from all analyses that required demographic data (i.e., correlations with expertise). A series of Pearson’s correlations (or Spearman’s where data deviated substantially from normality) were used to examine relationships between eye movement and expertise related variables. Bayes factors (BF10), using a default Cauchy prior, were also calculated to further provide further evidence for the alternative over the null. We adopt the convention that BF10 > 3 indicates moderate support for the alternative model and BF10 > 10 indicates strong support (Van Doorn et al., Citation2019). All anonymized data is freely available and can be accessed from the Open Science Framework (https://osf.io/c2tz9/).
Results
Self-report
Face Validity
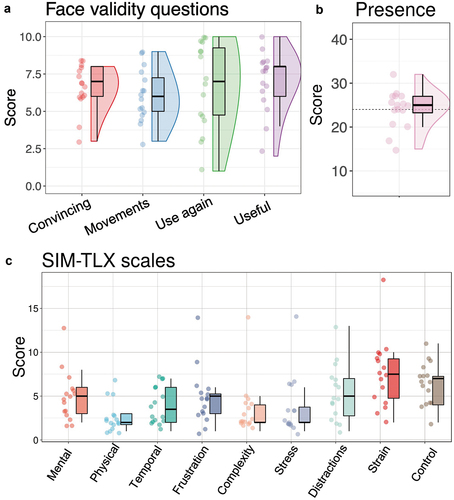
The results of the face validity questions indicated that users felt as though both the environment (mean = 6.4, SD = 1.7, on a 1–10 scale) and the movements (mean = 5.9, SD = 1.7) were convincing. There were a broader range of responses to the question ‘how eager are you to have another go?’ (see, ), but again the mean value was above the mid-point of the scale (mean = 5.6, SD = 2.9). The responses to the question ‘how useful do you think this is as a training device?’ were also clustered in the high range (mean = 7.0, SD = 1.9). Overall, these results suggested a largely positive response from the pilots, that supported the fidelity of the environment and its potential utility for training.
Figure 2. (a) Box and violin plot and raw data points of face validity questionnaire. Questions were: How convincing was the virtual environment? (Convincing); How convincing were the movements? (Movements); How eager are you to have another go? (Use again); How useful do you think this is as a training device? (Useful). (b) Box and violin plot of self-reported presence in the simulation. Graph axes extend to show the extremes of the scales and the dotted line shows the mid-point of the scale. (c) Box plot of workload dimensions scores on the SIM-TLX.
Presence
Results in show that presence scores clustered around and just above the mid-point of the scale (with a mean of 25.4, SD = 4.2), which ranged from 6 to 42. Users generally thought that the training tasks were believable and felt as though they really existed in the virtual environment, although four individuals did report lower scores. These scores suggest that most participants were immersed in the simulation.
Workload
The results of the workload measures (see, ) shows that physical demands and stress were low in the simulation, and that users did not find the task overly complex, which was as expected given the expertise of the participant group. The largest sources of workload were the perceptual strain felt by the users and some reported difficulty in controlling the simulation. However, in the context of the overall scale these scores were still low, suggesting that these factors would not have added too much extraneous load which could disrupt learning (Sweller, Citation1988).
Performance Scores
Relationship with Expertise
To understand whether performance was related to pilot experience (i.e., construct validity) we examined correlations between performance scores (trainer ratings) and A320 flight hours, command hours, and time since last A320 flight using Spearman’s correlations, but no significant relationships were present (see, ).
Table 3. Results of correlations between performance scores and experience.
Relationship with Eye Movement Metrics
Next, we explored relationships between performance and eye movement metrics using Spearman’s correlations, but only entropy approached significance (p = .053) in the blue reservoir fault. There were no other significant relationships (see, ).
Table 4. Results of correlations between performance scores and eye movement metrics.
Relationships between Eye Movement Metrics and Expertise
To assess the construct validity of the simulations we assessed the relationship between flying experience and eye movement indices of expertise (correlations between the eye movement metrics are shown in ). If the simulation is a sufficiently accurate representation of the real skill then some differences between more and less skilled pilots should be detectable in the simulation. All expertise metrics were skewed so Spearman’s correlations were used.
Rejected take-off Fault
A320 hours were weakly correlated with antipersistent saccades [r = −0.22, p = .39, BF10 = 0.49], saccade amplitude [r = −0.23, p = .38, BF10 = 0.46] and fixation rate [r = −0.22, p = .39, BF10 = 0.46]. But there was a moderate correlation with search rate [r = −0.32, p = .10, BF10 = 1.30], and a strong and significant correlation with entropy [r = −0.53, p = .03, BF10 = 2.79], indicating that more flight hours were related to more structured search behaviors (see, ).
Figure 3. Scatterplots with regression line and 95%CIs for relationships between expertise and entropy (a and b) and search rate (c and d) for the rejected take off fault, all showing significant relationships that suggest more experienced pilots exhibited more efficient search patterns in the simulation.
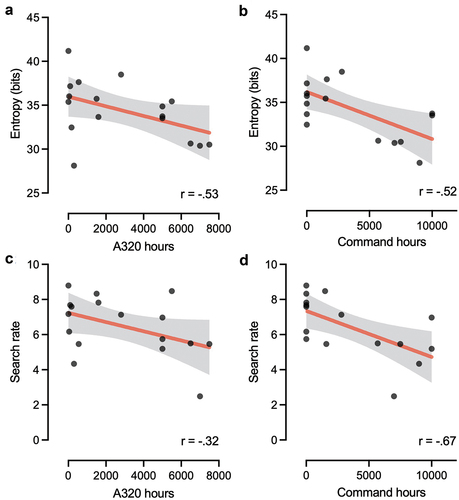
Command time showed a weak correlation with antipersistent saccades [r = −0.19, p = .48, BF10 = 0.50]. However there were strong and significant correlations with fixation rate [r = −0.55, p = .03, BF10 = 2.94], saccade amplitude [r = −0.52, p = .04, BF10 = 2.42], search rate [r = −0.67, p = .004, BF10 = 9.01], and entropy [r = −0.52, p = .04, BF10 = 1.67], which indicated that more command time corresponded to a slower (i.e., more efficient) visual search with smaller saccades, and less sporadic scan paths.
Greater time (months) since last A320 flight showed weak relationships with fixation rate [r = −0.10, p = .75, BF10 = 0.39], search rate [r = −0.30, p = .30, BF10 = 0.61], and entropy [r = −0.29, p = .31, BF10 = 0.72], but was strongly correlated with reduced saccade amplitude [r = −0.58, p = .03, BF10 = 3.60] and fewer antipersistent saccades [r = −0.61, p = .02, BF10 = 4.87]. These results suggest that pilots with less recent flight experience required prolonged visual searches to find specified target cues.
Blue Reservoir Fault
A320 hours showed moderate but non-significant correlations with saccade amplitude [r = −0.41, p = .10, BF10 = 1.00], and antipersistent saccades [r = −0.46, p = .06, BF10 = 0.89], but significant correlations with fixation rate [r = −0.52, p = .03, BF10 = 4.00], search rate [r = −0.49, p = .046, BF10 = 2.79], and entropy [r = −0.62, p = .008, BF10 = 5.76] (see, ). More time on A320 planes was related to slower, more efficient, and less random search patterns.
Figure 4. Scatterplots with regression line and 95%CIs for relationships between A320 flying hours and entropy (a), search rate (b), and fixation rate (c), and between command hours and entropy (d), percentage of antipersistent saccades (e), and fixation rate (f).
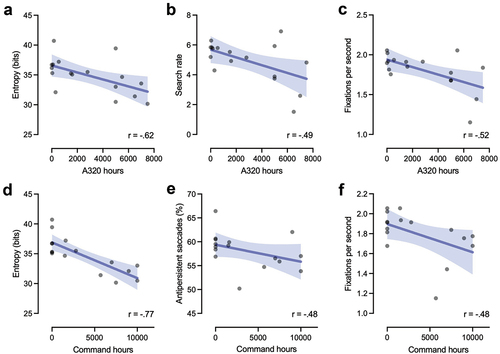
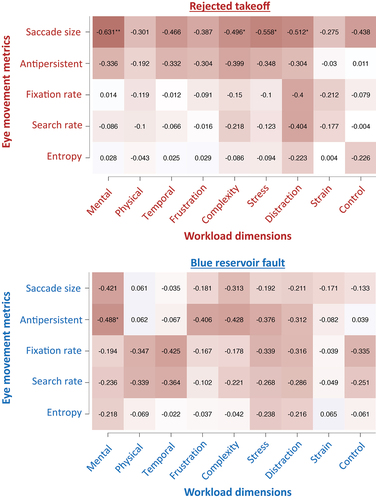
Figure 5. Correlation heat plots between workload dimensions and eye movement metrics. Darker colors represent stronger correlations and asterisks denote significant relationships. The plots suggest that saccade amplitude appeared to be related to several workload dimensions in the rejected take-off scenario, such as mental demands, task complexity, stress, and distraction. Antipersistent saccades also showed some moderate relationships with workload dimensions across both scenarios.
Command time showed moderate relationships with saccade amplitude [r = −0.33, p = .21, BF10 = 0.55], and search rate [r = −0.38, p = .15, BF10 = 0.90], moderate and marginally significant relationships with antipersistent saccades [r = −0.48, p = .06, BF10 = 1.41], and fixation rate [r = −0.48, p = .06, BF = 1.41], and a strong relationship with entropy [r = −0.77, p < .001, BF10 = 34.35] (see, ).
Time since last A320 flight was not significantly related to saccade amplitude [r = −0.11, p = .71, BF10 = 0.37], antipersistent saccades [r = −0.44, p = .12, BF10 = 1.04], fixation rate [r = −0.49, p = .08, BF10 = 1.28], or search rate [r = −0.25, p = .39, BF10 = 0.53], but was significantly related to entropy [r = −0.58, p = .03, BF10 = 3.60].
Individualized Eye Movement Strategies
Visual search expertise may not just be indexed by singular metrics, like entropy or search rate, but rather how they cluster together to form strategies. To further understand the scanning strategies of the pilots, we used Multidimensional Scaling (MDS) to analyze and visualize the differences and similarities between overall visual scanning strategies. MDS is a dimension reduction analysis technique, similar to Principal Components analysis,Footnote3 that has been widely applied for visualizing the similarities/ differences between data sets (Borg & Groenen, Citation2005). See, Słowiński et al. (Citation2016), Słowiński et al. (Citation2019) for applications to human movement analysis. By using MDS we can represent the visual strategy of each participant as a point in an abstract geometric space (where individuals who employ similar search rates, saccade amplitudes, etc, will cluster) and identify principal dimensions that best explain the relationships between these strategies. As is common when using MDS, we present the first two (i.e., most significant) dimensions of this abstract space for visualization purposes.
The results of the MDS analysis are presented in . The identification of the principal dimensions that explain variance in visual search strategy means that pilots with similar search rates, entropy, saccade sizes, etc, will cluster together in geometric space, allowing us to observe which individuals had similar overall strategies. This is visualized in Panel C, where participants were color coded based on splitting them into ‘more’ and ‘less’ experienced, based on A320 flight hours. Visual inspection of the flight hours distribution (see, Panel A) indicated a distinct grouping of those above and below 4000 hours, so this cutoff was used to dichotomize the experience data for the plot. The ellipses show 95% of the bivariate normal distribution of the more and less experienced pilots. There is a clear grouping of the more experienced pilots, showing that they used similar strategies. Meanwhile the less experienced pilots used, for the most part, alternative strategies.
Figure 6. Results of the Multidimensional Scaling. Panel C visualizes the first two MDS dimensions, where data points represent individual participants plotted in geometric space, so that dots closer to each other had more similar scanning strategies. Panel B shows the eigenvalues corresponding to the MDS dimensions, where the first two dimensions accounted for 86.67% of the variance. The correlation plot (Panel D) shows the relationship between the two principal MDS dimensions and our experience and performance metrics.
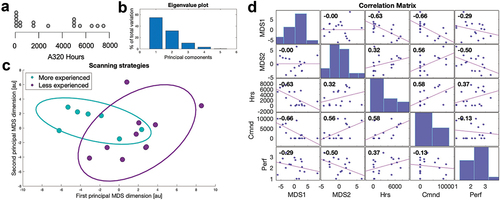
Correlations between the two principal MDS dimensions showed that MDS1 had a strong negative relationship with experience (both flight and command hours), and small to moderate negative relationship with trainer rated performance ( Panel D). Conversely, MDS2 had a moderate but positive relationship with experience, and negative relationship with performance. These correlations further illustrate that the overall strategies identified by MDS captured important dimensions indicative of experience and performance.
Discussion
In the present work we examined the fidelity and validity of an aircrew competency training simulation. VR offers many benefits for human factors training, including both pedagogical and practical advantages over physical training. However, it also has potential limitations in terms of realism and the likelihood of transfer of training. Consequently, VR training applications need to be developed and tested using evidence-based methods (Gray, Citation2019). We adopted a published framework for testing and evaluating simulated environments to explore whether the flight simulation met appropriate fidelity and validity criteria that would allow it to be an effective training tool (Harris, Bird, et al., Citation2020).
We firstly used self-report measures to assess the face validity of the simulation and whether users felt a sense of presence in the environment. Results (displayed in ) indicated that users felt the simulation was realistic and could potentially be a useful training device. In addition, users reported feeling a sense of presence in the simulation, suggesting that it was of sufficient fidelity to create an immersive experience. Although these assessments certainly do not guarantee that the simulation will be effective for training, a failure to create a tool that has face validity would likely be a barrier to engagement from users. Nevertheless, expert assessments of fidelity and face validity are an important method for testing flight simulators (Perfect et al., Citation2014) and the data suggested that this was achieved.
Next, we aimed to test the construct validity of the simulation by 1) examining the relationship between eye movement behaviors and real-world expertise and 2) by examining the relationship between performance in the simulator tasks and real-world expertise. If the simulation is an accurate representation of the real task, then the differences between more and less skilled performers that are present in the real-world should also be present in the simulated environment. Previous research has shown that more experienced pilots show different visual search behaviors compared to their more novice counterparts (Haslbeck et al., Citation2012; Haslbeck & Zhang, Citation2017; Yang et al., Citation2013; Ziv, Citation2016). Eye movement differences were also detected here, with the search behaviors of more experienced pilots typically characterized by a reduced search rate and a more predictable pattern of visual fixations, quantified by lower gaze transition entropy. Indeed, entropy showed strong relationships with expertise in both training scenarios. Results from MDS analysis () further supported that more experienced pilots used similar overall strategies, which, as the correlation analysis showed, was made up of a lower entropy scan path and fewer antipersistent saccades, plus fewer fixations and a reduced search rate. Crucially, the MDS dimensions were related to both experience and performance. These results suggests that more experienced pilots performed a more efficient search of the cockpit, driven by their greater domain-specific knowledge, and were able to use their gaze in a more strategic fashion to locate areas of interest more easily.
Our second method of assessing construct validity provided no additional evidence to support the validity of the environment, as prior flight experience was not correlated with trainer ratings of performance. However, this may reflect a lack of sensitivity in the manual scoring system, rather than a lack of validity of the overall environment. Given that the environment was sensitive to eye movement differences in expertise it seems likely that the scoring system was just not sensitive to these differences. Indeed, the accompanying lack of a relationship between the performance scores and the separate eye movement variables () seems to indicate this. An additional limitation of this approach was the use of a single expert rater, so future work could use multiple raters to ensure consistency and triangulate scores. Consequently, it will be important to further develop this performance scoring system in future iterations of the simulation. The lack of real-world performance data in the study could be considered a limitation, and future work should look to also compare real-world performance assessments, not just measures of experience.
Conclusions
VR training is being rapidly adopted in many high performance environments (Bird, Citation2019; Gray, Citation2019; Hagita et al., Citation2020; Lele, Citation2013; Mathew et al., Citation2021), but methods of assessing and validating the effectiveness of these environments are lagging behind technology uptake. By adopting and implementing the recommendations of a recent framework for simulation testing (Harris et al., Citation2020) we aimed to 1) test an aircrew training simulation and 2) demonstrate some of the methods for conducting evidence-based testing of VR training. The results indicated that expert pilots generally thought the simulation was realistic and potentially useful for training. The construct validity and psychological fidelity of the simulation was also supported as differences in visual expertise were clearly detectable. Importantly, the performance assessment criteria were not sufficiently sensitive to real-world expertise, indicating that further work is required to develop this aspect of the simulation. Future work may look to adopt some of these approaches in testing other VR training applications.
Disclosure Statement
No potential conflict of interest was reported by the author(s).
Data Availability Statement
Availability of data, material and code – All relevant data and code is available online from: https://osf.io/c2tz9/
Additional information
Funding
Notes
1. Generation 3 commercial aircraft refers to those introduced since the early 1980s which took advantage of digital technologies to introduce glass cockpits with flight management systems and navigation displays. Generation 4 aircraft are those that entered service since 1988, such as the Airbus A320, and use fly-by-wire technology with flight envelope protection functions.
2. This occurred for five participants on either of the two fault scenarios.
3. Indeed, for the current case which used Euclidean distances between individuals, MDS is equivalent to Principal Components Analysis.
References
- Adanov, L., Efthymiou, M., & Macintyre, A. (2020). An exploratory study of pilot training and recruitment in Europe. International Journal of Aviation Science and Technology, 1(2), 44–51. https://doi.org/10.23890/IJAST.vm01is02.0201
- Allsop, J., & Gray, R. (2014). Flying under pressure: Effects of anxiety on attention and gaze behavior in aviation. Journal of Applied Research in Memory and Cognition, 3(2), 63–71. https://doi.org/10.1016/j.jarmac.2014.04.010
- Amor, T. A., Reis, S. D. S., Campos, D., Herrmann, H. J., & Andrade, J. S. (2016). Persistence in eye movement during visual search. Scientific Reports, 6(1), 20815. https://doi.org/10.1038/srep20815
- Baños, R. M., Botella, C., Alcañiz, M., Liaño, V., Guerrero, B., & Rey, B. (2004). Immersion and emotion: Their impact on the sense of presence. CyberPsychology & Behavior, 7(6), 734–741. https://doi.org/10.1089/cpb.2004.7.734
- Barnett, S. M., & Ceci, S. J. (2002). When and where do we apply what we learn?: A taxonomy for far transfer. Psychological Bulletin, 128(4), 612–637. https://doi.org/10.1037/0033-2909.128.4.612
- Bird, J. M. (2019). The use of virtual reality head-mounted displays within applied sport psychology. Journal of Sport Psychology in Action, 11(2), 115–118. https://doi.org/10.1080/21520704.2018.1563573
- Borg, I., & Groenen, P. J. F. (2005). Modern multidimensional scaling: Theory and applications. Springer Science & Business Media.
- Botella, C., García‐Palacios, A., Villa, H., Baños, R. M., Quero, S., Alcañiz, M., & Riva, G. (2007). Virtual reality exposure in the treatment of panic disorder and agoraphobia: A controlled study. Clinical Psychology & Psychotherapy, 14(3), 164–175. https://doi.org/10.1002/cpp.524
- Brams, S., Ziv, G., Levin, O., Spitz, J., Wagemans, J., Williams, A. M., & Helsen, W. F. (2019). The relationship between gaze behavior, expertise, and performance: A systematic review. Psychological Bulletin, 145(10), 980–1027. https://doi.org/10.1037/bul0000207
- Bright, E., Vine, S., Wilson, M. R., Masters, R. S. W., & McGrath, J. S. (2012). Face validity, construct validity and training benefits of a virtual reality turp simulator. International Journal of Surgery, 10(3), 163–166. https://doi.org/10.1016/j.ijsu.2012.02.012
- Caro, P. W. (1973). Aircraft simulators and pilot training. Human Factors, 15(6), 502–509. https://doi.org/10.1177/001872087301500602
- Causer, J., Holmes, P. S., & Williams, A. M. (2011). Quiet eye training in a visuomotor control task. Medicine and Science in Sports and Exercise, 43(6), 1042–1049. https://doi.org/10.1249/MSS.0b013e3182035de6
- Dahlstrom, N., Dekker, S., Winsen, R., & Nyce, J. (2009). Fidelity and validity of simulator training. Theoretical Issues in Ergonomics Science, 10(4), 305–314. https://doi.org/10.1080/14639220802368864
- Faul, F., Erdfelder, E., Lang, A.-G., & Buchner, A. (2007). G*Power 3: A flexible statistical power analysis program for the social, behavioral, and biomedical sciences. Behavior Research Methods, 39(2), 175–191. https://doi.org/10.3758/BF03193146
- Fooken, J., & Spering, M. (2019). Decoding go/no-go decisions from eye movements. Journal of Vision, 19(2), 5. https://doi.org/10.1167/19.2.5
- Fooken, J., & Spering, M. (2020). Eye movements as a readout of sensorimotor decision processes. Journal of Neurophysiology, 123(4), 1439–1447. https://doi.org/10.1152/jn.00622.2019
- Freeman, S., Eddy, S. L., McDonough, M., Smith, M. K., Okoroafor, N., Jordt, H., & Wenderoth, M. P. (2014). Active learning increases student performance in science, engineering, and mathematics. Proceedings of the National Academy of Sciences, 111(23), 8410–8415. https://doi.org/10.1073/pnas.1319030111
- Gegenfurtner, A., Lehtinen, E., & Säljö, R. (2011). Expertise differences in the comprehension of visualizations: A meta-analysis of eye-tracking research in professional domains. Educational Psychology Review, 23(4), 523–552. https://doi.org/10.1007/s10648-011-9174-7
- Gray, R. (2019). Virtual environments and their role in developing perceptual-cognitive skills in sports. In A. M. Williams & R. C. Jackson (Eds.), Anticipation and decision making in sport. Taylor & Francis, Routledge. https://doi.org/10.4324/9781315146270-19
- Hagita, K., Kodama, Y., & Takada, M. (2020). Simplified virtual reality training system for radiation shielding and measurement in nuclear engineering. Progress in Nuclear Energy, 118, 103127. https://doi.org/10.1016/j.pnucene.2019.103127
- Harris, D., Wilson, M., & Vine, S. (2019). Development and validation of a simulation workload measure: The simulation task load index (SIM-TLX). Virtual Reality, 24(4), 557–566. https://doi.org/10.1007/s10055-019-00422-9
- Harris, D. J., Bird, J. M., Smart, A. P., Wilson, M. R., & Vine, S. J. (2020). A framework for the testing and validation of simulated environments in experimentation and training. Frontiers in Psychology, 11, 605. https://doi.org/10.3389/fpsyg.2020.00605
- Harris, D. J., Buckingham, G., Wilson, M. R., Brookes, J., Mushtaq, F., Mon-Williams, M., & Vine, S. J. (2021). Exploring sensorimotor performance and user experience within a virtual reality golf putting simulator. Virtual Reality, 25(3), 647–654. https://doi.org/10.1007/s10055-020-00480-4
- Harris, D. J., Hardcastle, K. J., Wilson, M. R., & Vine, S. J. (2021). Assessing the learning and transfer of gaze behaviours in immersive virtual reality. Virtual Reality, 25(4), 961–973. https://doi.org/10.1007/s10055-021-00501-w
- Hart, S. G., & Staveland, L. E. (1988). In Advances in Psychology (Vol. 52, pp. 139–183). https://doi.org/10.1016/S0166-4115(08)62386-9
- Haslbeck, A., Schubert, E., Gontar, P., & Bengler, K. (2012). Advances in Human Aspects of Aviation, 561–568.
- Haslbeck, A., & Zhang, B. (2017). I spy with my little eye: Analysis of airline pilots’ gaze patterns in a manual instrument flight scenario. Applied Ergonomics, 63, 62–71. https://doi.org/10.1016/j.apergo.2017.03.015
- Janelle, C. M. (2002). Anxiety, arousal and visual attention: A mechanistic account of performance variability. Journal of Sports Sciences, 20(3), 237–251. https://doi.org/10.1080/026404102317284790
- Janelle, C. M., & Hatfield, B. D. (2008). Visual attention and brain processes that underlie expert performance: Implications for sport and military psychology. Military Psychology, 20(sup1), S39–S69. https://doi.org/10.1080/08995600701804798
- JASP Team. (2021). JASP (Version)[Computer software].
- Krassanakis, V., Filippakopoulou, V., & Nakos, B. (2014). EyeMMV toolbox: An eye movement post-analysis tool based on a two-step spatial dispersion threshold for fixation identification. Journal of Eye Movement Research, 7(1), 1. https://doi.org/10.16910/jemr.7.1.1
- Landman, A., Groen, E. L., van Paassen, M. M., (René), Bronkhorst, A. W., & Mulder, M. (2017). Dealing with unexpected events on the flight deck: A conceptual model of startle and surprise. Human Factors, 59(8), 1161–1172. https://doi.org/10.1177/0018720817723428
- Lele, A. (2013). Virtual reality and its military utility. Journal of Ambient Intelligence and Humanized Computing, 4(1), 17–26. https://doi.org/10.1007/s12652-011-0052-4
- Le Noury, P., Buszard, T., Reid, M., & Farrow, D. (2020). Examining the representativeness of a virtual reality environment for simulation of tennis performance. Journal of Sports Sciences, 39(4), 1–9. https://doi.org/10.1080/02640414.2020.1823618
- Lounis, C., Peysakhovich, V., & Causse, M. (2021). Visual scanning strategies in the cockpit are modulated by pilots’ expertise: A flight simulator study. PLOS ONE, 16(2), e0247061. https://doi.org/10.1371/journal.pone.0247061
- Mann, D. L., Nakamoto, H., Logt, N., Sikkink, L., & Brenner, E. (2019). Predictive eye movements when hitting a bouncing ball. Journal of Vision, 19(14), 28. https://doi.org/10.1167/19.14.28
- Mann, W. A., Ward, M., & Janelle, C. M. (2007). Perceptual-cognitive expertise in sport: A meta-analysis. Journal of Sport and Exercise Psychology, 29(4), 457–478. https://doi.org/10.1123/jsep.29.4.457
- Mathew, R. K., Collaboration, T. I. H., & Mushtaq, F. (2021). Three principles for the progress of immersive technologies in healthcare training and education. BMJ Simulation and Technology Enhanced Learning, 7(5), 459–460. https://doi.org/10.1136/bmjstel-2021-000881
- Perfect, P., Timson, E., White, M. D., Padfield, G. D., Erdos, R., & Gubbels, A. W. (2014). A rating scale for the subjective assessment of simulation fidelity. The Aeronautical Journal, 118(1206), 953–974. https://doi.org/10.1017/S0001924000009635
- Prince, M. (2004). Does active learning work? A review of the research. Journal of Engineering Education, 93(3), 223–231. https://doi.org/10.1002/j.2168-9830.2004.tb00809.x
- Salvucci, D. D., & Goldberg, J. H. (2000). Identifying fixations and saccades in eye-tracking protocols, Proceedings of the 2000 symposium on Eye tracking research & applications, 71–78. https://doi.org/10.1145/355017.355028
- Sankaranarayanan, G., Li, B., Manser, K., Jones, S. B., Jones, D. B., Schwaitzberg, S., Cao, C. G. L., & De, S. (2016). Face and construct validation of a next generation virtual reality (Gen2-VR©) surgical simulator. Surgical Endoscopy, 30(3), 979–985. https://doi.org/10.1007/s00464-015-4278-7
- Shannon, C. E. (1948). A mathematical theory of communication. Bell System Technical Journal, 27(3), 379–423. https://doi.org/10.1002/j.1538-7305.1948.tb01338.x
- Shannon, C. E., & Weaver, W. (1949). The mathematical theory of communication. UoI Press.
- Slater, M. (2009). Place illusion and plausibility can lead to realistic behaviour in immersive virtual environments. Philosophical Transactions of the Royal Society B: Biological Sciences, 364(1535), 3549–3557. https://doi.org/10.1098/rstb.2009.0138
- Slater, M., & Sanchez-Vives, M. V. (2016). Enhancing our lives with immersive virtual reality. Frontiers in Robotics and AI, 3, 74. https://doi.org/10.3389/frobt.2016.00074
- Slater, M., Usoh, M., & Steed, A. (1995). Taking steps: The influence of a walking technique on presence in virtual reality. ACM Transactions on Computer-Human Interaction, 2(3), 201–219. https://doi.org/10.1145/210079.210084
- Słowiński, P., Baldemir, H., Wood, G., Alizadehkhaiyat, O., Coyles, G., Vine, S., Williams, G., Tsaneva-Atanasova, K., & Wilson, M. (2019). Gaze training supports self-organization of movement coordination in children with developmental coordination disorder. Scientific Reports, 9(1), 1–11. https://doi.org/10.1038/s41598-018-38204-z
- Słowiński, P., Zhai, C., Alderisio, F., Salesse, R., Gueugnon, M., Marin, L., Bardy, B., Di Bernardo, M., & Tsaneva-Atanasova, K. (2016). Dynamic similarity promotes interpersonal coordination in joint action. Journal of the Royal Society Interface, 13(116), 20151093. https://doi.org/10.1098/rsif.2015.1093
- Sudiarno, A., & Wahyuni, A. D. (2020). Analysis of human factors and workloads in earthquake disaster evacuation simulations using virtual reality technology. IOP Conference Series: Materials Science and Engineering, 1003(1), 012082. https://doi.org/10.1088/1757-899X/1003/1/012082
- Sweller, J. (1988). Cognitive load during problem solving: Effects on learning. Cognitive Science, 12(2), 257–285. https://doi.org/10.1016/0364-0213(88)90023-7
- Tabachnick, B. G., & Fidell, L. S. (1996). Using multivariate statistics. Harper Collins.
- Usoh, M., Catena, E., Arman, S., & Slater, M. (2000). Using presence questionnaires in reality. Presence: Teleoperators and Virtual Environments, 9(5), 497–503. https://doi.org/10.1162/105474600566989
- Valenta, V. (2018). Effects of airline industry growth on pilot training. Magazine of Aviation Development, 6(4), 52–56. https://doi.org/10.14311/MAD.2018.04.06
- van Doorn, J., van den Bergh, D., Bohm, U., Dablander, F., Derks, K., Draws, T., Evans, N. J., Gronau, Q. F., Hinne, M., Kucharský, Š., Ly, A., Marsman, M., Matzke, D., Raj, A., Sarafoglou, A., Stefan, A., Voelkel, J. G., & Wagenmakers, E.-J. (2019). The JASP guidelines for conducting and reporting a bayesian analysis [Preprint]. Psychonomic Bulletin & Review, 28, 813–826. https://doi.org/10.31234/osf.io/yqxfr
- Vine, S. J., Uiga, L., Lavric, A., Moore, L. J., Tsaneva-Atanasova, K., & Wilson, M. R. (2015). Individual reactions to stress predict performance during a critical aviation incident. Anxiety, Stress, & Coping, 28(4), 467–477. https://doi.org/10.1080/10615806.2014.986722
- Vine, S. J., & Wilson, M. R. (2011). The influence of quiet eye training and pressure on attention and visuo-motor control. Acta Psychologica, 136(3), 340–346. https://doi.org/10.1016/j.actpsy.2010.12.008
- Williams, A. M., Davids, K., Burwitz, L., & Williams, J. G. (1994). Visual search strategies in experienced and inexperienced soccer players. Research Quarterly for Exercise and Sport, 65(2), 127–135. https://doi.org/10.1080/02701367.1994.10607607
- Wilson, M. R., Causer, J., & Vickers, J. N. (2015). The quiet eye as a characteristic of expertise. In Routledge handbook of sport expertise (pp. 22–37). Routledge.
- Wood, G., Wright, D. J., Harris, D., Pal, A., Franklin, Z. C., & Vine, S. J. (2021). Testing the construct validity of a soccer-specific virtual reality simulator using novice, academy, and professional soccer players. Virtual Reality, 24, 255–262. https://doi.org/10.1007/s10055-020-00441-x
- Yang, J. H., Kennedy, Q., Sullivan, J., & Fricker, R. D. (2013). Pilot performance: Assessing how scan patterns & navigational assessments vary by flight expertise. Aviation, Space, and Environmental Medicine, 84(2), 116–124. https://doi.org/10.3357/ASEM.3372.2013
- Ziv, G. (2016). Gaze behavior and visual attention: A review of eye tracking studies in aviation. The International Journal of Aviation Psychology, 26(3–4), 75–104. https://doi.org/10.1080/10508414.2017.1313096