
OCCUPATIONAL APPLICATIONS
In the context of Industry 5.0, our study advances manufacturing factory layout planning by integrating multi-objective optimization with nature-inspired algorithms and a digital human modeling tool. This approach aims to overcome the limitations of traditional planning methods, which often rely on engineers’ expertise and inputs from various functions in a company, leading to slow processes and risk of human errors. By focusing the multi-objective optimization on three primary targets, our methodology promotes objective and efficient layout planning, simultaneously considering worker well-being and system performance efficiency. Illustrated through a pedal car assembly station layout case, we demonstrate how layout planning can transition into a transparent, cross-disciplinary, and automated activity. This methodology provides multi-objective decision support, showcasing a significant step forward in manufacturing factory layout design practices.
TECHNICAL ABSTRACT
Rationale: Integrating multi-objective optimization in manufacturing layout planning addresses simultaneous considerations of productivity, worker well-being, and space efficiency, moving beyond traditional, expert-reliant methods that often overlook critical design aspects. Leveraging nature-inspired algorithms and a digital human modeling tool, this study advances a holistic, automated design process in line with Industry 5.0. Purpose: This research demonstrates an innovative approach to manufacturing layout optimization that simultaneously considers worker well-being and system performance. Utilizing the Non-dominated Sorting Genetic Algorithm II (NSGA-II) and Particle Swarm Optimization (PSO) alongside a Digital Human Modeling (DHM) tool, the study proposes layouts that equally prioritize ergonomic factors, productivity, and area utilization. Methods: Through a pedal car assembly station case, the study illustrates the transition of layout planning into a transparent, cross-disciplinary, and automated process. This method offers objective decision support, balancing diverse objectives concurrently. Results: The optimization results obtained from the NSGA-II and PSO algorithms represent feasible non-dominated solutions of layout proposals, with the NSGA-II algorithm finding a solution superior in all objectives compared to the expert engineer-designed start solution for the layout. This demonstrates the presented method’s capacity to refine layout planning practices significantly. Conclusions: The study validates the effectiveness of combining multi-objective optimization with digital human modeling in manufacturing layout planning, aligning with Industry 5.0’s emphasis on human-centric processes. It proves that operational efficiency and worker well-being can be simultaneously considered and presents future potential manufacturing design advancements. This approach underscores the necessity of multi-objective consideration for optimal layout achievement, marking a progressive step in meeting modern manufacturing’s complex demands.
1. Introduction
Virtual tools are commonly used for planning, designing, and simulating activities within the concept of the digital factory before physical implementation (Hovanec et al., Citation2023). The digital factory concept covers various planning tasks that enhance product and production design, including material flow, safety measures, area utilization, and factory layout planning (Kuhn, Citation2006). Given the diversity of these engineering tasks, multiple software tools are used (Zadeh et al., Citation2017). Digital human modeling (DHM) tools, such as Siemens Jack (Raschke & Cort, Citation2019), RAMSIS (Bubb et al., Citation2006), SAMMIE (Marshall et al., Citation2010), SANTOS (Yang et al., Citation2007), and IPS IMMA (Hanson et al., Citation2019) can be utilized to visualize, evaluate, and verify potential worker well-being in a predefined context. Although contemporary DHM tools primarily focus on simulating human well-being, it is important to recognize that human factors/ergonomics (HFE) encompasses both human well-being and system performance, as defined by Dul et al. (Citation2012). This broader scope underscores the discipline’s commitment to enhancing both individual and systemic outcomes.
Typically, a carefully designed virtual environment or scenario representing this context is created prior to utilizing DHM tools. This approach facilitates comprehensive testing and analysis of worker well-being and system performance in the virtual setup. The planning and verification are interconnected, as outputs from one activity often feed into others and vice versa (Süße & Putz, Citation2021). Despite these interdependencies, planning activities are often carried out in isolation, causing slow progress and iterative challenges (Lindskog et al., Citation2017). Industry 4.0 aims to automate and aid such interdependent work efforts through digitalization. This concept is further advanced by Industry 5.0, which places a strong emphasis on human-centric perspectives and addressing complex challenges (Nahavandi, Citation2019). In this context, these challenges encompass various aspects of planning and design processes, decision making, and problem solving that require human expertise. They involve situations in which the input of skilled staff is invaluable, particularly in adapting to unexpected changes and inputs during these challenging activities. By addressing these challenges, Industry 5.0 strives to strike a balance between automation and human involvement, recognizing those certain aspects of manufacturing and production benefit from human intuition, creativity, and adaptability. This approach ultimately contributes to the evolution of connected smart manufacturing (Cheng et al., Citation2020), where technology and human expertise work in harmony to achieve operational quality.
One specific challenge would be factory planning, particularly layout design. This activity entails positioning resources and equipment in a factory while considering spatial relationships that define the setup of the factory (Muther & Hales, Citation2015). Typically, layout design is subjectively handled by experts, relying on experience and personal awareness, often resulting in a limited number of investigated layout proposals (Burggräf et al., Citation2021). Layout design involves considering equipment space, production needs, capacity, logistics, and safety, then planning for future factory setups becomes a multi-objective task, often conducted virtually through proposals that require simulation and optimization (Hovanec et al., Citation2023). Yet, this process usually relies on specific experts and software users, resulting in a subjective, one-objective-at-a-time approach with risks often leading to suboptimal outcomes. This paper illustrates how multi-objective methods can resolve deficiencies of the current process of factory layout design.
1.1. Related Work and Considerations
Multi-objective methods have been explored in manufacturing layout planning (Lind et al., Citation2023), focusing on optimizing the factory layout setup. However, these approaches are scarce, and there are limited reports or demonstrations utilizing multi-objective methods to optimize the spatial positions of the equipment that present the layout design, considering area utilization, distance walked, and worker well-being. The common method in the literature for factory layout planning is systematic layout planning (SLP; Muther & Hales, Citation2015). SLP simplifies the layout activities, emphasizing 2D optimization of rectangular equipment placement, (e.g., Zuo et al., Citation2019; Wan et al., Citation2022), typically minimizing objectives such as area utilization and distances. As also noted by Besbes et al. (Citation2021), traditional 2D optimization methods often do not adequately capture the complex realities of real-world factory settings, where three-dimensional space usage and human factors are crucial.
Factory layout planning involves more than just intended processes and resources. Staff, equipment, maintenance, and material supply also require space reservations. Additionally, considerations often benefit from being extended into 3D planning, for example to address how shelf heights impact work conditions and worker well-being when planning, optimizing, and simulating manual lifting and picking of objects in the layout design.
1.2. Aim
In summary, factory layout and workstation planning need to address various cross-disciplinary aspects and stakeholder requirements. Our work aimed to demonstrate how two nature-based algorithms and a DHM tool can be used to perform simulation-based multi-objective optimization to identify better workplace for workers well-being and productivity, illustrated through a pedal car assembly workstation use case. This study seeks to bridge the gap between cross-disciplinary objectives, such as human well-being, productivity, and work area utilization, which are typically handled separately by different engineering roles. The approach presented here aims to provide decision makers with optimized factory layouts and workstation proposals that comply with rules and regulations. Ultimately, the presented approach assists and enhance the planning and design process of factory layouts.
2. Method
To demonstrate and apply multi-objective optimization in an assembly layout case, two nature-inspired algorithms were utilized: the Non-dominated Sorting Genetic Algorithm II (NSGA-II; Deb et al., Citation2002), and the Particle Swarm Optimization (PSO) algorithm (Kennedy & Eberhart, Citation1995). Both algorithms generate and identify dominated and non-dominated solutions, iteratively ranking them based on non-dominance and calculating crowding distances to position the solutions into Pareto fronts of explored solution space. The NSGA-II and PSO algorithms are well-suited for scenarios requiring the simultaneous optimization of multiple objectives, showcasing their effectiveness in multi-objective decision-making (Deb et al., Citation2002; Godinez et al., Citation2010).
The NSGA-II, a genetic algorithm, leverages biological evolution, where parents produce offspring through gene crossover and mutations to explore the solution space. Conversely, the PSO algorithm, inspired by animal swarm social behaviors, allows individuals to adjust trajectories and position based on peer influence and personal experience to explore the solution space (Shi & Eberhart, Citation1998). Both algorithms exemplify nature-inspired mechanisms for optimizing complex multi-criteria decision-making scenarios. In addition to the two nature-inspired algorithms, a random sampling algorithm was employed to propose random solutions.
The three algorithms (NSGA-II, PSO, and random) were integrated into Python scripts, with generated solution proposals sent to and simulated in the DHM tool, Industrial Path Solutions—Intelligently Moving Manikins (IPS IMMA; Hanson et al., Citation2019), to obtain corresponding objective values. IPS IMMA supports an Application Programming Interface (API) through Lua scripting, and Lua scripts were developed to enable data exchange via JavaScript Object Notation (JSON) files between the algorithms and the DHM tool. This integration enabled effective communication, allowing for the rearrangement of the layout setup, execution of simulations, and extraction of relevant information.
2.1. Layout case Description
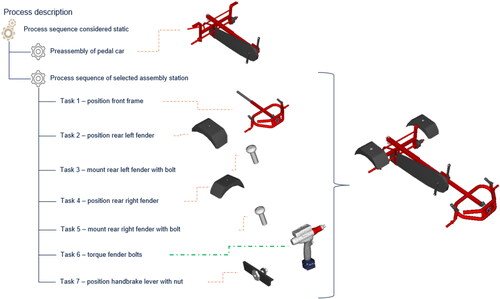
A pedal car assembly station was selected as test object, with a predetermined process sequence of seven tasks, including positioning the front frame, rear left fender, handbrake lever, mounting fenders, and tightening bolts (). This study assumes a fixed process sequence; specifically, the performed optimization does not involve altering the process sequence order.
Figure 1. Process description of the pedal car assembly station.
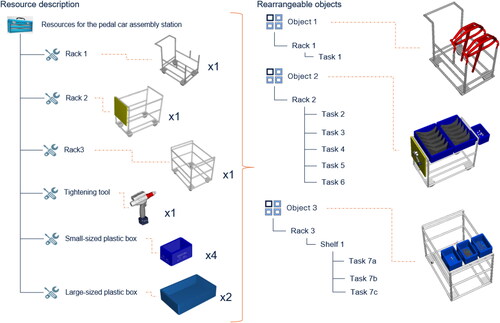
The assembly station’s resource inventory includes three racks, a tightening tool, four smaller-sized plastic boxes, and two larger-sized plastic boxes (). These resources form rearrangeable objects (Objects 1, 2, and 3). Our study focuses on optimizing the spatial arrangement of these objects, considering their positions and Object 3’s shelf height, to enhance layout performance.
Figure 2. Resource description of the selected pedal car assembly station.
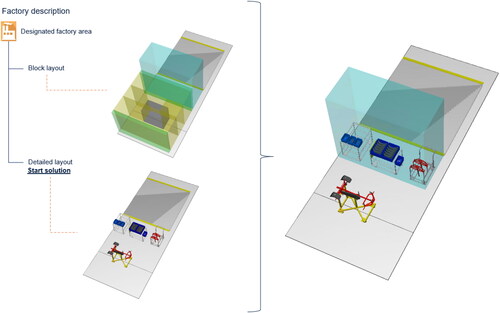
The assembly station’s block layout, illustrated in , incorporates a worker’s workspace, conforming to the Swedish Work Environment Authority AFS 2020:1§4 (Varg, Citation2020), with dimensions 1,000 × 800 x 2,100 mm (marked in yellow), and a designated area for the material façade (in blue). This material façade area outlines the available placement area for rearrangeable objects (Objects 1, 2, and 3). An initial expert engineer-designed start solution, aligned with this designated area, was created to compare against algorithm-generated layout proposals and also was used to check that proposed solution positions were within the designated area.
Figure 3. Assembly station description, with block layout and expert engineer-designed start solution.
In addition, factory layout design requires more than just accounting for the geometric representation of equipment; it also needs to incorporate space claims for safety and operational efficiency (Tsarouchi et al., Citation2017). For instance, safety regulations often require additional space around equipment for safe usage. In this context, workers’ workspaces were allocated in front of objects (Objects 1, 2, and 3) within the material façade, in compliance with AFS 2020:1§4 standards. Proposed solutions were also evaluated to ensure adherence to these safety regulations.
To account for workers well-being, a manikin representing the 50th percentile for stature of the male Swedish population (aged 18–65, with a stature of 1,792 mm and a body mass of 78 kg; per Hanson et al., Citation2019) was utilized in the IPS IMMA software to simulate the assembly process. This approach facilitated the integration of worker well-being considerations into the layout planning, underscoring the importance of human centric design.
2.2. Objective Definition
Optimization of factory layouts should involve several objectives, as demonstrated by Tsarouchi et al. (Citation2017). For multi-objective optimization of the assembly station, three main objectives where to be minimized and considered: 1) minimizing area utilization (AU); 2) reducing musculoskeletal load on workers (OWAS Lundqvist Index); and 3) decreasing worker travel distance (DW). The DHM tool IPS IMMA has the manikin posture metrics and sequence definition available, and through LUA scripting the OWAS Lundqvist Index can be calculated.
To assess musculoskeletal load and derive well-being scores, the OWAS method (Karhu et al., Citation1977) was integrated with the Lundqvist Index, forming the OWAS Lundqvist Index (OWASL-Index; see Lundqvist, Citation1988). The Lundqvist Index factor (L) was categorized using (Höldrich, Citation2011):
OWASL-Index > 200 – very very irksome
OWASL-Index = 181 to 200 – very irksome
OWASL-Index = 161 to 180 – irksome
OWASL-Index = 141 to 160 – rather irksome
OWASL-Index = 121 to 140 – little irksome
OWASL-Index = 100 to 120 – very little irksome
The OWASL-Index metric enhances the standard OWAS method by providing a metric of the aggregated musculoskeletal load over time, given by a value between 100 and 400. Simulation of the expert engineer-designed start solution presented OWASL-Index = 136, DW = 71.6 m, and AU = 2.46 m2 for the material façade, incorporating objects (Object 1, 2, and 3) and workers’ workspaces within the assembly station’s designated area for the material façade ().
2.3. The Optimization Problem
The algorithms were setup, for the assembly station optimization, with corresponding key components; for example: population size, tournament size, crossover, and mutation rate for the NSGA-II and inertia, cognitive, and social coefficients for the PSO. These parameters were set to enable the algorithms to effectively navigate the solution space, considering the multi-objective nature of the assembly layout problem. The optimization involved positioning three objects (Objects 1, 2, and 3) in the designated area, defined by seven key variables including object placements in the x-y plane and the shelf height for Object 3, as shown in . Automated collision checks ensured these objects’ placements complied with spatial constraints within the designated area.
Initiating the Optimization Algorithms
To initiate the optimization process, both the NSGA-II and PSO algorithms require an initial set of solutions. For the NSGA-II, these initial solutions are known as population zero [P(0)] and for the PSO these initial solutions are known as swarm zero [S(0)]. To maintain consistency, andto allow for a fair comparison between the algorithms and adhering to the guideline (population size = 10 times the number of genes) proposed by Deb et al. (Citation2002), it was decided to set the initial set of solutions to 70 individuals.
Through a Python script, object positions (genes/decision variables) for Objects 1, 2, and 3 were randomly generated, then sent to the DHM tool to rearrange the scene. Within the DHM tool, the setups were validated to adherence to designated area, height, and volume constraints on the object level. In instances of nonfulfillment, such proposed three object values were set to ‘inf’, due to the solution’s invalidity. For inputs that passed the checks, the virtual scene was simulated and computed the corresponding objective values. Then, these objective values were sent back to the algorithms to enable ranking and other operations based on the corresponding objective values retrieved from the DHM tool.
This process resulted in 70 valid configurations out of 106 attempts, forming the initial solution sets for both algorithms. All 106 solutions were documented in a total list of tested solutions. These steps guaranteed that both NSGA-II and PSO began optimization from an equivalent baseline, facilitating an equitable evaluation of their effectiveness.
Operators of the Algorithms
The NSGA-II algorithm employs tournament size, crossover, and mutation rate to generate initial offspring solutions [Q(0)] from the starting population [P(0)]. Tournament size was set = 2, with a crossover rate = 0.8 and a mutation rate = 0.01, to enhance genetic diversity. During selection, pairs of randomly chosen individuals compete, ensuring the generation of unique offspring by comparing them against a total list of tested solutions, initially comprising 106 random samples.
In contrast, the PSO algorithm optimizes particle positions based on personal best (pBest) and global best (gBest), utilizing cognitive and social components of 1.5, and an inertia weight = 0.5. The initial swarm [S(0)] first undergoes non-dominance sorting with ranking and crowding distance calculation to form Pareto fronts. Then. the algorithm proposes updated positions (updated-S(0)) verified against already tested solutions to ensure uniqueness.
Each individual proposed solutions from both the NSGA-II, Q(0) and PSO, updated-S(0) algorithms are sent one-by-one to be evaluated by the DHM tool and derive corresponding objective values. The next step is to generate iteration one for both algorithms. For the NSGA-II, the P(0) and Q(0) are combined and undergo non-dominance sorting with ranking and crowding distance calculation to form Pareto fronts based on the objectives, with the top 70 forming population one, or P(1). Similarly, but different, the PSO compares the lists of S(0) and updated-S(0), but individual for each particle, adjusting to the best individual solution of each particle based on objectives and crowding distance to produce swarm one, or S(1). Notably, the first 106 proposals are common to both NSGA-II and PSO, but all other tested solutions are appended to separate records.
The NSGA-II algorithm evolves the search space by producing offspring with tournament size, crossover, and mutation rate, combining P(N-1) and Q(N-1) for the next population. The PSO algorithm generates new particle positions based on pBest, gBest from the current swarm, cognitive and social components, and inertia weight. With each iteration, the already tested solution records grows by 70 new solutions, while maintaining separate lists for each algorithm. Each new proposal is checked against these separate records to ensure uniqueness, advancing the search for optimal solutions in each iteration of the algorithms separately. In summary, both algorithms utilized the same randomly created 106 solutions to form the initial set of 70 valid solutions, then separately tested an equal number of solutions. This setup facilitated a direct comparison of the results and performance achieved for this layout case. In addition, the same random sampling algorithm employed for generating the initial population zero and swarm zero, generated equal amounts of total solutions as the NSGA-II and PSO algorithms.
3. Result
The NSGA-II and PSO algorithms each ran for 10 iterations, with the initial 106 being shared and the subsequent 700 solutions generated separately by each algorithm. The random sampling algorithm produced 806 solutions in total, with the first 106 serving as the starting point for both the NSGA-II and PSO algorithms. The DHM tool rearranged the virtual scene based on each proposed solution by the algorithms, verifying constraints like object collision avoidance, adherence to safety requirements, and object positions within the designated area. Solutions not meeting these criteria were immediately assigned an ‘inf’ value for their objectives to save simulation efforts. Valid setups triggered simulations to collect the corresponding objective values.
3.1. The Resulting Tenth Iteration for the Algorithms
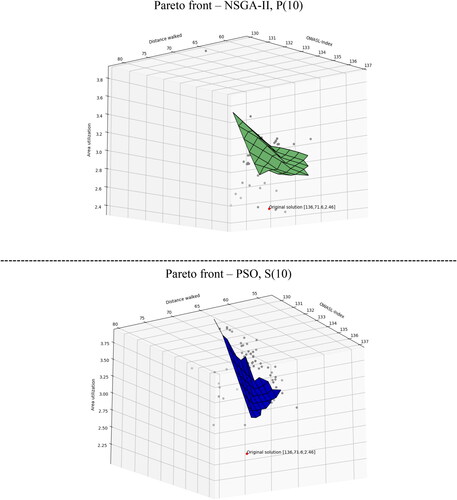
presents surface plots for the tenth iteration of both the NSGA-II and PSO algorithms. NSGA-II displays 15 non-dominated solutions [P(10)], while PSO shows 6 non-dominated solutions [S(10)]. All dominated solutions are indicated with grey dots, with the start solution highlighted in red acting as a reference point to what a layout expert engineer have thought of as solution for the assembly layout proposal.
Figure 4. Surface plot of iteration 10 for both algorithms, with three objectives.
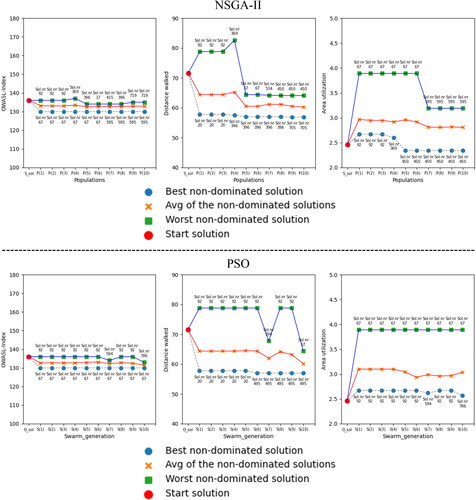
For each iteration, the NSGA-II and PSO algorithms presents updated Pareto fronts for the corresponding population or swarm. To assesses convergence for the NSGA-II and PSO algorithms the evolvement of the non-dominated solutions worst, average, and best values of the three objectives were analyzed and are presented in . Notably, for the NSGA-II algorithm, the best-performing objective values stabilizede after P(5), with the worst values showing a decreasing trend. In the PSO algorithm, the best-performing objective values remdain relatively stable, with a notable observation that the best solution for the OWASL-Index objective was derived from one of the random sampling solutions.
Figure 5. Evolution of the worst, average, and best objective values of the non-dominates solutions over the iterations for the NSGA-II and PSO algorithms.
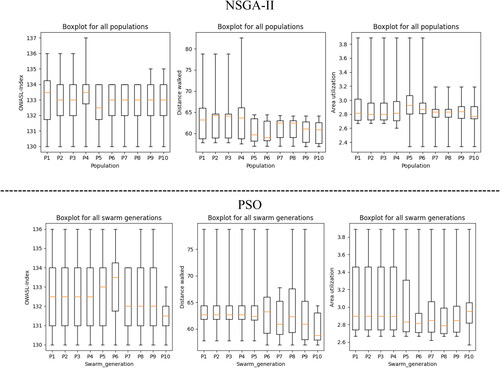
In a minimization optimization context, the objective is to achieve lower values for all three objectives. presents boxplots for the NSGA-II and PSO algorithms across iterations, providing insights into the central tendencies, dispersion, outliers, and the range of solution performance for each algorithm. The NSGA-II's boxplots, with decreasing median values and smaller boxes, suggest improving solution quality over iterations. Similarly, reductions in the PSO's boxplot ranges and medians indicate enhanced solution quality. These boxplots allow for a comparative analysis of both algorithms’ efficiency and solution improvement trends against the objectives.
Figure 6. Box plots of the non-dominated solutions for all iterations of the NSGA-II and PSO algorithms.
presents the non-dominated solutions from the tenth iteration of the NSGA-II [P(10)] and PSO [S(10)] algorithms, representing the Pareto front for each algorithm with details on solution numbers, objective values, and percent changes (*Pc) compared to the start solution. Each solution on these fronts is considered one of the best solutions found in the investigated solution space. Notably for this optimization run, one NSGA-II solution (solution 450) outperformed the layout expert engineer-designed start solution across all objectives, while PSO did not achieve this. In addition, all solutions listed in from both the NSGA-II and PSO algorithm present a lower OWASL-Index value than the start solution. Although it is important to highlight that the observed percent change (*Pc) in the OWASL-Index does not necessarily translate into a better workers’ work situation, still all found values range between 120-140 index indicating a “little irksome” work situation. Further examination and evaluation of each layout setup should present a clearer understanding of the workers’ work situation for each solution.
Table 1. Objective values for the non-dominated solutions of P(10) and S(10).
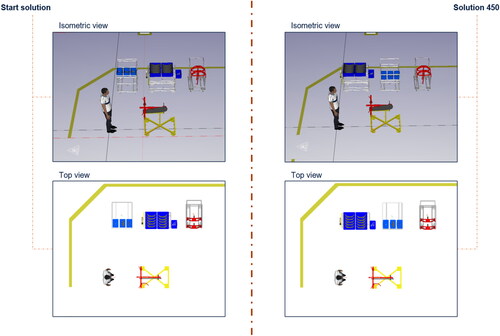
present possible optimal solutions from current generated solutions to proceed with further analyses and then enable informed decisions based on objective values. In , the start solution and solution 450 from the NSGA-II algorithm are visualized. Solution 450 is part of the Pareto front of P(10) for the NSGA-II algorithm. When comparing the start solution and solution 450, it is noted that solution 450 dominates the start solution across all three objectives. Solution 450 reduces the distance walked by 10% and decreases area utilization to 2.34 m2 (-5%). Additionally, solution 450 exhibits slight improvements in the OWASL-Index, with a percentual change of *Pc = −1.0%, suggesting a better situation for worker well-being in the proposed layout setup.
Figure 7. Visualization of the start solution and NSGA-II solution 450.
Both algorithms, NSGA-II and PSO, iteratively rank their generated solutions based on non-dominance while also calculating crowding distances. These measures are used to position solutions within Pareto fronts in the explored solution space. Upon combining the last population [P(10)] of NSGA-II and the final swarm positions [S(10)] of PSO into a unified list of 140 solutions, and then re-ranking and keeping the best 70 solutions, it was observed that the combined Pareto front consists of 13 solutions. Out of these, 11 solutions originated from the NSGA-II algorithm, and two were from the PSO algorithm. For further comparative analysis, the random sampling algorithm generated solutions together with the NSGA-II and PSO solutions were ranked with the non-dominated ranking. This revealed a final Pareto front comprising 13 solutions, distributed as follows: 11 from NSGA-II, two from PSO, with none from the random sampling algorithm.
4. Discussion
The planning and design of factory layouts involve multidisciplinary activities that significantly influence manufacturing capabilities. These layouts shape the work environment, resource arrangement, and process realization possibilities, while also determining safety, ergonomics, and the factory’s capacity potential. The interdependent nature of these tasks means that the output of one often informs another, and not addressing them concurrently can lead to inefficiencies and suboptimal results. Failing to concurrently address all issues can result in slow processes and suboptimal outcomes. This study showcases the utilization of two multi-objective optimization algorithms connected to a DHM tool to demonstrate how layout planning can embody transparency, objectivity and become a cross-disciplinary collaboration. This facilitates informed decision-making and display objective values behind each proposed layout solution.
The used DHM tool with developed scripts successfully showcases the possibility of employing a simulation-based multi-objective optimization approach for factory layout and workstation planning as an extension to evaluation, verification, and visualization that is normally carried out in digital human modeling tools. This method concurrently considers safety regulations, worker well-being through manikin simulation, and distances walked by the worker. Even though the NSGA-II and PSO algorithms successfully identified non-dominated solutions, it does not guarantee the accomplishment of the true Pareto front for either of the algorithms. This is because there could be additional solutions that have not been tested, and the complexity of the optimization problem adds a layer of uncertainty to achieve the true Pareto front. The algorithms both employ a sorting mechanism, sorting on dominance among tested individuals (parents and offspring) to rank and present non-dominated solutions as a Pareto front per each iteration of the algorithms.
From a research perspective, the demonstrator solution presented aligns with two key focus areas of Industry 4.0: simulation and automation (Nahavandi, Citation2019). The integration of simulation and multi-objective optimization for automating the generation and assessment of multiple layout solutions introduces novel capabilities in industrial development, potentially advancements beyond Industry 4.0 and Industry 5.0 (Nahavandi, Citation2019). The Industry 5.0 concept is still evolving, without a universally accepted definition. Yet, given current discussions, the approach presented here aligns with its direction: enhanced automation, digital integration, sustainability, and human-centric design. However, it is important to note that virtual models used in virtual environments are not equivalent to real-world implementations, which depend on executing and verifying installation drawings for planned layouts.
This work underscores the transformative potential of leveraging advanced DHM tools in the planning and design process of factory layouts. By utilizing the DHM tool capabilities, the digital solution presented enables transparent and cross-disciplinary planning, enhances decision making, and promotes the creation of factory layouts that prioritize both productivity and worker well-being. In the era of Industry 4.0 and 5.0, these kinds of solutions are clearly at the forefront of shaping the future of manufacturing systems.
4.1. Consideration of Results
The multi-objective optimization approach applied here in the pedal car assembly station case shows encouraging outcomes, handling multiple variables, constraints, and objectives. The approach automates solution generation and presents results through numeric values and corresponding visual layouts. This aids production, logistics, and ergonomics teams in joint and informed decision making, on solutions that balance conflicting objectives.
Prior research indicates that factory layout planning often relies on specific experts/staff, potentially leading to subjective and incomplete outcomes (Burggräf et al., Citation2021). These experts rely on their individual experiences and knowledge to plan and design factory layouts. However, this approach can sometimes overlook crucial information, such as obtaining space requirements for safety, adherence to rules, and compliance with regulations. The approach presented here highlights how digital tools can resolve deficiencies in current work processes. By embedding rules and recommendations into digital tools, the process can become more transparent and error resistant. Digital support not only guides but also prevents oversight, in contrast to manual methods that are prone to human error. A digital tool such as the one demonstrated here promotes stakeholder comprehension, supports ensuring that layouts adhere to industry standards and regulations, and facilitates making informed decisions. The scripts developed for this demonstrator are generic and can be applied to generate volume claim attributes for any geometry within a simulation scene. This adaptability makes them suitable for a broad spectrum of design tasks and various use cases. In general, the multi-objective optimization approach aligns with the trend of automating processes, facilitating digital work through intelligent decision-making solutions, and taking into account extensive datasets (Lindskog et al., Citation2017).
The primary intent of utilizing both NSGA-II and PSO algorithms in this study was to demonstrate that multi-objective optimization approaches can transition traditional, experience-based layout planning into a more objective and quantifiable process. By employing these algorithms, we explore how different optimization algorithms can effectively balance multiple, often conflicting, objectives in the context of layout design. From the results obtained, practitioners can conclude that both algorithms are feasible to use for multi-objective optimization scenarios in factory layout planning. The choice between the NSGA-II and PSO algorithms should be guided by additional factors, such as algorithm familiarity, available computational resources, and specific project requirements. The results from this optimization solution space show that the NSGA-II and PSO algorithms outperform the random sampling algorithm, and that the NSGA-II found a solution better than the expert engineer-designed start solution.
4.2. Consideration of Method
In this study, we explored the implementation and usage of the NSGA-II and PSO algorithms to run multi-objective optimization for a pedal car assembly station, integrated to a DHM tool (the IPS IMMA software). The approach to utilize the multi-objective algorithms in connection with a DHM tool to plan factory layouts was inspired by the method applied for optimizing battery assembly factory layouts described by Lind et al. (Citation2023), but extended to also use the PSO algorithm. Positions for the objects (Objects 1, 2, and 3) are proposed and set by the nature-inspired algorithms through Python and Lua scripts, and the virtual environment is setup accordingly within the DHM tool and then simulated to retrieve the results of corresponding objective values. While it is possible to develop a meta-model or formula for the layout problem’s area calculation and distance walked by a worker, the retrieval of the OWASL-Index ergonomic score necessitated full simulations of manikin motions within a DHM tool.
In this experiment, all three objectives were considered equally important. However, the algorithms employed in the optimization process allow for the weighting of objective values. Thus, decision-makers have the flexibility to adjust the weighting of objectives according to their relative importance before initiating the optimization process. Conducting the simulations on a single computer required a significant amount of computational power. On average, each feasible proposed solution by any algorithm took the same amount of time. The DHM tool used in the study varied in calculation time and the simulations took between 15–30 min per valid layout proposal. To enhance the industrial applicability of multi-objective algorithms, it may be beneficial to explore the development of cluster sessions and the distribution of simulation jobs across parallel computers, thereby reducing the processing time required for algorithm iterations. By running solutions in parallel, it could be anticipated that a new population or swarm for the used algorithms could be generated within 15–30 min per iteration for this specific use case.
For future research, additional alternative algorithms could be explored to assess their performance in comparison to the NSGA-II and PSO algorithms in multi-objective optimization cases. While the NSGA-II and PSO algorithms demonstrated effectiveness in this specific scenario, they may yield different results when applied in conjunction with different objectives, problem constraints, or other layout cases.
OWAS is, albeit old, an established method and still in use (e.g., Li, Citation2023) to assess musculoskeletal load to evaluate worker well-being. In this optimization case, the OWAS method was combined with the Lundqvist Index to create the OWAS Lundqvist Index. This index was utilized to assess worker well-being by evaluating the aggregated biomechanical load over time in a simulated sequence, representing a work cycle of approximately 3 min, taking into account postures of back, arms, legs, and the weight lifted during the simulated work sequence. The OWASL-Index is particularly advantageous, as it bridges the gap between simple posture evaluation and the detailed assessment of worker well-being risks in dynamic and complex sequences. Although it is noted that, in reality, workers may repeat this sequence throughout an entire day’s shift, we believe that the best score for the simulated sequence would still represent the optimal solution for the entire day.
For a more comprehensive optimization of factory layouts, incorporating additional objectives—such as material handling costs, energy consumption, and environmental impact—could enhance the analysis. It should be acknowledged that anthropometric diversity among workers is a crucial factor to consider. In this experiment, a single average manikin representing the Swedish male population was employed, which inadequately represents the anthropometric diversity in the workforce. A more effective strategy would be to employ a set of strategically defined manikins in simulations, as proposed by Brolin et al. (Citation2019). This aligns with the Industry 5.0 goals of developing manufacturing systems that are more human-centric in the future (Ivanov, Citation2023). Depending on the specific use case, forthcoming optimization scenarios could introduce diversity by representing entire populations or incorporating individuals from different nationalities.
4.3. Implications for Future Research
In addition to discussing the method and achieved results, it is crucial to consider how these findings can guide future research endeavors. Exploring alternative algorithms, such as reinforcement learning algorithms or simulated annealing, could offer insights into their efficiency compared to NSGA-II and PSO in multi-objective optimization scenarios. Furthermore, while this study sheds light on optimizing for worker well-being, production efficiency, and safety (e.g., workers’ workspace claims in front of rack systems), future research could delve into the implications of integrating a broader spectrum of objectives to further refine factory layout design optimization. However, it should be noted that including more objectives leads to a more complex optimization problem, requiring advanced techniques and computational resources to find optimal solutions. Still, such definitions and optimization runs are expected to present Pareto-fronts with all defined objectives.
5. Conclusions
The planning and design process of factory layouts is a complex challenge that involves collaboration among experts from various fields. The current approach heavily relies on the expertise of different professionals to make decisions that shape manufacturing capabilities. This underscores the necessity for tools and methods that assists the layout planning process, enabling well-informed decisions that take into account multiple objectives. The showcased demonstrator solution illustrates the application of multi-objective optimization for planning factory layouts. It evaluates worker well-being, tests layout configurations, and considers equipment setup within designated areas. By providing digital support in the early planning stages, this approach reduces safety risks, avoids costly retrofits, and expedites project completion. The demonstrator also promotes transparent and cross-disciplinary planning, enhancing decision making in factory layout design. This work reiterates an approach with a DHM tool to automate and enhance parts of the planning process for layout planning (e.g., Harari et al., Citation2017). Our study utilized the NSGA-II and PSO algorithms to demonstrate how the planning of a pedal car assembly station can become transparent and consider several aspects simultaneously, for example balancing productivity and worker well-being in the planning process. Both the NSGA-II and PSO algorithms facilitated a set of non-dominated and optimal solutions based on defined constraints and objectives. Nonetheless, a significant challenge for future research lies in supporting decision-makers to efficiently select the most suitable solution from these non-dominated alternatives as part of the decision-making process.
Author Contributions
Conceptualization: A.L.; Methodology, software, formal analysis was done by A.L. and V.E. Writing—original draft preparation, A.L.; Writing—review and editing, A.L., V.E., L.H., D.H., D.L., P.M. and A.S.; Supervision, L.H., D.H., D.L., P.M., and A.S.; Funding acquisition, D.H. and A.S. All authors have read and agreed to the published version of the manuscript.
Conflict of Interest
The authors do not report any conflicts of interest that may have inappropriately influenced this work.
Additional information
Funding
References
- Besbes, M., Zolghadri, M., Costa Affonso, R., Masmoudi, F., & Haddar, M. (2021). 3D facility layout problem. Journal of Intelligent Manufacturing, 32(4), 1065–1090. https://doi.org/10.1007/s10845-020-01603-z
- Brolin, E., Högberg, D., Hanson, L., & Örtengren, R. (2019). Development and evaluation of an anthropometric module for digital human modelling systems. International Journal of Human Factors Modelling and Simulation, 7(1), 47–70. https://doi.org/10.1504/IJHFMS.2019.102178
- Bubb, H., Engstler, F., Fritzsche, F., Mergl, C., Sabbah, O., Schaefer, P., & Zacher, I. (2006). The development of RAMSIS in past and future as an example for the cooperation between industry and university. International Journal of Human Factors Modelling and Simulation, 1(1), 140. https://doi.org/10.1504/IJHFMS.2006.011686
- Burggräf, P., Dannapfel, M., Hahn, V., & Preutenborbeck, M. (2021). Uncovering the human evaluation of changeability for automated factory layout planning: an expert survey. Production Engineering, 15(3-4), 285–298. https://doi.org/10.1007/s11740-020-01015-1
- Cheng, J., Zhang, H., Tao, F., & Juang, C.-F. (2020). DT-II:Digital twin enhanced industrial internet reference framework towards smart manufacturing. Robotics and Computer-Integrated Manufacturing, 62(April), 101881. https://doi.org/10.1016/j.rcim.2019.101881
- Deb, K., Pratap, A., Agarwal, S., & Meyarivan, T. (2002). A fast and elitist multiobjective genetic algorithm: NSGA-II. IEEE Transactions on Evolutionary Computation, 6(2), 182–197. https://doi.org/10.1109/4235.996017
- Dul, J., Bruder, R., Buckle, P., Carayon, P., Falzon, P., Marras, W. S., Wilson, J. R., & Van Der Doelen, B. (2012). A strategy for human factors/ergonomics: Developing the discipline and profession. Ergonomics, 55(12), 1612–1617. https://doi.org/10.1080/00140139.2012.661087
- Godinez, A. C., Espinosa, L. E. M., & Montes, E. M. (2010). An Experimental Comparison of Multiobjective Algorithms: NSGA-II and OMOPSO [Paper presentation]. 2010 IEEE Electronics, Robotics and Automotive Mechanics Conference, Cuernavaca, Mexico (pp. 28–33). IEEE. https://doi.org/10.1109/CERMA.2010.13
- Hanson, L., Högberg, D., Stig Carlson, J., Delfs, N., Brolin, E., Mårdberg, P., Spensieri, D., Björkenstam, S., Nyström, J., & Ore, F. (2019). Industrial path solutions – intelligently moving manikins. In DHM and Posturography (pp. 115–124). Elsevier. https://doi.org/10.1016/B978-0-12-816713-7.00011-8
- Harari, Y., Alon B., Ulrich R., & Robert R. (2017). ‘Automated Simulation-Based Workplace Design That Considers Ergonomics and Productivity’. International Journal of Simulation Modelling, 16(1), 5–18. https://doi.org/10.2507/IJSIMM16(1)1.355.
- Höldrich, A. (2011). Work load examinations at the log wood production. Journal of Agricultural Machinery Science, 7(2): 133–136.
- Hovanec, M., Korba, P., Vencel, M., & Al-Rabeei, S. (2023). Simulating a digital factory and improving production efficiency by using virtual reality technology. Applied Sciences, 13(8), 5118. https://doi.org/10.3390/app13085118
- Ivanov, D. (2023). The industry 5.0 framework: Viability-based integration of the resilience, sustainability, and human-centricity perspectives. International Journal of Production Research, 61(5), 1683–1695. https://doi.org/10.1080/00207543.2022.2118892
- Karhu, O., Kansi, P., & Kuorinka, I. (1977). Correcting working postures in industry: A practical method for analysis. Applied Ergonomics, 8(4), 199–201. https://doi.org/10.1016/0003-6870(77)90164-8
- Kennedy, J., & Eberhart, R. (1995). Particle swarm optimization [Paper presentation]. Proceedings of ICNN’95 - International Conference on Neural Networks, Perth, WA, Australia (Vol. 4, pp. 1942–1948). IEEE. https://doi.org/10.1109/ICNN.1995.488968
- Kuhn, W. (2006). Digital factory - simulation enhancing the product and production engineering process [Paper presentation]. Proceedings of the 2006 Winter Simulation Conference, Monterey, CA, USA (pp. 1899–1906). IEEE. https://doi.org/10.1109/WSC.2006.322972
- Li, X. (2023). A visual ergonomic assessment approach using kinect and OWAS in real workplace environments. Multiscale and Multidisciplinary Modeling, Experiments and Design, 6(1), 123–134. https://doi.org/10.1007/s41939-022-00133-w
- Lind, A., Elango, V., Hanson, L., Högberg, D., Lämkull, D., Mårtensson, P., & Syberfeldt, A. (2023). Virtual-simulation-based multi-objective optimization of an assembly station in a battery production factory. Systems, 11(8), 395. https://doi.org/10.3390/systems11080395
- Lindskog, E., Vallhagen, J., & Johansson, B. (2017). Production System redesign using realistic visualisation. International Journal of Production Research, 55(3), 858–869. https://doi.org/10.1080/00207543.2016.1218085
- Lundqvist, P. (1988). Working environment in farm buildings. Results of studies in livestock buildings and greenhouses. Thesis Report 58, Swedish University of Agricultural Sciences, Lund, Sweden.
- Marshall, R., Case, K., Porter, M., Summerskill, S., Gyi, D., Davis, P., & Sims, R. (2010). HADRIAN: A virtual approach to design for all. Journal of Engineering Design, 21(2-3), 253–273. https://doi.org/10.1080/09544820903317019
- Muther, R., & Hales, L. (2015). Systematic Layout Planning (Fourth Edition-Revised and Enlarged). Management & Industrial Research Publications.
- Nahavandi, S. (2019). Industry 5.0—A Human-Centric Solution. Sustainability, 11(16), 4371. https://doi.org/10.3390/su11164371
- Raschke, U., & Cort, C. (2019). Chapter 3 - Siemens Jack. In S. Scataglini and G. Paul (Eds.), DHM and Posturography (pp. 35–48). Academic Press. https://doi.org/10.1016/B978-0-12-816713-7.00003-9
- Shi, Y., & Eberhart, R. (1998). A modified particle swarm optimizer [Paper presentation]. 1998 IEEE International Conference on Evolutionary Computation Proceedings. IEEE World Congress on Computational Intelligence (Cat. No.98TH8360), Anchorage, AK, USA (pp. 69–73). IEEE. https://doi.org/10.1109/ICEC.1998.699146
- Süße, M., & Putz, M. (2021). Generative design in factory layout planning. Procedia CIRP, 99, 9–14. https://doi.org/10.1016/j.procir.2021.03.002
- Tsarouchi, P., Michalos, G., Makris, S., Athanasatos, T., Dimoulas, K., & Chryssolouris, G. (2017). On a human–robot workplace design and task allocation system. International Journal of Computer Integrated Manufacturing, 30(12), 1272–1279. https://doi.org/10.1080/0951192X.2017.1307524
- Varg, A. (2020). AFS 2020:1 Arbetsplatsens utformning. AFS 2020:1. www.av.se.
- Wan, X., Zuo, X., Li, X., & Zhao, X. (2022). A hybrid multiobjective GRASP for a multi-row facility layout problem with extra clearances. International Journal of Production Research, 60(3), 957–976. https://doi.org/10.1080/00207543.2020.1847342
- Yang, J., Kim, J. H., Abdel-Malek, K., Marler, T., Beck, S., & Kopp, G. R. (2007). A new digital human environment and assessment of vehicle interior design. Computer-Aided Design, 39(7), 548–558. https://doi.org/10.1016/j.cad.2006.11.007
- Zadeh, N. S., Lindberg, L., El-Khoury, J., & Sivard, G. (2017). Service oriented integration of distributed heterogeneous IT systems in production engineering using information standards and linked data. Modelling and Simulation in Engineering, 2017, 1–23. https://doi.org/10.1155/2017/9814179
- Zuo, X., Li, B., Huang, X., Zhou, M., Cheng, C., Zhao, X., & Liu, Z. (2019). Optimizing hospital emergency department layout via multiobjective tabu search. IEEE Transactions on Automation Science and Engineering, 16(3), 1137–1147. https://doi.org/10.1109/TASE.2018.2873098