
 ?Mathematical formulae have been encoded as MathML and are displayed in this HTML version using MathJax in order to improve their display. Uncheck the box to turn MathJax off. This feature requires Javascript. Click on a formula to zoom.
Abstract
Sexually oriented establishments across the United States often pose as massage businesses and force victim workers into a hybrid of sex and labor trafficking, simultaneously harming the legitimate massage industry. Stakeholders with varied goals and approaches to dismantling the illicit massage industry all report the need for multi-source data to clearly and transparently identify the worst offenders and highlight patterns in behaviors. We utilize findings from primary stakeholder interviews with law enforcement, regulatory bodies, legitimate massage practitioners, and subject-matter experts from nonprofit organizations to identify data sources and potential indicators of illicit massage businesses (IMBs). We focus our analysis on data from open sources in Texas and Florida including customer reviews and business data from Yelp.com, the U.S. Census, and GIS files such as truck stop, highway, and military base locations. We build two interpretable prediction models, risk scores and optimal decision trees, to determine the risk that a given massage establishment is an IMB. The proposed multi-source data-based approach and interpretable models can be used by stakeholders at all levels to save time and resources, serve victim-workers, and support well informed regulatory efforts.
1. Introduction
The United Nations Office on Drugs and Crime reported a more than five-fold increase in internet-facilitated human trafficking cases between 2004 and 2018 (UNODC, Citation2021). Trafficking networks rely on social media, classified sites, and standalone web pages to target vulnerable populations while maintaining anonymity (Borrelli and Caltagirone, Citation2020). The hidden nature of trafficking and modern slavery makes accurate scale and revenue estimations difficult; however, trafficking comprises one of the most profitable and fastest growing crimes in the world, trapping an estimated over 40,000,000 people (ILO, Citation2017).
We focus our analysis on the illicit massage industry. Currently, an estimated 11,000 illicit massage businesses (IMBs) are operating in the United States (Heyrick Research, Citation2021). Traffickers operate illicitly behind a facade of providing legitimate massage services while subjecting victim workers to labor and sexual exploitation. There are varying estimates of the number of trafficking victims in the illicit massage industry, but evidence shows that it is not negligible. For example, Chin, Takahashi, Baik, et al. (Citation2019) interviewed 116 massage business employees who had provided sexual services, and found that 17% of them had been forced or coerced to do so. Obtaining evidence of “force, fraud, or coercion” that is necessary for prosecuting traffickers is extremely difficult (de Vries and Radford, Citation2022). Therefore, traffickers in the illicit massage industry often leave evidence on the internet without fear of being caught.
Our goal in this study is to piece together clues about IMBs from various open internet sources and create interpretable machine learning models to help investigators prioritize massage businesses that are most likely to be exploiting victims of human trafficking. A model is interpretable if it can be easily understood by humans (Rudin et al., Citation2022). Interpretable models such as risk scores and decision trees are commonly used in healthcare and criminal justice, but many applications have suboptimal performance (Rudin et al., Citation2022). We utilize two recently developed methods for creating optimized risk scores (Ustun and Rudin, Citation2019) and decision trees (Lin et al., Citation2020). Once trained, both models rely on simple math or logic using a small number of features from the data to predict the risk that a given business is an IMB. These models are interpretable because it is easy for the user to see how each data feature contributes to the predictions. The interpretability is important for stakeholders such as law enforcement to have confidence in the predictions (Deeb-Swihart et al., Citation2019; Raaijmakers, Citation2019). Furthermore, the small size and simplicity of the two models facilitate their implementation in practice.
From stakeholder interviews conducted through NC State University, IRB # 23962, we learned that the workflow of human trafficking investigators and prosecutors often involves reviewing data from various sources and prioritizing cases based on both objectively and subjectively identified features. Stakeholders report that there is a need for a more streamlined process for identifying and prioritizing potential IMB investigations. In the literature, studies analyze the geographic and socio-demographic features of IMB locations at the census tract level (Crotty and Bouché, Citation2018; de Vries, Citation2022) or develop classification models for online customer reviews of massage businesses based on textual analysis (Li et al., Citation2021; de Vries and Radford, Citation2022). This work differs from these studies in that we develop risk prediction models for IMBs at the business level using geographic and socio-demographic data sources in combination with customer review data. We consider features such as the gender of the author and business rating in addition to the review text. Furthermore, our emphasis on interpretability sets us apart from other predictive modeling efforts in the human trafficking literature. The proposed approach is realistic and practical because law enforcement and other counter-trafficking stakeholders also use multiple data sources in their investigations. Our models could enable stakeholders to better triage, pivot through, and identify IMBs, therefore reducing time spent prioritizing investigations and allowing more time to investigate the most egregious offenders.
The remaining sections are organized as follows. Section 2 provides a literature review of related studies on the illicit massage industry. Section 3 describes our data sources. Section 4 explains how we extract features from the data and create a machinable data set. Section 5 describes the methodology used for building risk scores and optimal decision trees. Section 6 presents computational results for both models, compares the performance to baseline models, and provides a discussion. Lastly, Section 7 concludes the work and gives future directions.
2. Literature review
We first review previous efforts to combat sex trafficking using data analysis and machine learning methods. We then discuss related studies that focus on trafficking in IMBs.
2.1. Prediction models for sex trafficking
The majority of the machine learning literature about combating sex trafficking has utilized text analysis methods to detect indicators of trafficking in online advertisements for commercial sex. For example, several studies considered lists of sex trafficking terms provided by law enforcement and non-profit organizations to extract informative text features (Dubrawski et al., Citation2015; Alvari et al., Citation2017; Tong et al., Citation2017; Wang et al., Citation2020; Hernández-Álvarez and Granizo, Citation2021). Some studies applied automatic processes such as bag-of-words (Dubrawski et al., Citation2015) and Term Frequency-Inverse Document Frequency (TF-IDF) (Alvari et al., Citation2017; Zhu et al., Citation2019) to generate text features. More advanced natural language processing models such as the continuous bag-of-words model (Ramchandani et al., Citation2021), the skip-gram model (Tong et al., Citation2017; Wang et al., Citation2020), and the BERT model (Esfahani et al., Citation2019) were also explored. Tong et al. (Citation2017) and Hernández-Álvarez and Granizo (Citation2021) combined image data with text analysis to improve detection of trafficking in online escort advertisements. In addition to detecting isolated instances of trafficking, researchers studied trafficking networks and their characteristics. Zhu et al. (Citation2019) used phone numbers to create networks of advertisements from the same organization and then predicted the risk for each organization. Keskin et al. (Citation2021) grouped advertisements by text, phone number, and image hashing, and then evaluated models to predict the movement of victims.
All papers mentioned above considered advertisements from websites for commercial sex acts. Customer review texts for commercial sex providers have also been shown to contain important information (e.g., phone numbers) for tracking the movements of trafficking victims (Ibanez and Suthers, Citation2014). These review texts that indicate trafficking provide context concurrent to or after the exploitation occurs. Detecting and disrupting trafficking networks from multiple stages of the human trafficking kill chain, as defined by Caltagirone (Citation2017), can enable a more comprehensive fight against human trafficking. Helderop et al. (Citation2019) considered customer review text from the hotel review site, Travelocity.com, along with price and location-based features, to identify hotels with high prostitution arrests, which were suggested to be tied to sex trafficking.
Recent studies examined trafficking activities associated with geographic and socio-demographic attributes as well. Mletzko et al. (Citation2018) applied spatial analysis to understand where sex trafficking arrests occurred in Austin, Texas, and studied the effect of situational and socio-demographic neighborhood features. They found positive correlation between sex trafficking offenses and the following features: proximity to the highway, count of motels, count of sexually oriented businesses, and a concentrated disadvantage metric derived from five census variables.
2.2. Spatial analysis of IMBs
Studies in the literature that focused on trafficking in the illicit massage industry mostly analyzed data from IMB review boards such as Rubmaps.ch. Bouché and Crotty (Citation2018) studied where IMBs locate and estimated the demand for illicit massage in Houston, Texas. They observed a sample of businesses with reviews on Rubmaps using camera footage to monitor people entering and exiting the businesses. They estimated the total annual demand for illicit massage at each business. They further predicted the total annual demand for all IMBs in Houston using a least squares regression model fit to the observed data and considering Rubmaps and census features. In a follow-up study, Crotty and Bouché (Citation2018) identified clustering of IMB locations in Houston census tracts and determined which demographic characteristics were correlated with the clustering using a geographically weighted regression method. They found that census features related to race, education, employment industries, and household types were significant predictors of clustering.
Chin, Takahashi, and Wiebe (Citation2019) conducted a similar IMB location analysis in Los Angeles County and New York City. The authors identified IMB clustering in both areas and found that features related to race and household size were significant. White et al. (Citation2021) expanded similar geographic analysis across the United States by creating prediction models at the census tract and county levels to predict IMB prevalence from a variety of geographic and socio-demographic features. They found that significant features were related to race, rent, and income levels as well as an area’s distance to international airports, religious presence, and state. de Vries (Citation2022) studied IMB locations from a criminology perspective. They found that areas with high social disorganization and indicators of crime opportunity, i.e., high population density, proximity to highways, and high retail land use, were more receptive to IMBs. These works all provided insight on the types of neighborhoods where IMBs tend to locate. However, they did not predict whether a particular massage business is an IMB. We use these findings in the literature to suggest geographic and socio-demographic features to include in our models.
2.3. Text Analysis of IMBs
Studies in the literature have applied text analysis methods to online customer reviews to detect trafficking. de Vries and Radford (Citation2022) conducted interviews with human trafficking experts to identify human trafficking indicators in IMBs, such as the rotation of victim-workers among IMBs. They identified seed words from the interviews and implemented the skip-gram model to detect terms used in a similar context in Rubmaps reviews. The authors used this approach to create a list of IMB “risk markers”.
A partnership between Accenture and the counter-human-trafficking non-profit organization, Global Emancipation Network, developed Artemis, a tool that aggregated large amounts of business review data, and used machine learning models to classify Yelp and Rubmaps reviews and predict businesses likely engaged in trafficking (Vyas and Caltagirone, Citation2019). This tool was created for law enforcement and private companies and is not publicly available. Diaz and Panangadan (Citation2020) trained a random forest classifier to predict Yelp reviews for IMBs using text features created with a bag-of-words method and TF-IDF weighting. Li et al. (Citation2021) used an ensemble approach to combine two methods for predicting Yelp reviews for IMBs. One of those methods developed and utilized a lexicon derived from Yelp review language to create review text features, and the other one used word embeddings. We apply the lexicon scoring method of Li et al. (Citation2021) to create Yelp review features. These previous works considered customer review text for making review-level predictions. In addition to Yelp review text, we consider other review-level features, such as review rating and author gender, and business-level features, such as business name and available services, to predict the likelihood that a massage business is illicit.
To the best of our knowledge, no previous efforts exist to combine text analysis of customer reviews for massage business with geographic and socio-demographic data or business information from websites such as Yelp.com to build models that predict the likelihood that a massage business is an IMB. Using an approach that considers several data sources is important, as it most closely resembles the multifaceted investigative process described by counter-trafficking stakeholders interviewed in our study. The model proposed by Helderop et al. (Citation2019) for predicting prostitution in hotels most closely resembles our multi-source approach. In addition to being applied to a different problem, we also emphasize interpretability of our models. We will discuss literature related to our methodology in Section 5. Although we use existing modeling techniques, they are applied to a new problem. There is no previous effort to create interpretable risk prediction models for IMBs.
3. Data sources
We focus our modeling and analysis on data that is easy to obtain for large jurisdictions across the United States. We consider two types of data: business data that is tied to each massage business, e.g., Yelp review text, and geographic or socio-demographic data that is tied to the physical location of each business, e.g., census data. lists the data sources and fields that we use to compile a list of potential model features. We create business labels (i.e., illicit vs non-illicit) by combining business licensing records and information from the IMB review board, Rubmaps (see Section 4.2). lists data sources that we use for labeling businesses. We train our models using data from Florida and Texas, due to the accessibility of licensing records from these two states. The trained models can be applied to make predictions in other states since all model features are readily available. In the following subsections, we describe each data source further. We provide the date range for each data source in and . Since Yelp, Rubmaps, and the business licensing records provide the most time-sensitive information about businesses at a given point in time, we ensure that they have overlapping date ranges.
Table 1. Data sources used for creating a set of potential model features.
Table 2. Data sources used for labeling businesses in Florida and Texas.
3.1. Yelp customer reviews and business information
Yelp hosts customer reviews for businesses in many industries. We obtained Yelp data (see ) for all massage-related businesses in Texas and Florida listing at least one form of massage or spa treatment as one of the business categories. We created two new features for each Yelp review. First, using the Yelp lexicon developed by Li et al. (Citation2021), we assigned a score to each review. This lexicon includes 169 words and phrases each assigned a weight of 1 or 2 based on how closely the phrase is tied to illicit massage and sex trafficking. A score is created for a review by summing the four highest weights of the lexicon terms present. This lexicon can be requested from the authors of Li et al. (Citation2021). Second, we used the Python package, “gender-guesser 0.4.0” to guess the gender of the author of the review based on the user’s first name. It is known that IMBs primarily attract male customers (Crotty and Bouché, Citation2018).
3.2. Geographic and socio-demographic data
Through 24 stakeholders interviews conducted between September 1st, 2021 and December 13th, 2021, and based on the literature, we identified geographic and socio-demographic features that might influence where IMBs locate. We collected geographic data for the following location types. Truck Stops: It is known that truck stops are key components of the nationwide human trafficking networks (Polaris Project, Citation2012). The truck stop data is available from the U.S. Department of Transportation (Citation2021). Highways: Crime opportunity theory (de Vries, Citation2022) and stakeholder interviews suggest that IMBs may locate near highways for ease of moving victims and convenience of buyers. The highway data is available from Esri (Citation2021). Military Bases: Stakeholder interviews also suggest that IMBs benefit from demand near military bases, often advertising military discounts. The military base data is available from the Office of the Assistant Secretary of Defense for Sustainment (Citation2019). Police Stations: The presence of law enforcement in a neighborhood may deter IMBs from locating there (de Vries, Citation2022). The police station data is available from the U.S. Department of Homeland Security (Citation2021a). Schools: There has been increased attention and concern regarding IMBs located near schools (Children at Risk, Citation2018; RESET180, Citation2020). It is unclear whether the presence of schools affects IMB location strategies, but better understanding the relationship can inform future policies and interventions. The school data is available from the U.S. Department of Homeland Security (Citation2021b).
For each massage business, we calculated the distance to the closest location feature of each type. We used the Google Maps Application Programming Interface (API) to obtain the latitude and longitude of each business and then used the “GeoPandas 0.10.2” package in Python to calculate the shortest Euclidean distance (on a projected coordinate system) to each feature type.
Previous works have identified IMB neighborhood demographic indicators that can be operationalized through census data (Crotty and Bouché, Citation2018). We collected zip code level socio-demographic data from the 2018 American Community Survey (ACS) 5-Year detailed data tables provided by the U.S. Census Bureau (Citation2021). We included features relating to race, nationality, income, education, and housing which were identified as significant indicators by Crotty and Bouché (Citation2018). We also collected Rural-Urban Commuting Area (RUCA) codes from U.S. Department of Agriculture (Citation2020) for each zip code. contains the full list of features from these sources. We used the most recently available RUCA codes and GIS location files. We chose the 2018 ACS survey data to align best with the date ranges of the majority of business records. These sources represent less transient characteristics of a business’s location and are therefore less time sensitive than the business data sources.
3.3. Massage license records
We submitted public records requests to 10 states to obtain records related to massage business and therapist licensing. Each state has different licensing requirements and policies for redacting and releasing these records to the public. Two states, Texas and Florida, were able to provide very thorough records on a large number of massage businesses and therapists. Texas and Florida require all massage therapists and massage establishments to maintain a valid massage license through the Texas Department of Licensing and Regulation (Citation2022) and the Florida Board of Massage Therapy (Citation2022), respectively. The licensing records from these states include the data fields listed in . The license status of a business or therapist, such as “Revoked,” or “Suspended,” indicates to some extent the severity of a license holder’s misconduct. We also requested details about administrative orders which are issued to licensed and unlicensed businesses and therapists and result in license status changes, fines, or other penalties. These details include descriptions of the misconduct and resulting action taken. Obtaining these details requires significant human effort, either reading through pdfs or looking up license numbers in a database. We utilize this data for labeling businesses only. Therefore, the proposed approach requires a significant effort to create labeled training data. However, once trained, our models can efficiently scale to make predictions on easily obtainable data.
3.4. Rubmaps
Rubmaps.ch is a paid, member-only IMB-specific review board where sex buyers can locate IMBs and review their experience with details of the commercial sex acts provided. The data fields collected from Rubmaps are listed in . Previous work by Global Emancipation Network identified a list of keywords for evaluating the content of advertisements and reviews for commercial sex acts. This keyword list assigns weights to two sets of terms, one relating to commercial sex and one to human trafficking. We used this list to score each of the Rubmaps reviews to confirm that a Rubmaps business actually has illicit reviews. Like the licensing data, we only use the Rubmaps data to label our training data set. This process will be discussed in Section 4.2.
4. Data preparation
We describe how we identify the set of massage businesses for analysis, create business level features, and label businesses for classification.
4.1. Identifying massage businesses
Placekey is a free universal standard identifier for any physical place (Placekey, Citation2021). We use the Placekey API to create location identifiers for the address data from each of our sources because of its ability to distinguish separate businesses in close proximity. The Placekey API utilizes a location’s address and name to encode a Placekey ID with up to three components. One component identifies a roughly 15,000 m2 hexagon that contains the location and another component encodes the address of the location within the hexagon. A third component is included if Placekey can identify a specific point of interest, e.g., business, in the Placekey reference data set using the provided location name. However, we use only the location and address components of the Placekey ID and not the name component for two reasons. First, through our interviews and observations in the data, we find that many IMBs operate under multiple names. For example, they may have one formal name in licensing records, but advertise under a different name on Rubmaps. The second reason is that the therapist licensing data often provide an address, but not a business name.
We define a 3-year study period between September 15th, 2018 and September 14th, 2021. This is the most recent 3-year period for which we have both Yelp and Rubmaps data (see and ). Furthermore, we have business licensing records from Texas and Florida for most of this time window. We identify 9616 unique massage business locations with reviews on Yelp and 1565 unique business locations with reviews on Rubmaps in the study period. We assume that data from the same location correspond to the same business entity. Therefore, when there are multiple Yelp pages with the same Placekey ID, we assume that they are alternative pages for a business and aggregate the data from each page. Specifically, we combine all reviews from each Yelp page and use the business level data from the page with the most recent review. We do the same for Rubmaps as well.
4.2. Creating a labeled data set
For Yelp and Rubmaps reviews written within the 3-year study period, we create numeric features that summarize information for each business. We also create binary and categorical features from other Yelp business information when possible. For example, we identify whether the Yelp business phone number also appears in classified advertisements for commercial sex. We utilize a list of phone numbers collected from classified sites such as SkipTheGames and CityXGuide provided by Global Emancipation Network. Phone numbers have often been used in sex trafficking network analysis to link advertisements and entities (Dubrawski et al., Citation2015; Keskin et al., Citation2021). We suspect that the same phone numbers may be used in IMBs. Another example is that we create an indicator feature for whether the Yelp business name includes words that fit a theme associated with IMBs. We identify the themes “Asian,” “happy/lucky,” “touch/hands,” and “foot massage” from analysis of common words in Rubmaps business names. A list of these features is included in Table A1 in the Online Supplement.
We consider two broad criteria for labeling massage businesses as IMBs. The first criterion is derived from the licensing data discussed in Section 3.3. The second is derived from the Rubmaps data discussed in Section 3.4. We label any business with an administrative order or a license violation as an IMB. For license violations, we only consider those that resulted in the license being “Revoked,” “Suspended,” “Voluntarily Surrendered,” or “Emergency Restricted” since these are the most common penalties for serious offenses. The licensing data can sometimes provide evidence for crimes related to sexual or labor exploitation. However, we understand from our interviews that it is incredibly difficult to prosecute massage businesses for human trafficking, prostitution, and other serious crimes due to the burden of proof and hidden nature of these crimes, a sentiment also identified by de Vries and Radford (Citation2022). Interviewees report that illicit business owners commonly walk away from license violation notices of any kind rather than combat them before board hearings, as it remains easy to reopen another illicit massage business in many jurisdictions. That is, more serious crimes are often the root cause of simple violation notices. For this reason, we consider the penalties for license violations and all administrative orders, but not the description of the violation.
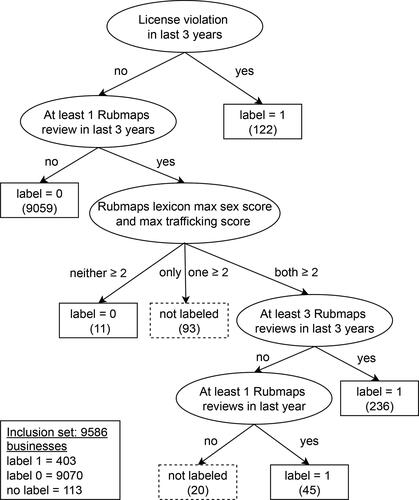
Since sex crimes and labor violations that relate to human trafficking in IMBs go under-reported and under-prosecuted, we also use the Rubmaps data to label IMBs that may not appear in licensing penalties. However, Rubmaps data is user-generated and cannot be assumed to tell the truth for every business. Therefore, we make assumptions about the Rubmaps data when labeling the businesses that are most suspected to be IMBs given the count and content of recent Rubmaps reviews. We do not claim that a business labeled with either criterion is known to be an IMB. However, both types of criteria contain indicators of a business that should be further investigated for potential illicit activity and crimes related to human trafficking. We define the labels as 1: a business with potential illicit activity and crimes related to human trafficking, and 0: a business with no evidence of such activity. The label for each business is determined based on the decision rules illustrated in . The figure also displays the total label quantities. We refer to this set of 9473 labeled businesses as the “full data set” in later sections. The labeling is conservative, especially for those labeled using the Rubmaps reviews. Although this results in an imbalanced data set with only 4.25% positive labels, it leads to high confidence in the resulting predictions.
Figure 1. Flowchart for labeling massage businesses in the inclusion set. We only consider Rubmaps reviews and license violations that occur in the study period between September 15th, 2018 and September 14th, 2021. The “last 3 years” and “last year” are calculated from September 14th, 2021.
5. Methodology
In this section, we first present the feature selection and data sampling procedures. We then discuss the baseline prediction models. Lastly, we present the risk score and optimal decision tree models. A risk score assigns integer point values to a small number of features in the data (Singh et al., Citation2002; Kahn et al., Citation2009). A positive point value means increased risk, a negative value means reduced risk, and a higher absolute value means more impact on the risk score. To assess the risk of a given observation for the event of interest (e.g., whether a massage business is an IMB), the user only needs to consider the score value obtained by adding the points assigned to each feature of the observation. A decision tree predicts the label of a given observation by answering a series of questions from top to bottom of the tree. We propose these two models because they are easy for practitioners to implement, interpret, and trust. Furthermore, recent advancements allow for optimizing the training of these models (Ustun and Rudin, Citation2019; Lin et al., Citation2020).
5.1. Model features
Table A1 provides a description for each available feature. We consider these features in our analysis based on stakeholder interviews and the results established in the literature. We calculate the odds ratio for each available feature in the full data set and consider the results in combination with stakeholder input to select a subset of features for further analysis. We categorize the continuous features using three quantiles (“low”: 0 to 33.3 percentile, “medium”: 33.3 to 66.6 percentile, “high”: 66.6 to 100 percentile) or natural bins (e.g., “short”: less than 20 miles, “medium”: 20 to 60 miles, “long”: more than 60 miles) when conducting this analysis. Each “medium” category is treated as the reference group and is not included in the model due to multi-collinearity. The features selected from this univariate analysis are shown in with their corresponding odds ratios.
Table 3. Data features selected from univariate analysis and stakeholder input. We use the full data set with sample size N = 9473 to calculate the odds ratio for each feature. For each continuous original feature, the “medium” category is treated as the reference group.
Model features derived from Yelp (referred to as Yelp features hereafter) can directly provide information about the businesses. It is also important to consider the geographic and socio-demographic features of the places where IMBs locate this can help counter-trafficking stakeholders understand community trends and prioritize at-risk areas (Crotty and Bouché, Citation2018; Chin, Takahashi, and Wiebe, Citation2019; White et al., Citation2021; de Vries, Citation2022). Additionally, these features tend to be publicly available, easily accessible, and updated frequently. We explore the additional benefits of the geographic and socio-demographic features from through multivariate analysis. We calculate the adjusted odds ratio for each of these features by controlling for the Yelp features. Results from this analysis are reported in Table A2. Eight geographic or socio-demographic features have statistically significant adjusted odds ratios. We keep these significant features except two features related to “minimum distance to truck stop” because the odds ratio of these features are in the opposite direction to expert opinion. For example, one odds ratio indicates that massage businesses within 20 miles of a truck stop are less likely to be illicit compared to businesses that are 20–60 miles away from a truck stop. This might be because most of the businesses labeled as IMBs in our data are from metro areas which are likely to be far from truck stops. There are 23 features in the final set including the 17 Yelp features and six geographic and socio-demographic features. These six features are percent non-white - low, percent non-white - high, percent foreign born - low, percent of households with children - low, percent age 20 to 29 - low, and minimum distance to military base - long.
5.2. Data sampling
An imbalanced data set poses challenges when training supervised models. We apply an undersampling technique to reduce the imbalance between the majority (label 0) and the minority (label 1) classes. The full data set contains a similar number of businesses from Florida and Texas. We randomly undersample the majority class (Drummond and Holte, Citation2003; Liu et al., Citation2008) while maintaining an equal number of businesses from each state. This results in an undersampled data set that contains 403 label 1 businesses and 1612 label 0 businesses (806 from each state), increasing the label 1 proportion from 4.25% to 20%. We conduct numerical experiments using stratified five-fold cross-validation on the undersampled data set.
5.3. Baseline prediction models
We implement baseline prediction models using the “scikit-learn 1.0.2” package. Specifically, we train logistic regression, random forest, Support Vector Machine (SVM), and naïve Bayes models to predict whether a massage business is an IMB. We use the default settings and parameters of the scikit-learn package except for the following. For logistic regression, we add a class weight of 4 to the 0 labels. For SVM, we use the radial basis function kernel and a class weight of 4 for the 0 labels. For naïve Bayes, we use the Bernoulli naïve Bayes implementation. The same cross-validation data splits are used when training the baseline models, the risk score, and the optimal decision tree models. Although logistic regression models can also be considered as interpretable, they are not as sparse and discrete as the proposed risk score and decision tree models.
5.4. Risk score
When training a risk score, an integer point value is assigned to each feature in the data. The problem of choosing the optimal point values can be formulated as an optimization problem to minimize a loss function subject to integer constraints. Ustun and Rudin (Citation2019) proposed a Mixed-Integer Non Linear Programming (MINLP) model to train a risk score. The input data to the model can be represented by where N is the number of rows in the data,
is a vector of features
and
is the class label. The formulation of the MINLP problem is given by:
(1)
(1)
where the normalized logistic loss function is given by:
(2)
(2)
Here, is a vector of variables and each element
represents the points that feature j contributes to the score and λ0 denotes the intercept.
is a set of feasible integer variables and C0 is a user-defined parameter that balances model fit and sparsity. The risk score for observation
is equal to
The probability that the observation belongs to the positive label class (predicted risk) is calculated by:
(3)
(3)
Two important attributes of a risk prediction model are risk calibration and rank accuracy. A well calibrated model provides predictions that are similar to the observed risk, and a rank-accurate model provides predictions that correctly rank the observations according to their true labels. The observed risk for a given score of s can be estimated by:
(4)
(4)
We assess the calibration of the risk score by comparing the predicted risk to the observed risk for each score value. We assess rank accuracy of the risk score with the Area Under the Receiver Operating Characteristic (ROC) curve (AUC) which is calculated by:
(5)
(5)
where
and
The risk score training problem Equation(1)(1)
(1) is difficult to optimize because it is nonlinear and has a discrete search space. Furthermore, the l0-norm is non-differentiable and non-convex. Ustun and Rudin (Citation2019) developed a Lattice Cutting Plane Algorithm (LCPA) to solve this problem. The LCPA is a branch-and-bound approach that recursively splits the feasible region
and optimizes a linear approximation of the loss function
at each node. We train a risk score on our data using the LCPA implementation in the RiskSLIM package (Ustun, Citation2021). We use default settings of the package. We set the maximum number of features selected to 10 and the run time limit to 3600 seconds.
5.5. Optimal decision tree
Decision trees provide a simple mechanism for classification through a sequence of binary tests or decisions. They are extensively used due to their interpretability and good performance on categorical features (Kotsiantis, Citation2013). As a disadvantage, however, decision trees might have poor out-of-sample performance when the tree is too large. Hence, small trees are often desirable to avoid overfitting and also for interpretability. Heuristic algorithms are frequently used for training decision trees. These methods first construct a tree and then trim it to control its size (Breiman et al., Citation2017).
In the literature, efforts have been made to optimize decision trees in terms of linear metrics such as misclassification error (Nijssen and Fromont, Citation2007; Narodytska et al., Citation2018; Verhaeghe et al., Citation2020) or more challenging nonlinear metrics such as F1 score (Demirović and Stuckey, Citation2021). Several studies have considered controlling the shape of the tree, e.g., the depth of the tree (Bertsimas and Dunn, Citation2017) and number of leaf nodes (Hu et al., Citation2019), to enhance interpretability. Lin et al. (Citation2020) extended the sparse optimal decision tree idea to allow various linear and nonlinear metrics such as weighted accuracy and F1 score. They developed the Generalized and Optimal Sparse Decision Tree (GOSDT) algorithm that balances the value of a loss function against the number of leaf nodes. The objective function is formulated as:
(6)
(6)
where Hd represents the number of leaf nodes. The smaller the regularization term
the more leaf nodes (subgroups) are allowed.
We use the implementation of the GOSDT algorithm in a Python package (Lin, Citation2021). Since our undersampled data set is still imbalanced, we use weighted accuracy and F1 score as our objective in preliminary experiments. F1 score is the harmonic mean of precision and recall. The weighted accuracy is given by:
(7)
(7)
Hence, the cost for predicting positive samples as negative would increase as we increase the weight ω. The GOSDT algorithm requires users to input a weight (ω for wacc), an objective function, and the regularization term λ. We experiment with different combinations of these three parameters, using stratified five-fold cross-validation and training the model for 600 seconds in each fold. Generally, using weighted accuracy as the objective leads to better F1 score and AUC. We also observe that the performance increases as the regularization value λ decreases until More leaf nodes can be created as λ decreases, allowing for finer subgroups. However, decreasing λ too much might cause over-fitting. For the experiments using the same λ value, using ω = 4 performs better than using ω = 3. We do not consider a weight beyond 4 because the proportion of label 0 and label 1 samples in our data set is 4 to 1. We determine the final set of parameters as
and ω = 4 with the weighted accuracy objective. We use these parameters to run cross-validation for a longer time (5400 seconds for each fold) and report the model performance in Section 6.3.
6. Computational results
We first present the risk score and optimal decision tree models. We then compare their performance to baseline models and discuss each model’s features and strengths.
6.1. Risk score
We train the risk score on the undersampled data set with 23 features for 3600 seconds, achieving an optimality gap of 2.5%. displays the model features and their corresponding point values. The risk score for a business is calculated as the sum of the intercept and the points for each feature. For example, consider a business that has “Yelp Phone in Advertisement” and “Yelp Spa Category” as true and all other selected features as false. These two features have point values of 3 and -1, respectively. When added to the intercept value of -3, a score of -1 is obtained.
Table 4. Point value of each feature in the optimized risk score.
The predicted risk Equation(3)(3)
(3) and observed risk Equation(4)
(4)
(4) for each score value are shown in . Considering the same example introduced above and referencing , a score of -1 translates to a predicted risk of 26.9%. The observed risk of 25.8% means that in the labeled data set, 25.8% of the businesses with a score of -1 are labeled as IMBs. Observed risk generally increases with increments in score value and closely follows the predicted risk values, indicating the model is well calibrated. also displays the number of businesses and the observed risk for each score value in the full data set. As expected, the observed risk for each score value is smaller in the full data set. The observed risk still increases with risk score except for score 5 though. In this model, any integer score between -6 and 6 is possible, however, no business achieves either extreme (-6 or 6), even in the full data set. We can use the risk score for classification by selecting a threshold. For example, score zero, which corresponds to a predicted probability of 0.5 in Equation(3)
(3)
(3) , can be used as the classification threshold.
Figure 2. Histogram of the risk score values in the undersampled data set. The shorter bars and numbers in parenthesis show the counts of IMBs for each score. Predicted risk Equation(3)(3)
(3) and observed risk Equation(4)
(4)
(4) is calculated for each score value. We also present the number of businesses and the observed risk for each score value in the full data set.
 is calculated for each score value. We also present the number of businesses and the observed risk for each score value in the full data set.](/cms/asset/ce5d0a9b-7cb9-416e-bf3c-514d9b3aa8ed/uiie_a_2113187_f0002_b.jpg)
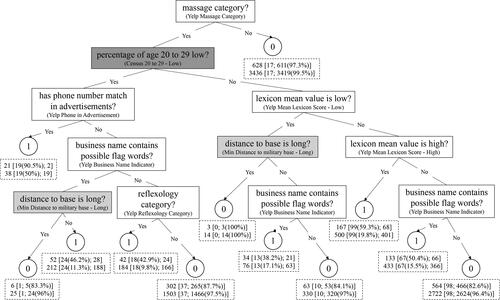
6.2. Optimal decision tree
Using the parameter values identified in Section 5.5, we run the GOSDT algorithm on the undersampled data set for 18,000 seconds to obtain the decision tree in . The predicted label for each leaf node is displayed in a circle. For each leaf node, we report the number of businesses in the undersampled data (first row) and full data (second row). We also report the number of businesses with label 0 and label 1 as well as the percentage of correct classifications in square brackets. As expected, the percentage of true negatives is greater, and the percentage of true positives is smaller in the full data set compared to the undersampled data set.
Figure 3. Decision tree trained on the undersampled data set. White, light grey, and dark grey nodes indicate the data sources; Yelp, GIS, and Census, respectively. The text in parenthesis in each node are the feature names in .
6.3. Prediction performance
We report the prediction performance for the risk score and optimal decision tree models and compare them to the baseline models in . We evaluate the performance metrics using stratified five-fold cross-validation and report the average value of each metric over all folds. We display the confusion matrix for the test set as well as the precision, recall, and F1 score. Lastly, we display the average AUC and range of AUC values across the five folds. We compare the models based on the F1 score due to the imbalanced data set. We also consider the AUC because accurately ranking businesses by risk is important in practice.
Table 5. Average cross-validation test results for the risk score and optimal decision tree compared with baseline models. TN = true negatives, FP = false positives, FN = false negatives, and TP = true positives. AUC Range is calculated as the difference between the highest and lowest AUC value across the five folds. A threshold of 0.5 is used for classification in the risk score model.
In terms of F1 score, the risk score and optimal decision tree models are both comparable to the baseline models. We also note that the optimal decision tree has higher F1 score and recall than the random forest model. In terms of AUC, the risk score and baseline models have similar performance, but the decision tree model is slightly worse. This is also seen in the ROC curve for each model in . In addition, the risk score has the smallest AUC range, indicating its robustness over the folds.
Figure 4. Test ROC curve for the risk score and the optimal decision tree models averaged over five folds and compared to baseline models.
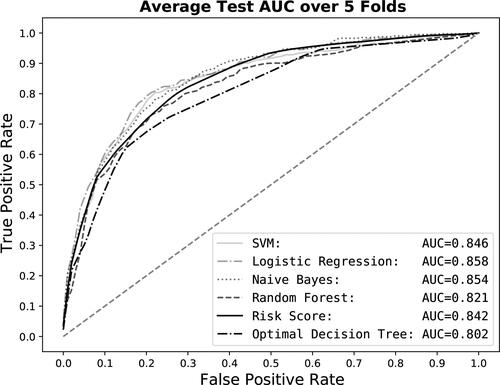
We propose the risk score and optimal decision tree models for their interpretability. It is expected that their performance will be somewhat lower than other less interpretable models. However, the risk score still achieves the second highest precision among the baseline models.
6.4. Discussion
In this section, we comment on the features used in each model, strengths and weaknesses of each model, and potential improvements.
6.4.1. Model comparison
We analyze the features that are used in the risk score and optimal decision tree model and draw some conclusions about which data sources and types of features are most important in detecting IMBs. The following features are used in both models:
Yelp Phone in Advertisement: This feature has a strong impact in both models. It has the highest point value in the risk score and contributes to the node with the highest percentage of correct classification for label 1 (90.5%) in the optimal decision tree. Listing a phone number that is also present in classified ads for commercial sex may indicate that the massage business is the location for the advertised sex acts or otherwise involved.
Yelp Massage and Spa Categories: These category features also heavily impact both models. In the decision tree model, if the massage category is false, it results in a classification of 0. In the risk score model, the spa category has a negative point value. In the data set, if a business is not in the massage category, it must be in the spa category. We can therefore conclude that spa-type businesses are less likely to be IMBs.
Yelp Reflexology Category: Businesses that only offer reflexology of the hands and feet are exempt from massage licensing requirements in certain jurisdictions including Texas (Texas Department of Licensing and Regulation, Citation2022). Stakeholder interviewees mentioned that IMBs may use this loophole to avoid regulation.
Business Name Indicator: The business name of an IMB might use certain words to attract customers. This indicator feature includes words such as “happy” and “lucky” and words relating to Asian massage.
Yelp Mean Lexicon Score: The Yelp Mean Lexicon Score - High feature is included in both models, and the Yelp Mean Lexicon Score - Low feature is included in the optimal decision tree. Customer reviews can provide first-hand witness to illicit activities in a massage business. In addition to high lexicon scores indicating IMB risk, having low lexicon scores might show that the business is legitimate.
Other features that are used by one of the models include the following:
Yelp Review Minimum Rating is 5: With negative points assigned in the risk score, businesses with only five star reviews are more likely legitimate. This is reasonable considering the typical Yelp reviewer is not looking for an IMB.
Yelp Review Rating Standard Deviation is 0: A standard deviation of 0 means that all of the customer reviews give the same rating which may imply that the business has a small number of Yelp reviews. Businesses that are not well established on Yelp may be more likely illicit than those that are well established. Although the business may have a small number of positive reviews, if they are all rated 5, then the effect is negated in the risk score by the feature listed above.
Yelp Review Male Author Percent - High: Having a high percentage of reviews from male authors increases the risk score. A high percentage of male review authors may indicate a high percentage of male customers. It is known that IMBs primarily attract male customers (Crotty and Bouché, Citation2018).
Census Percent Non-White - Low: Having a low percentage of non-white population detracts from the risk score indicating that IMBs may choose to locate in areas with high percentage of underrepresented population. This reflects the findings of racial features in work by Crotty and Bouché (Citation2018), Chin, Takahashi, and Wiebe (Citation2019), and White et al. (Citation2021).
Census Percent Age 20 to 29 - Low: This feature has a strong influence in the optimal decision tree because it is used right after the root branch. Note that the odds ratio for having a low percentage of population with age in the 20s is less than one in . People in their 20s experience the highest levels of residential mobility in the U.S. (Frost, Citation2020). We conjecture that areas with less young people therefore experience lower levels of residential mobility and lower levels of social disorganization. de Vries (Citation2022) showed that social disorganization could partially explain IMB placement.
Distance to Military Base - Long: In both of the two decision tree nodes for this feature, there is a smaller portion of labeled IMBs when the distance to military base is long. This may imply that businesses closer to a military base have higher risk which aligns with the opinion derived from our stakeholder interviews that IMBs can benefit from demand when locating near military bases.
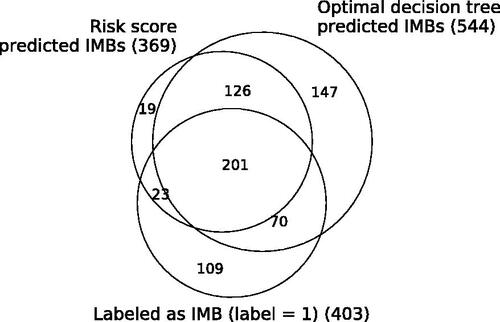
Of the features we consider, mostly Yelp features are selected by the models. For the socio-demographic and geographic features, we create three bins using quantiles or natural cutoffs. Further tuning these thresholds may be of benefit for both feature types. shows the number of predicted IMBs by each model in the cross-validation test sets and the set of all businesses labeled as 1. The majority of the positive predictions from each model overlap. The optimal decision tree model can identify 47 more true positives than the risk score model at the cost of 147 more false positives. Together the two models can detect 294 of the 403 true suspected IMBs.
Figure 5. This figure shows the overlap of businesses that are predicted IMBs by each model in the cross-validation test sets and the set of all businesses labeled as IMBs (label = 1). The total count for each category is displayed in parentheses. A threshold of 0.5 is used for classification in the risk score model.
In addition to the prediction performance of the two models, other factors can be considered when choosing a model to use in practice. The risk score provides a natural means for ranking businesses by risk. A higher score value means a higher risk that the business is an IMB. The user can obtain the risk by looking up the score value in a simple table as seen in the first two rows of the table in . The optimal decision tree model can also provide risk estimates at each leaf node (see ). The users can easily follow the structure of the tree to understand the decision logic of the model. They can also see how businesses are grouped together by sets of features and how combinations of features interact to influence predictions. Furthermore, the small size and simplicity of both models enable the users to make predictions without complex calculations.
Both models can be integrated into existing counter-trafficking investigative database systems such as Global Emancipation Network’s database platform Minerva, allowing users to visualize all the data that contributes to a business’s prediction. Interpretable machine learning models are useful in enabling decision makers to make well understood and informed decisions. This is especially important in criminal justice because poorly informed decisions can have dire consequences, and only well understood decision tools are likely to be adopted by stakeholders (Deeb-Swihart et al., Citation2019; Raaijmakers, Citation2019).
6.4.2. Limitations and future work
shows 11 labeled IMBs earning the lowest two risk score values and six labeled non-IMBs earning the highest three risk scores values, indicating a disagreement between the score and the label. We closely examine these businesses to understand from where this disagreement stems,
Of the 11 businesses labeled as IMBs with the lowest risk scores, two have several verified illicit Rubmaps reviews, one had a penalty assessed for sexual misconduct, and one had a penalty assessed for employing unlicensed therapists. The remaining businesses require a closer look to determine if they received the appropriate label. Five are labeled as IMBs because their business license was voluntarily surrendered for an undisclosed reason. The remaining two are labeled as IMBs from their Rubmaps reviews, but one has a Rubmaps review saying that the business is legitimate. The other one has no information in common between the Yelp and Rubmaps pages other than the address. The address maps to a large office building, indicating that they may be falsely attributed to the same business.
All six of the businesses that are not labeled as IMBs, but have high risk scores, list a phone number that matches a sexually oriented classified advertisement. Searching the internet for these phone numbers reveals that five of these businesses are still listed on commercial sex websites advertising under the name of the massage business. Three businesses have high lexicon scores and four have a high percentage of male reviewers. Looking closer at the Yelp reviews, we see one review that reports about a therapist who was arrested for prostitution at the business. Another business has only two Yelp reviews; a five-star review from a male customer commenting on the attractiveness of the therapist and a one star review from a female customer complaining about a therapist prioritizing a male customer who entered during her massage. Most of these observations show that our labeling assumptions have some limitations. However, they also show that even with non-perfect labeling, the predictions make sense at each extreme, and it is worthwhile to investigate all predicted high-risk businesses since they might still have tangible risk factors present. Future work will involve more in-depth investigations of these businesses and relabeling them if necessary. This analysis can also suggest new features to consider. For example, the ratio of positive (five-star) male author reviews to negative (one-star) female author reviews. While the review score and author gender are included, their interaction is not explicitly considered in the current models.
We will also consider including other data sources in future improvements. The SafeGraph (SafeGraph, Citation2021) data set provides details about business operating hours and foot traffic. Late closing times (after 11:00 PM) and long business hours are known characteristics of IMBs (de Vries and Radford, Citation2022). In preliminary analysis of SafeGraph data, we identify some challenges for fully incorporating SafeGraph data into this work. The data set has many missing values and only partially overlaps with the Yelp data set. However, a basic descriptive analysis of the overlap of the two data sets suggests that of the businesses open past 11:00 PM on SafeGraph, over 30% are labeled as IMBs in our data set in contrast to less than 6% of those businesses closing before 11:00 PM. In future work, we will implement an ensemble of Yelp and SafeGraph prediction models. We also plan to include financial data such as tax records which may create reliable financial indicators or expose IMB networks. However, these data sets are difficult to obtain for large numbers of businesses. In this study, we emphasize models that utilize easily accessible data. For that reason we did not explore these data sources.
7. Conclusion
Informed by findings from 24 stakeholder interviews, analysis of online data and other attributes previously documented in the literature, we create two interpretable prediction models which can be used by a variety of stakeholders in their efforts to disrupt illicit businesses selling sex while masquerading as massage establishments. Combined, our two models identify around 300 businesses in the considered jurisdictions with high indicators of sexually oriented activity, raising confidence that human trafficking likely accounts for some of their business practices.
The outputs of our models can be used by law enforcement to build digital evidence against traffickers and lessen reliance on victim testimony to prosecute a difficult-to-obtain human trafficking charge requiring force, fraud, or coercion. Victim service providers can review correlated online information in advance of victim interaction allowing greater focus on trauma-informed techniques. Regulators and departments of health can likewise utilize our model outputs to track trends and patterns in IMB operations and establish regulatory practices which are effective against IMBs but limit harm to legitimate massage establishments and practitioners. We recognize that there are many hurdles in trafficking prosecutions that may limit the impact of this study including variations in local legislation and reliance on victim testimony.
Interpretable models that assess the likelihood of human trafficking in each business can be expanded to additional sectors, such as hospitality, transportation, and finance. Similarly, the proposed methodology for automating sensemaking of online customer reviews and aggregating them to business level understandings has a multitude of applications and implications for private enterprise, law enforcement, and national security. The proposed interpretable models have the potential to meet a growing need in the counter-trafficking sector to understand and prevent online facilitation of trafficking.
Reproducibility Report
Download PDF (122.5 KB)Online_Supplement.pdf
Download PDF (169.8 KB)Data availability statement
This work utilizes several data sources with varying levels of accessibility to create one labeled data set for training and evaluating the proposed models. The geographic and socio-demographic data sets are publicly available. The licensing records obtained through public records requests cannot be shared but other researchers can submit the same public records requests. Access to the non-publicly available data sets, Yelp, Rubmaps, and advertisement phone numbers can be requested from Global Emancipation Network. Table A3 itemizes each data source used by the authors and explains how one can access or obtain the data set.
Additional information
Funding
Notes on contributors
Margaret Tobey
Margaret Tobey is a PhD student in the Operations Research Program at North Carolina State University. She received her bachelor’s degree in industrial and systems engineering in 2018 and master’s degree in operations research in 2020, both at NC State. Her research uses data science and machine learning to detect and disrupt human trafficking.
Ruoting Li
Ruoting Li is a PhD student in the Edward P. Fitts Department of Industrial and Systems Engineering at North Carolina State University. In 2018, she earned her bachelor’s degree in industrial and systems engineering from Lehigh University. Her research interests include developing interpretable machine learning models, with applications in healthcare and combating human trafficking.
Osman Y. Özaltın
Osman Özaltın is an associate professor in the Edward P. Fitts Department of Industrial and Systems Engineering at North Carolina State University. He is also a member of the Personalized Medicine Faculty Cluster. He received his MS and PhD degrees in industrial engineering from the University of Pittsburgh. His research interests span theoretical, computational, and applied aspects of mathematical programming, focusing on decision problems arising in personalized medical decision making and illicit supply chains. His methods include integer programming, combinatorial optimization, stochastic programming, bilevel programming, and decomposition algorithms for large-scale mathematical programs.
Maria E. Mayorga
Maria E. Mayorga is a professor of personalized medicine in the Edward P. Fitts Department of Industrial and Systems Engineering at North Carolina State University. She received her M.S. and PhD degrees in industrial engineering and operations research from the University of California, Berkeley. Her research interests include using mathematical programming, stochastic models and simulation for predictive models in health care, health care operations management, emergency response, and humanitarian logistics. In particular, she is interested in problems that help improve the human condition. In 2022 she became a Fellow of IISE.
Sherrie Caltagirone
Sherrie Caltagirone is the Founder and Executive Director of Global Emancipation Network (GEN), the leading data analytics and intelligence nonprofit dedicated to countering human trafficking. Prior to starting GEN, she served as a Policy Advisor for Orphan Secure, a global human trafficking rescue nonprofit, and began her anti-trafficking career with the Protection Project at the Johns Hopkins University. She received her degree in international relations summa cum laude from American University.
References
- Alvari, H., Shakarian, P. and Snyder, J.E.K. (2017) Semi-supervised learning for detecting human trafficking. Security Informatics, 6(1), 1–14.
- Bertsimas, D. and Dunn, J. (2017) Optimal classification trees. Machine Learning, 106(7), 1039–1082.
- Borrelli, D. and Caltagirone, S. (2020) Non-traditional cyber adversaries: Combatting human trafficking through data science. Cyber Security: A Peer-Reviewed Journal, 4(1), 77–90.
- Bouché, V. and Crotty, S.M. (2018) Estimating demand for illicit massage businesses in Houston, Texas. Journal of Human Trafficking, 4(4), 279–297.
- Breiman, L., Friedman, J.H., Olshen, R.A. and Stone, C.J. (2017) Classification and Regression Trees, Routledge, New York, NY.
- Caltagirone, S. (2017) The human trafficking kill chain: A guide to systematic disruption. Available at https://www.globalemancipation.ngo/the-human-trafficking-kill-chain/(accessed 19 November 2021).
- Children at Risk (2018) Human trafficking near Texas public schools. Available at https://catriskprod.wpengine.com/human_trafficking_near_schools_analysis/ (accessed 6 February 2021).
- Chin, J.J., Takahashi, L.M., Baik, Y., Ho, C., To, S., Radaza, A., Wu, E., Lee, S., Dulfo, M. and Jung, D. (2019) Illicit massage parlors in Los Angeles County and New York City: Stories from women workers. Available at http://johnchin.net/Article_Files/MP_Study_10.11.19_FINAL.pdf (accessed 1 August 2022).
- Chin, J.J., Takahashi, L.M. and Wiebe, D.J. (2019) Where and why do illicit businesses cluster? Comparing sexually oriented massage parlors in Los Angeles County and New York City. Journal of Planning Education and Research. In press and online available. https://doi.org/10.1177/0739456X19859637
- Crotty, S.M. and Bouché, V. (2018) The red-light network: Exploring the locational strategies of illicit massage businesses in Houston, Texas. Papers in Applied Geography, 4(2), 205–227.
- de Vries, I. (2022) Examining the geography of illicit massage businesses hosting commercial sex and sex trafficking in the United States: The role of census tract and city-level factors. Crime & Delinquency. In press and online available. https://doi.org/10.1177/00111287221090952
- de Vries, I. and Radford, J.J. (2022) Identifying online risk markers of hard-to-observe crimes through semi-inductive triangulation: The case of human trafficking in the United States. The British Journal of Criminology, 62(3), 639–658.
- Deeb-Swihart, J., Endert, A. and Bruckman, A. (2019) Understanding law enforcement strategies and needs for combating human trafficking, in Proceedings of the 2019 CHI Conference on Human Factors in Computing Systems, Paper number 331, ACM, New York, NY.
- Demirović, E. and Stuckey, P.J. (2021) Optimal decision trees for nonlinear metrics, in Proceedings of the AAAI Conference on Artificial Intelligence, Held virtually, Volume 35, AAAI Press, Palo Alto, CA, pp. 3733–3741.
- Diaz, M. and Panangadan, A. (2020) Natural language-based integration of online review datasets for identification of sex trafficking businesses, in Proceedings of the 2020 IEEE 21st International Conference on Information Reuse and Integration for Data Science, IEEE Press, Piscataway, NJ, pp. 259–264.
- Drummond, C. and Holte, R.C. (2003) C4.5, Class imbalance, and cost sensitivity: Why under-sampling beats over-sampling, in Workshop on Learning from Imbalanced Datasets II, International Conference on Machine Learning, AAAI Press, Palo Alto, CA, pp. 1–8.
- Dubrawski, A., Miller, K., Barnes, M., Boecking, B. and Kennedy, E. (2015) Leveraging publicly available data to discern patterns of human-trafficking activity. Journal of Human Trafficking, 1(1), 65–85.
- Esfahani, S.S., Cafarella, M.J., Pouyan, M.B., DeAngelo, G.J., Eneva, E. and Fano, A.E. (2019) Context-specific language modeling for human trafficking detection from online advertisements, in Proceedings of the 57th Annual Meeting of the Association for Computational Linguistics, ACL, Stroudsburg, PA, pp. 1180–1184.
- Esri (2021) USA freeway system. Available at https://hub.arcgis.com/maps/esri::usa-freeway-system/about (accessed 4 October 2021).
- Florida Board of Massage Therapy (2022) Licensing and regulation. Available at https://floridasmassagetherapy.gov/licensing/ (accessed 17 January 2022).
- Frost, R. (2020) Are Americans stuck in place? Declining residential mobility in the US. Available at https://www.jchs.harvard.edu/research-areas/research-briefs/are-americans-stuck-place-declining-residential-mobility-us (accessed 1 August 2022).
- Helderop, E., Huff, J., Morstatter, F., Grubesic, A. and Wallace, D. (2019) Hidden in plain sight: A machine learning approach for detecting prostitution activity in Phoenix, Arizona. Applied Spatial Analysis and Policy, 12(4), 941–963.
- Hernández-Álvarez, M. and Granizo, S.L. (2021) Detection of human trafficking ads in Twitter using natural language processing and image processing, in Advances in Artificial Intelligence, Software and Systems Engineering, Held virtually, Volume 1213, Springer, Cham, Switzerland pp. 77–83.
- Heyrick Research (2021) Snapshot – The illicit massage industry at a glance. Available at https://www.heyrickresearch.org/research/what-is-the-illicit-massage-industry (accessed 9 September 2021).
- Hu, X., Rudin, C. and Seltzer, M. (2019) Optimal sparse decision trees, in Advances in Neural Information Processing Systems, Volume 32, NeurIPS, Inc., San Diego, CA, pp. 7235–7243.
- Ibanez, M. and Suthers, D.D. (2014) Detection of domestic human trafficking indicators and movement trends using content available on open internet sources, in Proceedings of the 47th Hawaii International Conference on System Sciences, IEEE Computer Society, Washington, DC, pp. 1556–1565.
- ILO (2017) Global estimates of modern slavery: Forced labour and forced marriage. Available at https://www.ilo.org/wcmsp5/groups/public/–-dgreports/–-dcomm/documents/publication/wcms_575479.pdf (accessed 1 August 2022).
- Kahn, H.S., Cheng, Y.J., Thompson, T.J., Imperatore, G. and Gregg, E.W. (2009) Two risk-scoring systems for predicting incident diabetes mellitus in US adults age 45 to 64 years. Annals of Internal Medicine, 150(11), 741–751.
- Keskin, B., Bott, G. and Freeman, N. (2021) Cracking sex trafficking: Data analysis, pattern recognition, and path prediction. Production and Operations Management, 30(4), 1110–1135.
- Kotsiantis, S.B. (2013) Decision trees: A recent overview. Artificial Intelligence Review, 39(4), 261–283.
- Li, R., Tobey, M., Mayorga, M., Caltagirone, S. and Özaltın, O. (2021) Detecting human trafficking: Automated classification of online customer reviews of massage businesses. Available at SSRN: 3982796.
- Lin, J. (2021) Generalized optimal sparse decision trees. Available at https://github.com/Jimmy-Lin/GeneralizedOptimalSparseDecisionTrees (accessed 1 August 2022).
- Lin, J., Zhong, C., Hu, D., Rudin, C. and Seltzer, M. (2020) Generalized and scalable optimal sparse decision trees, in Proceedings of the 37th International Conference on Machine Learning, Held virtually, pp. 6150-6160.
- Liu, X.-Y., Wu, J. and Zhou, Z.-H. (2008) Exploratory undersampling for class-imbalance learning. IEEE Transactions on Systems, Man, and Cybernetics, Part B (Cybernetics), 39(2), 539–550.
- Mletzko, D., Summers, L. and Arnio, A.N. (2018) Spatial patterns of urban sex trafficking. Journal of Criminal Justice, 58, 87–96.
- Narodytska, N., Ignatiev, A., Pereira, F., and Marques-Silva, J. (2018) Learning optimal decision trees with SAT, in Proceedings of the Twenty-Seventh International Joint Conference on Artificial Intelligence, AAAI Press, Palo Alto, CA, pp. 1362–1368.
- Nijssen, S. and Fromont, E. (2007) Mining optimal decision trees from itemset lattices, in Proceedings of the 13th ACM SIGKDD International Conference on Knowledge Discovery and Data Mining, ACM, New York, NY. pp. 530–539.
- Office of the Assistant Secretary of Defense for Sustainment (2019) Geographic information systems datasets. Available at https://www.acq.osd.mil/dodsc/fast41_gisdatasets.html (accessed 4 October 2021).
- Placekey (2021) What is placekey? Available at https://www.placekey.io/ (accessed 17 January 2021).
- Polaris Project (2012) Sex trafficking at truck stops. Available at https://humantraffickinghotline.org/resources/sex-trafficking-truck-stops (accessed 28 October 2021).
- Raaijmakers, S. (2019) Artificial intelligence for law enforcement: Challenges and opportunities. IEEE Security & Privacy,17(5), 74–77.
- Ramchandani, P., Bastani, H. and Wyatt, E. (2021) Unmasking human trafficking risk in commercial sex supply chains with machine learning. Available at SSRN: 3866259.
- RESET180 (2020) IMB report: A community problem. Available at https://reset180.com/imb-report (accessed 6 February 2021).
- Rudin, C., Chen, C., Chen, Z., Huang, H., Semenova, L. and Zhong, C. (2022) Interpretable machine learning: Fundamental principles and 10 grand challenges. Statistics Surveys, 16, 1 – 85.
- SafeGraph (2021) Safegraph documentation. Available at https://docs.safegraph.com/docs (accessed 19 October 2021).
- Singh, M., Lennon, R.J., Holmes, D.R., Bell, M.R. and Rihal, C.S. (2002) Correlates of procedural complications and a simple integer risk score for percutaneous coronary intervention. Journal of the American College of Cardiology, 40(3), 387–393.
- Texas Department of Licensing and Regulation (2022) Massage therapy. Available at https://www.tdlr.texas.gov/mas/mas.htm (accessed 17 January 2022).
- Tong, E., Zadeh, A., Jones, C. and Morency, L.-P. (2017) Combating human trafficking with deep multimodal models. arXiv preprint arXiv:1705.02735.
- UNODC (2021) Chapter 5: Traffickers use of the internet; Digital hunting fields, in Global Report on Trafficking in Persons 2020, United Nations, New York, NY, pp.119–128.
- U.S. Census Bureau (2021) American community survey data tables. Available at https://www.census.gov/programs-surveys/acs/data/data-tables.html (accessed 17 January 2021).
- U.S. Department of Agriculture (2020) Rural-urban commuting area codes. Available at https://www.ers.usda.gov/data-products/rural-urban-commuting-area-codes.aspx (accessed 13 February 2022).
- U.S. Department of Homeland Security (2021a) Homeland infrastructure foundation-level data - local law enforcement locations. Available at https://hifld-geoplatform.opendata.arcgis.com/datasets/geoplatform::local-law-enforcement-locations/about (accessed 4 October 2021).
- U.S. Department of Homeland Security (2021b) Homeland infrastructure foundation-level data - public schools. Available at https://hifld-geoplatform.opendata.arcgis.com/datasets/geoplatform::public-schools/about (accessed 4 October 2021).
- U.S. Department of Transportation (2021) Bureau of Transportation statistics - truck stop parking. Available at https://data-usdot.opendata.arcgis.com/datasets/usdot::truck-stop-parking/about (accessed 4 October 2021).
- Ustun, B. (2021) risk-slim. Available at https://github.com/ustunb/risk-slim (accessed 13 February 2022).
- Ustun, B. and Rudin, C. (2019) Learning optimized risk scores. Journal of Machine Learning Research, 20(150), 1–75.
- Verhaeghe, H., Nijssen, S., Pesant, G., Quimper, C.-G. and Schaus, P. (2020) Learning optimal decision trees using constraint programming. Constraints, 25(3), 226–250.
- Vyas, M. and Caltagirone, S. (2019) Combating human trafficking using analytics, in Splunk.conf19, Las Vegas, NV. Splunk, San Francisco, CA. Available at https://conf.splunk.com/files/2019/slides/BAS2793.pdf?podcast=1577146223 (accessed 14 July 2021).
- Wang, L., Laber, E., Saanchi, Y. and Caltagirone, S. (2020) Sex trafficking detection with ordinal regression neural networks, in The AAAI-20 Workshop on Artificial Intelligence for Cyber Security. Available at arXiv:1908.05434.
- White, A., Guikema, S. and Carr, B. (2021) Why are you here? Modeling illicit massage business location characteristics with machine learning. Journal of Human Trafficking. In press and online available. https://doi.org/10.1080/23322705.2021.1982238
- Zhu, J., Li, L. and Jones, C. (2019) Identification and detection of human trafficking using language models, in 2019 European Intelligence and Security Informatics Conference, IEEE Press, Piscataway, NJ, pp. 24–31.