
ABSTRACT
The purpose of this study was to examine the activity profile of elite Gaelic football referees (GFR) and to examine temporal changes between the first and second half and across the four quarters. Global positioning systems technology (10-Hz) was used to collect activity data during 202 competitive games from 23 elite GFR. Relative distance, peak running speed and relative distance covered in six movement categories [very low-speed movement (VLSM) (<0.70 m·s−1), walking (≥0.70–1.65 m·s−1), low-speed running (LSR) (≥1.66–3.27 m·s−1), moderate-speed running (MSR) (≥3.28–4.86 m·s−1), high-speed running (HSR) (≥4.87–6.48 m·s−1), very high-speed running (VHSR) (≥6.49 m·s−1)] were examined during the full game, first and second half, and across the four quarters. The relative distance covered was 122.6 ± 8.4 m·min−1, with 13.1 ± 4.9 m·min−1 of HSR and VHSR. The peak running speed was 6.75 ± 0.49 m·s−1. The relative (ES=0.60), MSR (ES=0.50) and HSR (ES=0.14) distance was higher in the first half than the second half. A higher relative (ES=0.62–0.91) and HSR (ES=0.51–0.61) distance was found in the first quarter than any other period. No differences in HSR distance were found between the second, third and fourth quarters (ES=0.04–0.10). This study provides, for the first time, a detailed insight into the activity profile of elite GFR during competitive games and demonstrates the demanding, intermittent nature of elite refereeing in Gaelic football. This information may be used as a framework for coaches to design training programmes specific to GFR.
Introduction
Gaelic football (GF) is an intermittent invasion field-based team sport involving periods of high-speed activity interspersed with moderate to low-speed activity. The high-speed activity bouts are largely unpredictable and imposed by the pattern of play (Kelly et al. Citation2021). GF is played between two teams of 15 players, across two 35 min periods on a rectangular grass playing surface that is approximately 140 × 90 m (Cullen et al. Citation2017; Gamble et al. Citation2019). The National Football League (NFL), contested between January and April, and the All-Ireland Championship (AIC), contested between May and September are the two major competitions played annually (Gamble et al. Citation2019). Games are officiated by a referee with assistance from two side-line officials and four goal-line umpires. The decisions of the referee are of considerable importance as they have the potential to influence the outcome of the game. To ensure optimal positioning for decision making, GF referees (GFR) need to keep up with play at all times. In this regard, refereeing at the elite level in GF represents a considerable physical challenge.
Advances in microtechnology devices incorporating global positioning system technology (GPS) has facilitated routine evaluation of player activity profiles during training and competition (Malone et al. Citation2016; Gamble et al. Citation2019). During NFL and AIC games, elite players cover ~116 m·min−1 with ~25 m·min−1 at high-speed (≥4.72 m·s−1) and attain peak running speeds of ~8 m·s−1 (Malone et al. Citation2016). An examination of seasonal variations in the activity profile of elite GF players found significant increases in the total and high-speed running (HSR) distance during the latter stages of the AIC compared to any other phase of the season (Mangan et al. Citation2019). To date, no study has examined the activity profile of elite GFR during AIC games. This lack of information is currently a major limitation in the design of training programmes.
Although full game match analysis provides a global measure of the activity profile of invasion field-based team sport athletes and referees, failure to examine the temporal changes in activity profile may mask the decrements in running performance between halves and quarters of match play. For example, elite soccer referees have been found to be at a greater distance from decisions in the attacking areas of the pitch during the latter stages of games (Krustrup et al. Citation2009), and to make more errors in the second half (Mallo et al. Citation2012).
Temporal changes in the activity profile of soccer and rugby referees have been examined with mixed results (D’Ottavio and Castagna Citation2001; Weston et al. Citation2007; O’Hara et al. Citation2013). The total distance covered by elite Premier League soccer referees decreased in the second half whereas there was no difference in HSR (>5.5 m·s−1) between halves (Weston et al. Citation2007). In contrast, the distance covered while jogging (2.0–4.0 m·s−1), running (4.0–5.5 m·s−1) and running at high-speed (5.5–7.0 m·s−1) was found to be lower among elite soccer referees during the second half of match play (Di Salvo et al. Citation2011). Although no difference was found in total distance covered between halves among elite rugby league referees, there was a lower number of high-intensity efforts in the second half (O’Hara et al. Citation2013).
Unlike rugby league and soccer referees, GFR are amateur and are required to cover a relative playing area of ~425 m2 per player which is much greater than in soccer (~320 m2) and rugby (~233 m2). While it is unclear the extent to which the onset of fatigue, pacing strategies, or match tempo contribute to temporal changes in the activity profile of the referee, a reduction in the running performance of elite GFR during the latter stages of games may indicate an impaired ability to keep up with play and may increase the likelihood of making incorrect decisions (Krustrup and Bangsbo Citation2001).
The aim of this study was to examine the activity profile of elite GFR during AIC games and to examine the temporal changes in the activity profile between the first and second half and from the first to the fourth quarter of match play. It was hypothesised that there would be a decrease in the total distance, distance covered at high-speed and peak running speed between the first and second halves and in the fourth quarter compared to any other quarter of match play.
Methodology
Experimental design
A longitudinal observational study design was used to evaluate the activity profile of elite GFR during competitive match play. Participants were recruited from the Gaelic Athletic Association (GAA) senior championship panel which is selected prior to the start of the AIC each year. Match activity data was collected in ~80% of AIC games during four competitive seasons using GPS technology. The dataset comprises games from all phases of the competition including quarter-finals, semi-finals and finals. The activity data derived from the GPS device were used to quantify the distances and running speeds achieved during AIC games. The match activity data were separated into halves and quarters to examine temporal changes in the activity profile.
Participants
Twenty-three elite inter-county GFR [mean ± standard deviation (SD); age, 39.5 ± 4.7 yr; range, 30–49 yr; experience at national level, 8.7 ± 4.3 yr; range 3–20 yr] gave written informed consent to participate after written and verbal explanations of the study procedures. Ethical approval was obtained from Dublin City University Research Ethics Committee (DCUREC/2018/041) in accordance with the declaration of Helsinki. A total of 202 full game datasets were collected between 2016 and 2019. Subjects were part of the elite GAA senior championship referee panel during the data collection period.
Procedures
During each game referees wore 10-Hz GPS devices (STATSports, Newry, Ireland), midway between the scapulae in a custom-made undergarment. In order to establish a GPS satellite lock, devices were activated a minimum of 15 min prior to the start of each game (Scott et al. Citation2016). The validity and reliability of the GPS devices has been previously reported (Beato et al., Citation2018a; Beato et al. Citation2018b). GPS devices operating at 10-Hz provide superior validity and reliability compared to devices with lower sampling rates (Scott et al. Citation2016). Data from the GPS devices were downloaded to the manufactures software and separated into first and second halves, including the additional time at the end of each half and excluding the warm-up and half-time period. The raw data was then exported and analysed further using the Python (v.3.7) programming language (Python Software Foundation, Wilmington, DE, USA).
Data points were excluded from the analysis if instantaneous velocity was >10 m·s−1, instantaneous acceleration was >6 m·s−2 or instantaneous deceleration was >6 m·s−2 (Park et al. Citation2019; Brady et al. Citation2021). The horizontal dilution of precision (HDOP) and number of satellites locked to the device was available for all datasets collected during 2018 and 2019 (n = 110). Data points from these files were excluded from the analysis if the HDOP was >2.0 or if the number of satellites locked on to the device was <8 (Malone et al. Citation2017; Park et al. Citation2019). Match files in which excluded data accounted for >3% of the game time were removed from the analysis (n = 1). This resulted in a final dataset of 201 full game datasets, with a median of 9 full game datasets per referee (µ = 8.7 games; range: 2–19 games).
The movement variables analysed were total distance, very low-speed movement (VLSM) (<0.70 m·s−1), walking (≥0.70–1.65 m·s−1), low-speed running (LSR) (≥1.66–3.27 m·s−1), moderate-speed running (MSR) (≥3.28–4.86 m·s−1), HSR (≥4.87–6.48 m·s−1), very high-speed running (VHSR) (≥6.49 m·s−1) and peak running speed. The movement categories and corresponding velocity thresholds applied were developed specifically for the analysis of elite GFR (Brady et al. Citation2021). The total distance and distance covered in each movement category was reported in relative terms, expressed as metres and distance per unit time (m·min−1). To examine the temporal changes in the activity profile, full game data was separated into the first and second half and into four quarters which represented the first and last fifteen minute periods in each half.
Statistical analysis
Statistical analysis was completed using the Statistical Package for the Social Sciences (v.25) (IBM, Chicago, IL, USA). Data are presented as mean ± SD, unless otherwise stated. Temporal changes in the movement variables were examined using a series of linear mixed models (LMM). Match period was treated as a repeated measure with competition phase and playing season included as fixed effects. Referee and a referee, match period interaction were treated as random effects. The covariance structure for each model was determined according to the Akaike Information Criterion. For relative distance and distance in each movement category a compound symmetry heterogenous structure was fitted. An unstructured covariance structure was fitted for peak running speed. After determination of the appropriate covariance structure, normality assumptions of the residuals were examined using plots of the model residuals and the predicted values. Where the assumptions were violated, the dependant variable was log transformed. Significant main effects and interactions were probed using Bonferroni adjusted contrasts. Estimates of effect size (ES) were determined according to Westfall et al. (Citation2014) which provides an estimate analogous to Cohen’s d. This approach is recommended for LMM designs (Brysbaert and Stevens Citation2018). The significance level was set at α ≤ 0.05 for all tests.
Results
The mean game duration was 78.0 ± 2.3 min during which the referees covered a relative distance of 122.6 ± 8.4 m·min−1. During the full game GFR completed 2.1 ± 0.4 m·min−1 of VLSM, 26.1 ± 3.3 m·min−1 of walking, 36.8 ± 4.9 m·min−1 of LSR, 44.5 ± 6.6 m·min−1 of MSR, 12.8 ± 4.7 m·min−1 of HSR and 0.3 ± 0.5 m·min−1 of VHSR. The peak running speed was 6.75 ± 0.49 m·s−1.
The duration of the first and second half was 37.7 ± 1.3 and 40.3 ± 1.8 min (P <0.001, ES = 1.92), respectively. The relative distance during the first and second halves was 126.8 ± 8.8 and 118.8 ± 9.6 m·min−1 (P <0.001, ES = 0.60), respectively. The relative distance covered in each movement category during the first and second half is presented in . The relative distance involving VLSM and walking was lower (P <0.001, ES = 0.06–0.23) in the first half than the second half, while the relative distance in the LSR, MSR and HSR categories was higher (P <0.001, ES = 0.14–0.50) in the first half than the second half. There was no difference in peak running speed (P = 0.388, ES = 0.07) between the first half (6.54 ± 0.49 m·s−1) and second half (6.61 ± 0.48 m·s−1).
Table 1. Relative distance in each movement category during the first and second half of match play.
The relative distance was significantly different across the quarters of match play. A greater relative distance was covered during the first quarter (132.8 ± 10.9 m·min−1) than the second (121.9 ± 11.6 m·min−1, P <0.001, ES = 0.82), third (120.2 ± 12.5 m·min−1, P <0.001, ES = 0.91) and fourth quarters (118.1 ± 13.3 m·min−1, P <0.001, ES = 1.12), respectively (). The relative distance in the second quarter was also higher than in the fourth quarter (P = 0.002, ES = 0.30). The relative distance in each movement category during each quarter and between the four quarters is presented in . The ES for the relative distance in each movement category between the four quarters is presented in . No significant differences in the peak running speed were found between the first (6.32 ± 0.49 m·s−1), second (6.32 ± 0.50 m·s−1), third (6.29 ± 0.48 m·s−1) or fourth (6.35 ± 0.52 m·s−1) quarters of match play (ES = 0.01–0.12).
Table 2. Relative distance in each movement category across the four quarters of match play.
Figure 1. Relative distance (A) and the combined high and very high-speed running distance (B) across each quarter of match play. Data are presented as mean values with error bars representing SD and circles representing individual data points. HSR, high-speed running; VHSR, very high-speed running.
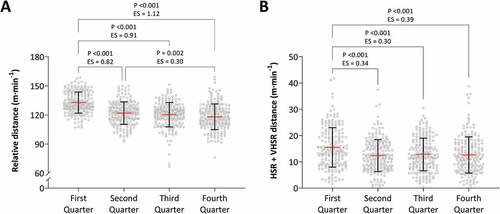
Figure 2. Effect size of the change in relative distance in each movement category from the (A) first to second, (B) first to third, (C) first to fourth, (D) second to third, (E) second to fourth and (F), third to fourth quarter of the AIC. Circles represent the ES, with the horizontal lines representing 95% confidence intervals. VLSM, very low-speed movement; LSR, low-speed running; MSR, moderate-speed running; HSR, high-speed running; VHSR, very high-speed running.
Discussion
Despite advances in player tracking technology and the growing number of studies examining the activity profile of players and referees of invasion field-based team sports, GFR have received little attention. The aim of this study was to examine the activity profile of elite GFR during the AIC and to examine temporal changes between halves and match quarters. With the exception of VHSR, the relative distance and the distance covered within each movement category was significantly different between the first and second half of match play, with less VLSM and walking distance and a greater LSR, MSR and HSR distance completed in the first half than the second half. There were also significant differences in the activity profile between quarters. The first quarter was the most intense period of the game, during which GFR covered a greater relative, MSR and HSR distance than any other match quarter. The relative distance in the walking and LSR category during the first quarter was also significantly lower than any other match quarter. This is the first study to provide detail on the temporal changes in the activity profile of elite GFR during AIC games.
The relative distance covered by elite GFR during AIC games is greater than reported for GF players (Malone et al. Citation2016). This is likely due to the fact that GFR are required to keep up with the play at all times, independent of game tempo whereas players have specific positional roles with brief and intense periods of movement followed by periods of low intensity activity (Malone et al. Citation2016; Gamble et al. Citation2019). The relative distance covered by elite GFR is also considerably larger than reported for both elite rugby league (O’Hara et al. Citation2013; Brightmore et al. Citation2016), and rugby union referees (Blair et al. Citation2018; Bester et al. Citation2019), and similar to elite soccer referees (Weston et al. Citation2012). In addition to the differences in pitch size, the large differences between rugby referees and GFR are likely due to the unique aspects of play in rugby league and rugby union which involve numerous collisions, ground contacts, scrummages and penalties that can limit the movement of the referee (O’Hara et al. Citation2013).
Similar to soccer and rugby referees, the majority of the total distance covered by GFR was at low and moderate speeds (Weston et al. Citation2012; O’Hara et al. Citation2013; Blair et al. Citation2018). The total HSR and VHSR distance covered equated to ~10% of the total distance, reflective of the intermittent nature of GF. Comparisons between other studies for the HSR and VHSR distances are difficult due to differences in data collection methodologies and movement category velocity thresholds. Unlike previous studies that have used arbitrary or player-based thresholds to evaluate the activity profile of soccer and rugby referees, the velocity thresholds used in the present study have been developed specifically for GFR and therefore provide greater internal validity (Brady et al. Citation2021).
In the present study there was a 6% difference in relative distance between halves and with the exception of VHSR, the distance covered within each movement category was also different. Similar differences have been reported for elite GF players (Malone et al. Citation2016) and elite soccer referees (Weston et al. Citation2007; Di Salvo et al. Citation2011). The second half of AIC games was longer than the first half which was likely caused by the increased number of stoppages due to injuries (Murphy et al. Citation2012) and substitutions that typically occur during the latter part of invasion field-based team sports and may have contributed to the reduction in match running performance (Linke et al. Citation2018).
Reductions in the activity of the referee, in particular, a decrease in high speed activities between match periods have previously been used to identify the onset of fatigue during invasion field-based team sports (Krustrup and Bangsbo Citation2001). Although the HSR distance of elite GFR was lower in the second half than the first, no differences were found between the second, third and fourth quarters. In addition to the increased number of stoppages in the second half, the reduction in HSR distance may partly be explained by the intense first quarter during which elite GFR covered a greater total, MSR and HSR and less walking distance than in any other quarter. A similar pattern has been reported for referees of other invasion field-based team sports (D’Ottavio and Castagna Citation2001; Blair et al. Citation2018). The first period of games is often the most intense in invasion field-based team sports as players try to impose themselves both individually and collectively on the opposition (Bangsbo et al. Citation1991).
The total distance and high-speed activity of elite soccer referees is directly related to that of the players, which is in turn influenced by the technical and tactical approach of their respective team (Rampinini et al. Citation2007; Weston et al. Citation2011). Examinations of the temporal changes in activity profile of elite GF players during match play found a time-dependant reduction in total, HSR and sprint distance with a greater HSR distance in the first quarter than any other quarter (Malone et al. Citation2017). The similarities of the activity of elite GFR with the players, coupled with the absence of a reduction in HSR between the second, third and fourth quarter make it difficult to discern the extent to which elite GFR experience fatigue during match play.
It has been speculated that invasion field-based team sport referees employ a ‘pacing strategy’ in order to maintain the necessary running performance in the latter stages of a game (Weston et al. Citation2012). However, given the unpredictable nature of match play in GF it is unclear to what extent the referee can choose to pace their activities. When making comparisons between the activity profile of GF players and referees, it is important to consider that unlike referees, players experience considerable physical contact that may increase physical fatigue and contribute to the differences in activity profile (Gamble et al. Citation2019).
Unlike players who can be substituted in response to a significant decline in their physical performance, GFR must be able to maintain the required activity levels and intensities for the duration of the game. This requires that they possess the necessary fitness levels to keep up with play, irrespective of the game tempo or period. A limitation of the present study is the absence of contextual factors such as the points difference, weather conditions or size of stadium, which may influence the activity of the referee. Future studies should examine the activity profile of elite GFR alongside contextual factors as well as examining the accuracy and proximity of decisions throughout competitive games.
Practical Applications
This study is the first to provide a detailed analysis of the activity profile of elite GFR during halves and quarters of AIC games. The improved understanding of the activity profile of elite GFR during match play will assist coaches in the design of appropriate training programmes and conditioning drills that are in line with the principles of training to promote the necessary physical development. Since the games analysed in the present study are the highest standard in GF, this information will also provide referees at the sub-elite and developmental levels with an insight into the requirements of elite refereeing. Examination of the temporal changes during match play identified the first quarter as the most intense period of the game. Coaches working with elite GFR should therefore ensure that all referees are suitably familiar and proficient in the performance of a warm-up routine prior to the start of match play. Training of elite GFR has traditionally involved continuous running at low and moderate intensities. The findings in the present study demonstrate that training programmes should include sessions involving HSR bouts (>4.87 m·s−1) interspersed with low-intensity running periods in conjunction with low-intensity, continuous running sessions. Training programmes should also involve running bouts which exceed those reported during match play to ensure optimal physical development and reduce the risk of injury.
Conclusion
The present study examines in detail the activity profile of elite GFR during competitive match play in the AIC across four competitive seasons. The activity profile of elite GFR was similar to elite GF players with the majority of the total distance covered at low speeds. Reductions in the relative and HSR distance were found from the first to the second half, likely caused by the increased number of stoppages in the second half and the intense first quarter, during which the relative and HSR distance were higher than any other period with no differences in HSR, VHSR or peak running speed found between the second, third and fourth quarters. This information will provide a framework for coaches to design training programmes specific to elite GFR to ensure optimal physical development.
Acknowledgements
The authors wish to thank the Gaelic Athletic Association national match officials for their participation throughout this project.
Disclosure statement
No potential conflict of interest was reported by the author(s).
Additional information
Funding
References
- Bangsbo J, Nørregaard L, Thorsø F. 1991. Activity profile of competition soccer. Can J of Sport Science. 16(2):110–116.
- Beato M, Coratella G, Stiff A, Iacono AD. 2018a. The validity and between-unit variability of GNSS Units (STATSports Apex 10 and 18 Hz) for measuring distance and peak speed in team sports. Front Physiol. 9:1288. doi:10.3389/fphys.2018.01288
- Beato M, Devereux G, Stiff A. 2018b. validity and reliability of global positioning system units (STATSports Viper) for measuring distance and peak speed in sports. J of Strength and Con Res. 32(10):2831–2837. doi:10.1519/JSC.0000000000002778.
- Bester C, Coetzee D, Schall R, Blair M. 2019. Physical demands on elite lead rugby union referees. Int J of Perform Anal in Sport. 19(2):258–273. doi:10.1080/24748668.2019.1593097.
- Blair MR, Elsworthy N, Rehrer NJ, Button C, Gill ND. 2018. Physical and physiological demands of elite rugby union officials. Int J Sports Physiol Perform. 13(9):1199–1207. doi:10.1123/ijspp.2017-0849.
- Brady AJ, Scriney M, Moyna NM, McCarren A. 2021. Identification of movement categories and associated velocity thresholds for elite Gaelic football and hurling referees. Int J of Perform Anal in Sport. doi:10.1080/24748668.2021.1942659
- Brightmore A, O’Hara J, Till K, Cobley S, Hubka T, Emmonds S, Cooke C. 2016. Movement and Physiological Demands of Australasian national rugby league referees. Int J Sports Physiol Perform. 11(8):1080–1087. doi:10.1123/ijspp.2015-0415.
- Brysbaert M, Stevens M. 2018. Power analysis and effect size in mixed effects models: a tutorial. J of Cognit. 1(1):1–20. doi:10.5334/joc.10.
- Cullen BD, Roantree MT, McCarren AL, Kelly DT, O’Connor PL, Hughes SM, Daly PG, Moyna NM. 2017. Physiological profile and activity pattern of minor Gaelic football players. J of Strength and Con Res. 31(7):1811–1820. doi:10.1519/JSC.0000000000001667.
- D’Ottavio S, Castagna C. 2001. Analysis of match activities in elite soccer referees during actual match play. J of Strength and Con Res. 15(2):167–171. doi:10.1519/00124278-200105000-00003.
- Di Salvo V, Carmont MR, Maffulli N. 2011. Football officials activities during matches: a comparison of activity of referees and linesmen in European, premiership and championship matches. Muscles Ligaments and Tendons J. 1(3):106–111.
- Gamble D, Spencer M, McCarren A, Moyna N. 2019. Activity profile, playerLoadTM and heart rate response of Gaelic football players: a pilot study. J of Hum Sport and Exercise. 14(4):711–724. doi:10.14198/jhse.2019.144.01.
- Kelly DT, Cregg CJ, O’Connor PL, Cullen BD, Moyna NM. 2021. Physiological and performance responses of sprint interval training and endurance training in Gaelic football players. Eur J Appl Physiol. doi:10.1007/s00421-021-04699-0
- Krustrup P, Bangsbo J. 2001. Physiological demands of top-class soccer refereeing in relation to physical capacity: effect of intense intermittent exercise training. J Sports Sci. 19(11):881–891. doi:10.1080/026404101753113831.
- Krustrup P, Helsen W, Randers MB, Christensen JF, MacDonald C, Rebelo AN, Bangsbo J. 2009. Activity profile and physical demands of football referees and assistant referees in international games. J Sports Sci. 27(11):1167–1176. doi:10.1080/02640410903220310.
- Linke D, Link D, Weber H, Lames M. 2018. Decline in match running performance in football is affected by an increase in game interruptions. J Sports Sci Med. 17:662–667.
- Mallo J, Frutos PG, Juárez D, Navarro E. 2012. Effect of positioning on the accuracy of decision making of association football top-class referees and assistant referees during competitive matches. J Sports Sci. 30(13):1437–1445. doi:10.1080/02640414.2012.711485.
- Malone JJ, Lovell R, Varley MC, Coutts AJ. 2017. Unpacking the black box: applications and considerations for using GPS devices in sport. Int J Sports Physiol Perform. 12(2):18–26. doi:10.1123/ijspp.2016-0236.
- Malone S, Solan B, Collins K. 2017. The running performance profile of elite Gaelic football match-play. J of Strength and Con Res. 31(1):30–36. doi:10.1519/JSC.0000000000001477.
- Malone S, Solan B, Collins KD, Doran DA. 2016. Positional match running performance in elite Gaelic football. J of Strength and Con Res. 30(8):2292–2298. doi:10.1519/JSC.0000000000001309.
- Mangan S, Ryan M, Shovlin A, McGahan J, Malone S, O’Neill C, Burns C, Collins K. 2019. Seasonal changes in Gaelic football match-play running performance. J of Strength and Con Res. 33(6):1685–1691. doi:10.1519/JSC.0000000000002269.
- Murphy JC, O’Malley E, Gissane C, Blake C. 2012. Incidence of Injury in Gaelic Football: a 4-Year Prospective Study. Am J Sports Med. 40(9):2113–2120. doi:10.1177/0363546512455315.
- O’Hara J, Brightmore A, Till K, Mitchell I, Cummings S, Cooke C. 2013. Evaluation of movement and physiological demands of rugby league referees using global positioning systems tracking. Int J Sports Med. 34(9):825–831. doi:10.1055/s-0033-1333694.
- Park LAF, Scott D, Lovell R. 2019. Velocity zone classification in elite women’s football: where do we draw the lines? Sci and Med in Football. 3(1):21–28. doi:10.1080/24733938.2018.1517947.
- Rampinini E, Coutts A, Castagna C, Sassi R, Impellizzeri F. 2007. Variation in top level soccer match performance. Int J Sports Med. 28(12):1018–1024. doi:10.1055/s-2007-965158.
- Scott MTU, Scott TJ, Kelly VG. 2016. The validity and reliability of global positioning systems in team sport: a brief review. J of Strength and Con Res. 30(5):1470–1490. doi:10.1519/JSC.0000000000001221.
- Westfall J, Kenny DA, Judd CM. 2014. Statistical power and optimal design in experiments in which samples of participants respond to samples of stimuli. J Exp Psychol Gen. 143(5):2020–2045. doi:10.1037/xge0000014.
- Weston M, Castagna C, Impellizzeri FM, Bizzini M, Williams AM, Gregson W. 2012. Science and medicine applied to soccer refereeing: an update. Sports Med. 42(7):615–631. doi:10.2165/11632360-000000000-00000.
- Weston M, Castagna C, Impellizzeri FM, Rampinini E, Abt G. 2007. Analysis of physical match performance in English premier league soccer referees with particular reference to first half and player work rates. J of Sci and Med in Sport. 10(6):390–397. doi:10.1016/j.jsams.2006.09.001.
- Weston M, Drust B, Gregson W. 2011. Intensities of exercise during match-play in FA premier league referees and players. J Sports Sci. 29(5):527–532. doi:10.1080/02640414.2010.543914.