
ABSTRACT
Objective
Quantifying differences in locomotor characteristics of training between two competition levels and between training days within elite female soccer players.
Methods
Foot-mounted inertial measurement unit (Playermaker) data were collected from 293 players from three Women’s Super League (WSL; n = 76) and eight Women’s Championship (WC; n = 217) teams over a 28-week period. Data were analysed using partial least squares correlation analysis to identify relative variable importance and linear mixed effects models to identify magnitude of effects.
Results
WSL players performed more high-speed running distance (HSR; >5.29 m∙s−1), sprint distance (SpD; >6.26 m∙s−1), acceleration (ACC; >3 m∙s−2) and deceleration (DEC; <-3 m∙s−2) distance than WC players. The largest difference between WSL and WC in HSR and HSR per minute occurred on MD-4, (354.7 vs. 190.29 m and 2.8 vs. 1.7 m∙min−1). On MD-2, WSL players also covered greater SpD (44.66 vs. 12.42 m), SpD per minute (0.38 vs. 0.11 m∙min−1) and HSR per minute (1.67 vs. 0.93 m∙min−1). Between training days both WSL and WC teams reduced HSR and SpD but not ACC and DEC distance from MD-4 to MD-2, with MD-4 the highest training day of the week.
Conclusion
MD-4 is a key training day discriminating between competitive level. HSR and SpD volume and intensity is tapered in WSL and WC players, however there is less clear taper of ACC or DEC. As such, WC teams could increase the volume and intensity of HSR on MD-4 to mimic locomotor activities of those at a higher standard.
Introduction
In female soccer, managing the overall training process is a key consideration for practitioners to balance the progression of positive performance outcomes (e.g. physiological adaptations) whilst managing the negative outcomes of training (e.g. functional and non-functional overreaching) (Jeffries et al. Citation2020). These outcomes are a result of psycho-physiological and biomechanical responses by players from the frequency, intensity, and duration of the activities they complete as a result of the training prescribed by practitioners (Jeffries et al. Citation2020).
To manage the outcomes of the training process, practitioners plan and manipulate training prescription across acute (i.e., within- and between-micro-cycles) and chronic (i.e., meso- and macro-cycles) periods of time. Training days within micro-cycles in soccer are referenced using a match day minus (MD-) format to characterise the amount of time between the training session and match day (Malone et al. Citation2015; Akenhead et al. Citation2016). In male soccer, higher locomotor intensity and volume (e.g., high-speed running [HSR]) is often prescribed within the middle of the micro-cycle to allow negative acute training effects (e.g., decrements in neuromuscular function) to reduce prior to competition (Malone et al. Citation2015; Akenhead et al. Citation2016; Owen et al. Citation2017). However, despite the increasing professionalism of female soccer, there is limited research quantifying the training periodisation strategies of female players. This is important to consider due to differences in physiological status, fitness, resources, training background, and playing style (Bradley et al. Citation2014; Baumgart et al. Citation2018; Emmonds et al. Citation2019; Haugen et al. Citation2020) and so further research is required.
Given the varied training modalities that soccer players are prescribed (e.g., small-sided games [SSG], technical-tactical, position specific, conditioning drills), it is important that different variables are captured to reflect the frequency, intensity, and duration of locomotor activities completed by players (Coutts et al. Citation2018; Impellizzeri et al. Citation2019). Monitoring external intensity and volume variables can indirectly indicate player fatigue status (Halson Citation2014), allowing practitioners to adapt the training process (Jeffries et al. Citation2020). Commonly used variables include total distance (TD), high-speed running (HSR), sprint distance (SpD), high magnitude acceleration (ACC), and deceleration (DEC) distances (Akenhead and Nassis Citation2016; Griffin et al. Citation2020). Locomotor characteristics are typically assessed using global positioning systems (GPS) (Akenhead and Nassis Citation2016). Alternative measurement methods such as foot-mounted inertial measurement units (IMU) track the same velocity-based metrics but adopt a different technological approach (Van Der Kruk and Reijne Citation2018; Waldron et al. Citation2021). However, in addition to the difficulty in conducting research in elite cohorts, the many different tracking technologies, data processing, and filtering techniques used by clubs within the same leagues make any comparison between teams unreliable (Buchheit and Simpson Citation2017). As such, there is a need for multi-club research to be conducted using the same tracking system to collect locomotor data to allow meaningful comparisons between teams and competitive levels.
Understanding differences between competition with regard to training prescription is important, given the aim to optimise the physical development of players to progress to higher competitive levels. In particular, the top tier in England (Women’s Super League [WSL]) is a professional league, whereas in the second tier (Women’s Championship [WC]) there is a mix of professional and semi-professional teams. As such, the frequency of training and available resources (i.e., full time/part time, number of training opportunities, number of support staff, pitch availability) may influence training prescription between competitive levels. Previous research comparing competitive levels in female soccer is limited to international versus domestic (Andersson et al., Citation2010; Mohr et al. Citation2008; Scott et al. Citation2020) or international age group comparisons (Ramos et al. Citation2019) during match play. To our knowledge, no research has compared the training characteristics between domestic top tier and second tier female soccer players. Knowledge of the differences between competitive levels will inform player development for team and individual progression and can help to direct specific locomotor training requirements as needed. Therefore, the aim of the study was to identify the locomotor characteristic variables (external intensity and volume) that best discriminated between competitive levels for each different training day. A secondary aim was to identify the differences for these variables between micro-cycle days within competition levels to understand micro-cycle periodisation strategies.
Methods
Participants
Two hundred and ninety-three female soccer players from three Women’s Super League (WSL; n = 76 players) and eight Women’s Championship (WC; n = 217) teams in England with a mean height and mass of (WSL:167.17 ± 5.59 cm, 63.04 ± 6.74 kg; WC: 167.18 ± 5.67 cm, 63.33 ± 6.95 kg), respectively, participated in this study. Maximal sprint speed (WSL: 6.91 ± 0.41 m∙s−1, WC: 6.86 ± 0.46 m∙s−1) and maximal aerobic speed (WSL: 3.48 ± 0.19 m∙s−1, WC: 3.61 ± 0.34 m∙s−1) were measured during 40 metre sprints and 1200 metre time trials for a sample of players in the current study (n = 141). The players consisted of goalkeepers (GK; WSL = 9, WC = 20), wide defenders (WD; WSL = 13, WC = 41), central defenders (CD; WSL = 14, WC = 31), central defensive midfielders (CDM; WSL = 11, WC = 32), central attacking midfielders (CAM; WSL = 8, WC = 29), wide midfielders (WM; WSL = 10, WC = 33) and forwards (F; WSL = 11, WC = 31). This study was conducted according to the requirements of the Declaration of Helsinki and was approved by the university ethics committee of Leeds Beckett University (ref 73,543).
Study design
An observational study design was conducted in which training locomotor activity data were collected over a 28-week period during the 2020–2021 season (October 2020 to May 2021). For the purposes of the current study, data was collected in all pitch training sessions carried out by each team. This refers to training sessions in which both starting and non-starting players trained together. As such, several types of sessions were excluded from analysis, including individual player training and rehabilitation training (n = 15). This was an observational study design and training content was not influenced by the researchers. The average frequency of weekly pitch training sessions was 5 ± 0.93 in the WSL and 3 ± 0.78 in the WC ().
Figure 1. Outline of the weekly pitch training structure in the WSL and WC across the 20/21 season. Abbreviations: MD, match day; NP, no pitch training, NP/MD-, infrequent training. In WC, teams either completed a pitch training session on MD-3 or MD-2 during that week, as noted by NP/MD.
During each micro-cycle, training data were categorised by the amount of time between training and match-day (e.g., MD-4). Given the differences in training frequency between clubs and between fixtures, the number of observations varied for each training day. However, the predominant frequency of training days across WSL and WC was determined by first identifying the training day with the highest number of observations (MD-4; n = 1971) and determining which other training days fell within 50% of the 1971 observations. MD-4, MD-3, MD-2 and MD+2 were identified in this criteria, therefore analysis was only conducted on those days. As such, 997 observations on MD+1 and MD-1 were excluded from data analysis. Goalkeepers were excluded from data analysis (n = 764), due to known differences in locomotor match characteristics between goalkeepers and outfield players that would influence the MD-training data. This resulted in 6176 individual training observations.
Data collection
Locomotor characteristics during each pitch training session were monitored using foot-mounted IMUs (Playermaker, Tel Aviv, Israel). Each IMU incorporated a 16 g triaxial accelerometer and a 2000°∙sec−1 triaxial gyroscope (MPU-9150, InvenSense, California, USA). The 1000 Hz IMU microprocessor utilised zero-lag Butterworth and Kalman filters to transform raw accelerometer and gyroscope traces, via proprietary gait event detection algorithms (Waldron et al. Citation2021). The IMUs were housed in manufacturer supplied tightly fitting silicone straps. Each player was equipped with two IMUs (one for each foot), which were located below the lateral malleoli over the player’s boots. Previous research reported no significant differences in peak velocity measured by Playermaker IMU devices compared to three GPS systems (mean difference and 95% limits of agreement ranging from −0.09 ± 0.40 to 0.12 ± 0.41 [p > 0.05]), however differences in method (both technological and anatomical) lead to differences in time motion analysis data during intermittent team sport activity (p < 0.05) (Waldron et al. Citation2021). Nevertheless, these devices have been reported as having good inter-unit reliability (p > 0.05) for all time motion analysis variables (mean difference and 95% limits of agreement ranging from −3 ± 21 for acceleration count to distance covered [<1.5 m∙s−1] 1.22 ± 2.79 m) (Waldron et al. Citation2021), demonstrating reliability for measuring locomotor characteristics. Despite this, each player was allocated a specific set of IMUs to use throughout the season for practitioner ease.
All devices were activated via a Bluetooth connection to an iPad (Apple Inc., California) prior to each training session. Data was uploaded to the manufacturer’s cloud-based software (v.3.22.0.02) post-session by club practitioners. The start and end of each training session was identified and tagged prior to data extraction (including locomotor variables) from the manufacturer’s cloud-based software into Microsoft Excel 2016.
The following variables were selected for analysis: TD (m), average speed (m∙min−1), absolute and relative HSR (distance covered >5.29 m∙s−1) and SpD (distance covered >6.26 m∙s−1). ACC (>3.0 m∙s−2) and DEC (<-3.0 m∙s−2) were also selected. These variables are commonly measured in soccer training and match play (Akenhead and Nassis Citation2016; Griffin et al. Citation2020). The ACC and DEC thresholds in this study have been previously applied in an elite female soccer cohort (Doyle et al. Citation2021) and non-published observations of 40 m linear sprint peak acceleration data suggests an average peak acceleration across the current study cohort of 3.8 m∙s−2 (CitationDalton-Barron et al. yyyy).
Data analysis
Partial least squares correlation analysis (PLSCA) was used to identify the locomotor characteristics that possessed most relative importance to discriminate between standard of competition (WSL vs WC) for each training day type (MD-4, MD-3, MD-2, MD+2) as per previous methods (Weaving et al. Citation2019; Emmonds et al. Citation2020). This involved creating a baseline model with all locomotor characteristics included as predictors to establish the total singular value inertia, with a leave one out variable approach conducted to identify the change in inertia when each individual locomotor variable was omitted. The variables deemed to possess relative importance, by creating the largest decrease in singular value inertia compared to the baseline model, were determined by a visual break (i.e., the ‘elbow’) within the decrease in singular value inertia plot (Supplementary Figure 1). This was repeated for each training day type. For the variables deemed to possess relative importance, linear mixed effects models were then used to estimate the magnitude of difference between standard of competition (WC vs WSL) on each training day (MD-4, MD-3, MD-2, MD+2), and between each training day within a competitive level (MD-4, MD-3, MD-2, MD+2) using the lme4 package in R (version 4.1.0). Fixed effects were competitive level for each training day (MD-4, MD-3, MD-2, MD+2). Repeated measures were accounted for with random effects of player identity, team identity, and training session date. The data were visually inspected for normality using Q–Q plots. Data did not always follow an appropriate normal distribution. Therefore, to reduce error arising from non-uniform residuals, all outcome measures were log-transformed prior to linear mixed model analysis. To identify specific differences between competitive level and training day, Tukey’s pairwise comparisons were conducted. Statistical significance was set at p < 0.05. Cohen’s d effect size (ES) statistics were calculated to determine the magnitude of the between training day and between competitive-level differences for each of the previously described locomotor characteristics. ES was classified as trivial (<0.2), small (0.2–0.59), moderate (0.6–1.19), large (1.2–2.0), or very large (>2.0) (Batterham and Hopkins Citation2006).
Results
and 2 present the mean ± SD for the volume () and intensity () of training of elite women’s soccer by standard of competition (WSL vs. WC) and training day (MD+1, MD+2, MD-4, MD-3, MD-2, MD-1).
Table 1. Volume of locomotor characteristics for each training day across the top two domestic leagues in England.
Table 2. Locomotor intensity characteristics for each training day across the top two domestic leagues in England.
Standard of competition
Supplementary Figure 1 describes the relative variable importance to discriminate between competitive levels within a training day. reports the magnitude of difference (ES and 90% confidence interval) between competitive level within each training day.
Figure 2. Effect sizes of differences in estimated mean and significance of locomotor training characteristics across four training days, between competitive level; MD+2, MD-4, MD-3 and MD-2. Variables included were those identified as possessing relative importance in the PLSCAs for each training day. A positive effect size indicates WSL value was larger than WC. Abbreviations: HSR, high speed running; SpD, sprint distance; TD, total distance. *Significant difference (p < 0.05*, p < 0.01**).
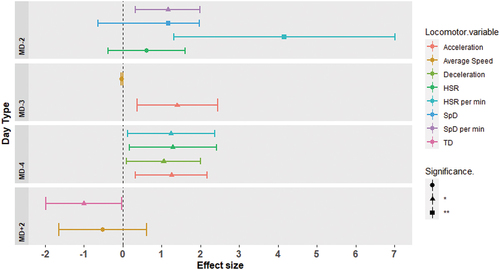
On MD+2, TD and average speed best explained differences between competitive levels, with WC players covering greater TD (ES = moderate) and average speed (ES = small). For MD-4, HSR distance, HSR per minute, ACC and DEC distance were identified as most relative important to discriminate between competitive levels. WSL players covered more ACC distance (ES = large), HSR per minute (ES = large) HSR distance (ES = large) and DEC distance (ES = moderate) than WC players. For MD-3, ACC and average speed were identified as most relative important. WSL players covered more ACC (ES = large), but completed lower average speed than WC players (ES = trivial) (). For MD-2, HSR distance, HSR per minute, SpD and SpD per minute were identified as most relative important. WSL players covered greater HSR per minute (ES = very large), SpD (ES = moderate) and SpD per minute (ES = moderate) than WC players.
Training day
highlights the magnitude of difference (ES and 90% confidence interval) between training days for WSL and WC.
Figure 3. Effect size of differences in estimated mean and significance of locomotor training characteristics between training days; MD-4 vs MD-3, MD-3 vs MD-2, MD-2 vs MD+2, MD+2 vs MD-4. A negative effect size indicates values of locomotor training characteristics decrease from the former training day to the subsequent training day. Abbreviations: MD, match day; WSL, women’s super league; WC, women’s championship; HSR, high speed running; SpD, sprint distance. *Significant difference (p < 0.05*, p < 0.01**, p < 0.001***).
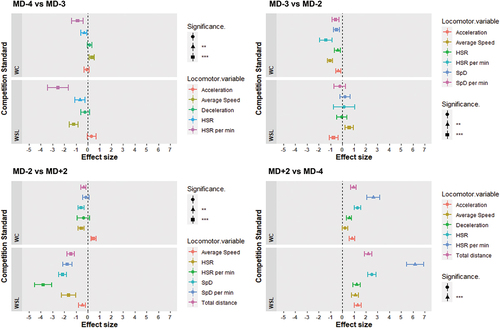
From MD+2 to MD-4 there were increases in ACC (WSL ES = large, WC ES = moderate) and DEC distance (WSL ES = large, WC ES = small) in both WSL and WC. From MD-4 to MD-3 decreases in HSR (WSL ES = moderate, WC ES = small), HSR per minute (WSL ES = very large, WC ES = moderate), ACC distance (WSL ES = small, WC ES = trivial), DEC distance (WSL ES = small, WC ES = trivial) were observed for both WSL and WC players (). Average speed decreased from MD-4 to MD-3 in WSL (ES = large) but increased in WC (ES = small).
From MD-3 to MD-2, there were further decreases in HSR (ES = small), HSR per minute (ES = large), SpD (ES = small), SpD per minute (ES = small) and average speed (ES = moderate) in WC players only (). There were no significant differences in these variables for WSL players except average speed, which increased (ES = small). ACC distance decreased from MD-3 to MD-2 in both WSL (ES = moderate) and WC (ES = small), respectively.
Discussion
The aim was to quantify the difference in locomotor characteristic variables that possessed most relative importance between standards of competition (WSL vs. WC) within training days and between training days in elite female soccer using a multi-club approach. PLSCA identified HSR, HSR per minute, SpD, SpD per minute, ACC and DEC distance, average speed and TD as possessing most relative importance to discriminate between competitive levels, with WSL players completing more than WC players in all variables (ES = 0.61 to 4.16) except average speed and TD (ES = −0.02 to −1). This suggests differences in training intensity and volume prescription between competitive levels, however the magnitude of difference in locomotor characteristics was training day specific.
A main finding of the current study was that the largest magnitudes of difference in external intensity (HSR per min) and volume (HSR distance, ACC, and DEC distance) between competitive levels occurred on MD-4 () with WSL greater than WC. This was despite MD-4 being the highest for these variables across training days in the micro-cycle for both competitive levels.
For WSL players (mean ± standard deviation: 355 ± 182 m), similar HSR volumes were reported in female Spanish division one players (383 ± 242 m) (Romero-Moraleda et al. Citation2021) and Irish female senior internationals (mean [range]: 388 [279 to 543] m) (Doyle et al. Citation2021). In addition, volume and intensity on MD-2 for WC players is similar to WSL MD-1 values, likely because MD-2 is often the last training session before MD for WC and is characterised by a heavy tactical focus. Therefore, if WC teams are aiming to mimic training characteristics of the higher competitive level, progressively increasing the volume and intensity of HSR covered on MD-4 is likely important. This could be achieved by manipulating drill constraints (e.g. increasing pitch dimensions) or increasing the volume or frequency of conditioning drills (Lacome et al. Citation2018; Beato et al. Citation2021). Furthermore, preliminary analysis of physical capacity in the current study cohort found similarities between competitive level, suggesting WC players may have the capacity to increase the intensity of training sessions. While some WC players are part-time this could affect how often they can train at higher intensities compared to full-time players. However, knowledge of the magnitude of HSR required to elicit a given magnitude of acute (e.g., neuromuscular) or chronic (e.g., fitness adaptation) training effects in female soccer players is currently lacking and further research is required. Future research should explore training interventions in female soccer to determine optimal training strategies for different competitive levels.
Across the micro-cycle there were significant increases in all variables except HSR from MD+2 to MD-4. As the micro-cycle progressed towards MD (MD-4 to MD-2) there was a clear reduction in HSR and SpD for both WSL (HSR: 354.7 to 193.52 m, SpD: 80.19 to 44.66 m) and WC (HSR: 190.29 to 105.08 m, SpD: 35.71 to 12.42 m) players. However, this was less evident for ACC and DEC volume with smaller magnitudes of reduction in these variables for both WSL (ES range = −0.74 to 0.31) and WC players (ES range = −0.53 to 0.14). Following the principles of tapering training load (Akenhead and Nassis Citation2016), the maintenance of intensity is apparent for WSL players from MD-3 to MD-2 (ES = trivial to small) but in WC players there are large reductions in HSR per minute (ES = large). A reduction in HSR volume across a micro-cycle agrees with a previous study in female players (Romero-Moraleda et al. Citation2021). It’s likely that the highest HSR and SpD activity occurs on MD-4 to maximise recovery time before MD. A lack of ACC and DEC taper contrasts with previous findings in an elite domestic female soccer cohort which reported accelerations were tapered from MD-4 to MD-2 (Romero-Moraleda et al. Citation2021). However, the authors reported acceleration count at a lower magnitude [>1 m∙s−2] making comparisons difficult. As match day approaches, there is likely a greater focus on technical and tactical activity completed in confined spaces potentially explaining the lack of taper in ACC and DEC (CitationEmmonds et al. xxx). Since technical-tactical drills are highly variable (Dellal et al. Citation2012; Hodgson et al. Citation2014; Younesi et al. Citation2021) this likely makes it harder to control acceleration and deceleration exposure. Consequently, this suggests a greater emphasis is needed by practitioners to plan and manipulate ACC and DEC across the micro-cycle in female soccer players.
Though this study provides new insights into the training characteristics between competitive levels in female soccer, potential limitations and directions for future research should be acknowledged. The ACC and DEC distances reported in this study were less than 1% of the total session distances, which is unlikely to be a great enough stimulus for biomechanical adaptation (Vanrenterghem et al. Citation2017). This suggests either the thresholds for high magnitude accelerations and decelerations may be too high in this female soccer cohort, or players aren’t exposed to enough ACC and DEC in training. Therefore, further research is required to determine standardised acceleration thresholds for elite female soccer players. Additionally, internal load measures were not used in the current study, as such it’s not clear whether there was any difference in internal load even though WC players performed less locomotor activity. Finally, although recommended in men’s soccer (Malone et al. Citation2015; Akenhead et al. Citation2016). It is not yet clear if MD-4 is the most effective day to prescribe the highest locomotor activity in female soccer players and still requires further research. There are physiological (e.g., ovarian hormone fluctuations (Bruinvels et al. Citation2017), muscle fatigue (Billaut and Bishop Citation2009; Hunter Citation2014)) and biomechanical differences (e.g., females are more force-oriented during sprinting (Haugen et al. Citation2020)) between females and males. Therefore, female players may respond differently to male players despite a similar distribution of training prescription across a micro-cycle. Consequently, further research is needed to determine the most effective training day to prescribe the highest HSR and SD during a training week in female soccer players.
Practical applications
For coaches and practitioners, this study provides reference values for different training days and competitive levels to evaluate training practices. Particularly, WC teams could prescribe increased HSR during the training week, specifically on MD-4 to mimic those within a higher standard. Drill design of coaches should be considered to increase the HSR and SpD within drills, or supplementary conditioning drills may be added. Both WSL and WC teams should consider prescribing dedicated ACC and DEC drills and manipulating technical-tactical drill constraints to increase the variability of ACC and DEC across a micro-cycle.
Conclusion
Overall, a greater taper of HSR and SpD volume and intensity in WSL and WC players was observed, with less clear taper of ACC or DEC for either competitive level. MD-4 is a key training day discriminating between competitive levels, with greater HSR intensity and volume covered by WSL players than WC players. As such, WC teams could increase the volume and intensity of HSR on MD-4 to mimic similar locomotor activities of those with a higher standard. Both WSL and WC teams should plan ACC and DEC volume across the micro-cycle to increase variability of high magnitude ACC and DEC exposure. The findings of this study provide new insights into the training practices across domestic competitive levels in female soccer.
Supplemental Material
Download MS Word (228.6 KB)Acknowledgements
The authors would like to thank all the women’s teams, coaches, and practitioners from the domestic leagues who took part in the study.
Disclosure statement
The third author of this study is employed by the company who provided the foot-mounted IMUs used to collect players’ locomotor activity data. Despite this, and to remove the potential for bias, the third author was not involved in any statistical analysis or data interpretation conducted during the investigation.
Supplementary material
Supplemental data for this article can be accessed online at https://doi.org/10.1080/24733938.2022.2114603
Additional information
Funding
References
- Akenhead R, Harley JA, Tweddle SP. 2016. Examining the external training load of an English premier league football team with special reference to acceleration. J. Strength Cond. Res. 30(9):2424–2432. doi:10.1519/JSC.0000000000001343.
- Akenhead R, Nassis GP. 2016. Training load and player monitoring in high-level football: current practice and perceptions. Int J Sports Physiol Perform. 11(5):587–593. doi:10.1123/ijspp.2015-0331.
- Andersson HÅ, Randers MB, Heiner-Møller A, Krustrup P, Mohr M. 2010. Elite female soccer players perform more high-intensity running when playing in international games compared with domestic league games. J. Strength Cond. Res 24(4):912–919. doi:10.1519/JSC.0b013e3181d09f21.
- Batterham AM, Hopkins WG. 2006. Making meaningful inferences about magnitudes. Int J Sports Physiol Perform. 1(1):50–57. doi:10.1123/ijspp.1.1.50.
- Baumgart C, Freiwald J, Hoppe M. 2018. Sprint mechanical properties of female and different aged male top-level German soccer players. Sports. 6(4):161. doi:10.3390/sports6040161.
- Beato M, Drust B, Iacono AD. 2021. Implementing high-speed running and sprinting training in professional soccer. Int J Sports Med. 42(4):295–299. doi:10.1055/a-1302-7968.
- Billaut F, Bishop D. 2009. Muscle fatigue in males and females during multiple-sprint exercise. Sports Med. 39(4):257–278. doi:10.2165/00007256-200939040-00001.
- Bradley PS, Dellal A, Mohr M, Castellano J, Wilkie A. 2014. Gender differences in match performance characteristics of soccer players competing in the UEFA Champions League. Hum Mov Sci. 33:159–171. doi:10.1016/j.humov.2013.07.024.
- Bruinvels G, Burden RJ, McGregor AJ, Ackerman KE, Dooley M, Richards T, et al. 2017. Sport, exercise and the menstrual cycle: where is the research? Br J Sports Med. 51(6):487–488. doi:10.1136/bjsports-2016-096279
- Buchheit M, Simpson BM. 2017. Player-tracking technology: half-full or half-empty glass? Int J Sports Physiol Perform. 12(s2):S2-35-S2–41. doi:10.1123/ijspp.2016-0499.
- Coutts AJ, Crowcroft S, Kempton T. 2018. Developing athlete monitoring systems: theoretical basis and practical applications. In: Kellman M, Beckman J, editors. Sports, recovery and performance: interdisciplinary insights. Abingdon (UK): Routledge; p. 19–32.
- Dalton-Barron N, Myhill N, Weaving D, King R, Emmonds S, Barrett S. Exploring mechanical demands within female football players: exploratory analysis of closed drill activities. Unpublished.
- Dellal A, Drust B, Lago-Penas C. 2012. Variation of activity demands in small-sided soccer games. Int J Sports Med. 33(5):370–375. doi:10.1055/s-0031-1295476.
- Doyle B, Browne D, Horan D. 2021. Quantification of internal and external training load during a training camp in senior international female footballers. Sci. Med. Football. 6(1):7–14.
- Emmonds S, Heyward O, Jones B. 2019. The challenge of applying and undertaking research in female sport. Sports Med Open. 5(1):51. doi:10.1186/s40798-019-0224-x.
- Emmonds S, Myhill N, Dalton-Barron N, King R, Barrett S, Weaving D. Physical and technical characteristics of female soccer players training: exploration of differences between competition standards. Unpublished.
- Emmonds S, Weaving D, Dalton-Barron N, Rennie G, Hunwicks R, Tee J, et al. 2020. Locomotor characteristics of the women’s inaugural super league competition and the rugby league world cup. J Sports Sci. 38(21):2454–2461. doi:10.1080/02640414.2020.1790815
- Griffin J, Larsen B, Horan S, Keogh J, Dodd K, Andreatta M, et al. 2020. Women’s football: an examination of factors that influence movement patterns. J. Strength Cond. Res 34(8):2384–2393. doi:10.1519/JSC.0000000000003638
- Halson SL. 2014. Monitoring Training Load to Understand Fatigue in Athletes. Sports Med. 44(S2):139–147. doi:10.1007/s40279-014-0253-z.
- Haugen TA, Breitschadel F, Seiler S. 2020. Sprint mechanical properties in soccer players according to playing standard, position, age and sex. J Sports Sci. 38(9):1070–1076. doi:10.1080/02640414.2020.1741955.
- Hodgson C, Akenhead R, Thomas K. 2014. Time-motion analysis of acceleration demands of 4v4 small-sided soccer games played on different pitch sizes. Hum Mov Sci. 33:25–32. doi:10.1016/j.humov.2013.12.002.
- Hunter SK. 2014. Sex differences in human fatigability: mechanisms and insight to physiological responses. Acta Physiologica. 210(4):768–789. doi:10.1111/apha.12234.
- Impellizzeri FM, Marcora SM, Coutts AJ. 2019. Internal and external training load: 15 years on. Int J Sports Physiol Perform. 14(2):270–273. doi:10.1123/ijspp.2018-0935.
- Jeffries A, Marcora S, Coutts AJ, Wallace L, McCall A, Impellizzeri FM. 2020. Development of a revised conceptual framework of physical training for measurement validation and other applications.
- Lacome M, Simpson BM, Cholley Y, Lambert P, Buchheit M. 2018. Small-sided games in elite soccer: does one size fit All? Int J Sports Physiol Perform. 13(5):568–576. doi:10.1123/ijspp.2017-0214.
- Malone JJ, Di Michele R, Morgans R, Burgess D, Morton JP, Drust B. 2015. Seasonal training-load quantification in elite English premier league soccer players. Int J Sports Physiol Perform. 10(4):489–497. doi:10.1123/ijspp.2014-0352.
- Mohr M, Krustrup P, Andersson H, Kirkendal D, Bangsbo J. 2008. Match activities of elite women soccer players at different performance levels. J. Strength Cond. Res 22(2):341–349. doi:10.1519/JSC.0b013e318165fef6.
- Owen AL, Lago-Peñas C, M-á G, Mendes B, Dellal A. 2017. Analysis of a training mesocycle and positional quantification in elite European soccer players. Int J Sports Sci Coach. 12(5):665–676. doi:10.1177/1747954117727851.
- Ramos G, Nakamura F, Penna E, Wilke C, Pereira L, Loturco I, Capelli L, Mahseredjian F, Silami-Garcia E, Coimbra CC, et al. 2019. Activity profiles in U17, U20, and senior women’s Brazilian national soccer teams during international competitions: are there meaningful differences? J Strength Cond Res. 33(12):3414–3422. doi:10.1519/JSC.0000000000002170
- Romero-Moraleda B, Nedergaard NJ, Morencos E, Casamichana D, Ramirez-Campillo R, Vanrenterghem J. 2021. External and internal loads during the competitive season in professional female soccer players according to their playing position: differences between training and competition. Res Sports Med RES SPORTS MED. 1–13.
- Scott D, Haigh J, Lovell R. 2020. Physical characteristics and match performances in women’s international versus domestic-level football players: a 2-year, league-wide study. Sci. Med. Football. 4(3):211–215. doi:10.1080/24733938.2020.1745265.
- Van Der Kruk E, Reijne MM. 2018. Accuracy of human motion capture systems for sport applications; state-of-the-art review. Eur J Sport Sci. 18(6):806–819. doi:10.1080/17461391.2018.1463397.
- Vanrenterghem J, Nedergaard NJ, Robinson MA, Drust B. 2017. Training load monitoring in team sports: a novel framework separating physiological and biomechanical load-adaptation pathways. Sports Med. 47(11):2135–2142. doi:10.1007/s40279-017-0714-2.
- Waldron M, Harding J, Barrett S, Gray A. 2021. A new foot-mounted inertial measurement system in soccer: reliability and comparison to global positioning systems for velocity measurements during team sport actions. J Hum Kinet. 77(1):37–50. doi:10.2478/hukin-2021-0010.
- Weaving D, Jones B, Ireton M, Whitehead S, Till K, Beggs CB. 2019. Overcoming the problem of multicollinearity in sports performance data: a novel application of partial least squares correlation analysis. PLOS ONE. 14(2):e0211776. doi:10.1371/journal.pone.0211776.
- Younesi S, Rabbani A, Clemente F, Sarmento H, Figueiredo A J. 2021. Session-to-session variations in external load measures during small-sided games in professional soccer players. Biol. Sport. 38(2):185–193. doi:10.5114/biolsport.2020.98449.