
ABSTRACT
The emergency department (ED) at Louisiana State University-Health Science Center in Shreveport (LSUHSC-S) serves an urban population with a large rural catchment area. This study focuses on demographic variables in substance abuse trends in this region based on urine drug screen (UDS) results. A database of de-identified UDSs ordered in the ED at LSUHSC-S between 1998 and 2011 was analyzed. Samples were tested for the presence of amphetamines, barbiturates, benzodiazepines, cannabinoids, cocaine, 3,4-methylenedioxymethamphetamine (MDMA), methadone, methamphetamine, opiates, phencyclidine, and propoxyphene. The patient population was categorized by age group, gender, and race. The majority of tests were performed on African-American and Caucasian patients aged 18–54 followed by the 0–11-year-old group. Of the drugs tested, cannabinoids represented the highest percentage of positive results in both the African-American and Caucasian populations. Opiates returned the highest percent of positive results among all prescription drugs. The Caucasian population predominated in positive tests for prescription drugs (opiates and benzodiazepines), while the African-American population predominated in results positive for illicit drugs (cannabinoids and cocaine). The increasing presence of opiates and cannabinoids, particularly in very young patients, should prompt policy-makers and health care providers to develop intervention strategies to protect the most vulnerable populations.
Background
The emergency department (ED) is a common portal of entry into the health care system for people with a wide variety of medical conditions. This pathway is especially true for lower income patients. According to a recent national study, the rate of ED visits is increasing steadily [Citation1]. From 1997 to 2007, the rate of ED visits increased from 353 to 391 per 1000 persons, which is almost double of what would be expected from population growth [Citation2]. The increase was mostly due to ED visits by adults with Medicaid coverage [Citation2]. Also, between 2006 and 2011, the number of ED visits for substance use disorders (not including alcohol abuse) increased 48%, one of the largest increases in the number of ED visits during that period [Citation1]. In 2010, the National Institute of Drug Abuse (NIDA) found that about 52 million people reported their use of drugs for non-medical reasons at least once in their lifetime [Citation3]. Across all ages, marijuana remains the drug with the highest rate of use. Opioid pain relievers are now second, followed by cocaine [Citation3,Citation4].
Paulozzi and colleagues ranked Louisiana first in controlled substance prescribing rates among the eight states they studied (California, Delaware, Florida, Idaho, Louisiana, Maine, Ohio, and West Virginia) [Citation5]. Furthermore, the Centers for Disease Control and Prevention (CDC) recently reported that the State of Louisiana had one of the highest opioid-overdose-related death rates in 2007 [Citation6]. Despite the apparent widespread drug use, we know little about substance abuse patterns among residents in our service area. Using data collected by the Louisiana State University Health Science Center in Shreveport (LSUHSC-S) ED from 14 August 1998 to 7 June 2011, we conducted a trend analysis to determine the demographics and risk factors associated with positive urine drug screens (UDSs).
The ED at LSUHSC-S serves an urban population with a large rural catchment area. It is a public hospital, teaching facility, and tertiary referral center. This is the first study focusing on demographic and substance abuse trends in ED patients in this service area.
Detection of substance use disorders among ED patients can serve as a first step in drug abuse intervention. Historically, most studies looking at drug use are based on subjective survey information, which simply gives a snapshot of prevalence [Citation7]. Collection of objective data on drug use patterns from UDS results over a longer time frame gives an important insight into current drug use trends that can be applied toward drug abuse interventions as well as recommendations for drug screening in the future.
Methods
Database
We analyzed a database of de-identified UDSs ordered in emergent clinical settings at LSUHSC-S between 14 August 1998 and 7 June 2011. The dataset contained 110,677 drug screen records from a total of 71,312 patients, i.e. nearly 12% of all patients evaluated in the ED during this period. According to LSU Health's annual report, the annual number of ED visits is 58,000–60,000. The data collected include the UDS results, date of visit, as well as patient-specific data such as age, gender, and race. Race was self-reported. UDSs are performed routinely on patients presenting for trauma, psychiatric complaints, and other indications, as deemed appropriate by medical care providers. The reasons for the ED visits were not recorded in the database. The UDSs screened for the presence of amphetamines, barbiturates, benzodiazepines, cannabinoids, cocaine, MDMA, methadone, methamphetamine, opiates, phencyclidine, and propoxyphene using the immunoassay OPI Flex reagent cartridges (Siemens Healthcare Diagnostics, Inc., Newark, DE) in the Siemens Dimension Vista® System (Siemens Healthineers Medical Solutions USA, Inc., Newark, DE). The opiate UDSs are calibrated to morphine. However, this immunoassay cross-reacts with some prescription opioids, such as hydrocodone, hydromorphone, oxycodone, and oxymorphone. The benzodiazepine UDSs are calibrated to lormetazepam. Components of the UDS changed over time, as reflected in the results. The UDSs for amphetamines, benzodiazepines, cannabinoids, cocaine, opiates, and phencyclidine were performed from 1998 to 2011; those for MDMA and methadone from 2007 to 2011; those for methamphetamine and propoxyphene from 2002 to 2004 and 1998 to 2000, respectively; and those for barbiturates from 1998 to 2007. The database did not contain information regarding confirmation of positive results for UDSs by gas chromatography/mass spectrometry (GC/MS) or other chemical assay upon request of the physician.
Data analysis
We categorized the patient population by race/ethnicity, gender, and age. The race/ethnicity groups were African-American (AA), Caucasian (CC), Hispanic, Asian, and Native American. We categorized patients by age according to the National Survey on Drug Use and Health (NSDUH): children as 0–11 year, youth as 12–17 years, young adults as 18–25 years, and adults as 26 years and older [Citation8]. In addition, we defined patients 65 years old and older as “elderly,” according to the National Institute on Aging. To analyze the number of tests performed on patients in different age groups, we further categorized 26 years and older patients by age according to CDC reports: 26–34, 35–44, 45–54, 55–64, and ≥65 years [Citation5]. In the 0–11-year age group, we analyzed 9327 tests. In the 12–17-year age group, we analyzed 4769 tests. In the 18–25-year age group, we analyzed 20,904 tests. In the 26–64-year age group, we analyzed 72,117 tests. In the group 65 years of age and older, we analyzed 3420 tests. In our examination of trends in positive UDS results, we included analysis of the general population.
Results
Demographic characteristics
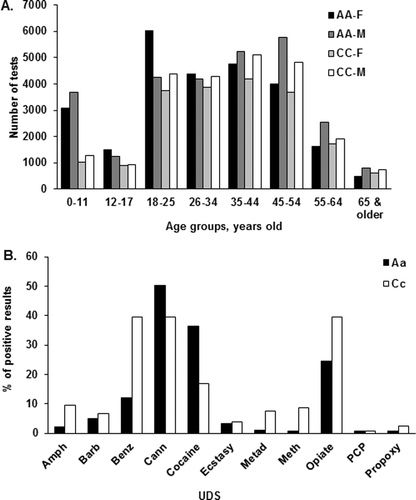
Among all patients tested between 1998 and 2011, 54% were African-American (AA), 44% were Caucasian (CC), 1.3% were Hispanic, 0.2% were Asian, and fewer than 0.1% were Native American. This distribution mirrors the demographic profile of the city of Shreveport in 2010: 54.7% AA, 41.2% CC, 2.5% Hispanic or Latino, 1.7% Asian, and 0.4% American-Indian and Alaskan-Native [Citation9]. Since AA and CC individuals represented the highest number of tested patients, we focused our study on those two groups. On an average, the annual number of tests performed for AA patients was slightly higher than for CC patients. However, the rate of annual increase in drug tests was higher for CC patients. The total number of CC patients tested increased almost three-fold, from about 2000 in 1999 to about 6000 in 2010. Over approximately the same period, the number of AA patients tested increased more than two-fold, from about 3000 in 1999 to about 6500 in 2010. Records for patients between the ages of 18 and 54 years represented the majority of tests, followed by children (0–11 years of age) and adults 55 years and older ((A)). On an average, the number of tests performed on AA patients was higher in all age groups, with the greatest discrepancy being in children 0–11 years old. Young AA women (18–25 years of age) represented the highest number of tests compared with all other age/race/gender groups ((A)), perhaps because of standard testing protocols for admission and of this group's frequent use of EDs during pregnancy and labor.
Figure 1. Demographic analysis and percentage of positive results of patients tested according to race, age, and gender. (A) Number of UDSs performed for African-American (AA) and Caucasian (CC) male (M) and female (F) patients in each age group. (B) Percentage of positive results in each race group. The UDSs for amphetamines, benzodiazepines, cannabinoids, cocaine, opiates, and phencyclidine were performed from 1998 to 2011; those for MDMA and methadone from 2007 to 2011; those for methamphetamine and propoxyphene from 2002 to 2004 and 1998 to 2000, respectively; and those for barbiturates from 1998 to 2007.
Drug screening results
The highest percentage of positive results for all drugs combined was in the CC group (52% of all tests performed for CC patients), followed by AA (42%), Native American (40%), Hispanic (31%), and Asian (28%) patients. Among all drugs tested, the highest percentages of positive results were obtained for cannabinoids, followed by opiates, cocaine, and benzodiazepines ((B)). In the CC population, percentages of positive tests for amphetamine, benzodiazepines, methadone, methamphetamine, and opiates were significantly higher each year compared with test results for AA patients. The percentages of positive results for cannabinoids and cocaine were significantly higher in the AA population than among CC patients ((B)).
We also analyzed the percentage of positive tests in different race/gender groups. CC females most often tested positive for benzodiazepines (42%), opiates (39%), and cannabinoids (36%). CC males most often tested positive for cannabinoids (42%), opiates (40%), and benzodiazepines (37%). AA females and males most commonly tested positive for cannabinoids (48% and 52%, respectively), cocaine (32% and 39%), and opiates (26% and 23%). The high percentage of patients testing positive for opiates is not surprising, since trauma patients are tested routinely and often receive opiates en route to the ED or during their ED stay. However, the findings that 36%–52% of patients tested positive for cannabinoids and almost every third AA patient in the dataset tested positive for cocaine reflect a dangerous trend of illicit drug abuse in our patient population.
Trends in positive UDS results
Opiates
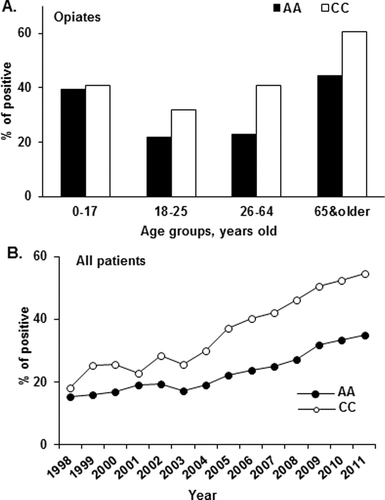
Among all age groups, the highest percentages of opiate-positive UDS results were detected in the 0–17 and ≥65 years age groups. The percentage of positive results for opiates was consistently higher in CC patients than in AA patients in all age groups ((A)). During the study period, the percentage of opiate-positive results increased steadily in both male and female patients. This observation correlates with the nationwide increase in prescription opiate and illicit opioid use at that time [Citation10]. However, the rate of increase was higher in the CC population (a 3-fold increase, from 18% to 55%) compared with the AA population (a 2.3-fold increase, from 15% to 35%) ((B)).
Figure 2. (A) Percentage of positive test results for opiates in each age bracket. (B) Percentage of positive tests for opiates in all AA and CC patients tested.
Benzodiazepines
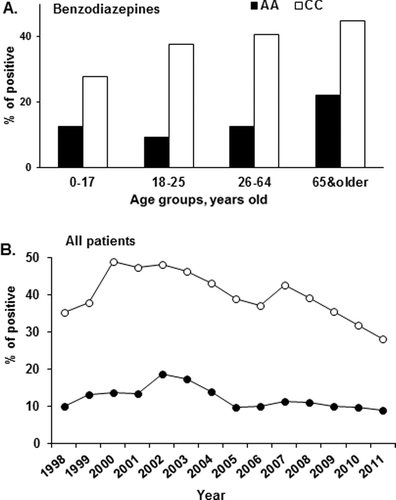
Among all age groups, the highest percentage of benzodiazepine-positive UDS results was detected in the 65-and-older age group. The percentage of positive results for benzodiazepines was consistently higher in CC patients than in AA patients in all age groups over the period of study ((A)). Since 2002, the percentage of benzodiazepine-positive UDSs has declined in both AA and CC populations, going from 19% to 9% and 48% to 28%, respectively ((B)).
Figure 3. (A) Percentage of positive test results for benzodiazepines in each age bracket. (B) Percentage of positive tests for benzodiazepines among all AA and CC patients tested.
Amphetamines
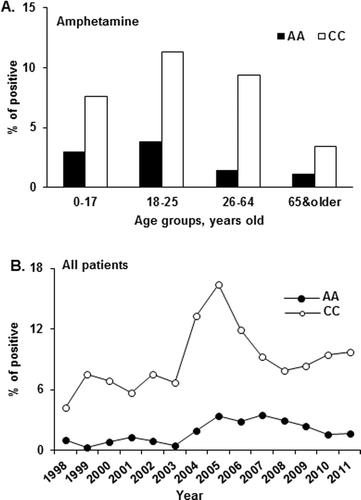
The illicit use of amphetamines, methamphetamine, and MDMA in the United States affects all ages, races, genders, and socioeconomic classes [Citation11]. In this study, among all age groups, the highest percentage of amphetamine-positive UDS results was detected in the 18–25-year age group. Similar to opiates and benzodiazepines, the percentage of positive results for amphetamines was consistently higher in CC patients than in AA patients in all age groups ((A)). Patients in the 18–25-year age group represented the highest percentage of positive results for amphetamines ((A)). In all age groups, CC males and females showed the highest percentage of positive results for amphetamines. Tests performed in 2004 demonstrated a sharp increase in amphetamine-positive results, especially in CC patients ((B)). However, since 2005, the percentage of positive results for amphetamines declined almost two-fold in both the CC and AA populations, from 16% to 10% in CC and from 3.4% to 1.7% in AA patients ((B)).
Figure 4. (A) Percentage of positive test results for amphetamines in each age bracket. (B) Percentage of positive tests for amphetamine among all AA and CC patients tested.
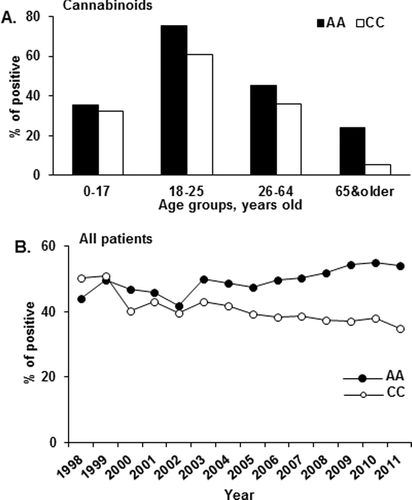
Cannabinoids
Among all age groups, the highest percentage of cannabinoid-positive UDS results was detected in the 18–25-year and 26–64-year age groups. The percentage of positive results for cannabinoids was consistently higher among AA patients than CC patients in all age groups ((A)). Cannabinoid-positive results peaked in the 18–25-year age group (75% AA and 61% CC) and then declined with advancing age ((A)). AA males showed the highest percentage of positive results for cannabinoids in all age groups. Between 1998 and 2011, the percentage of positive results for cannabinoids decreased slightly in the CC group, from 50% to 35% ((B)). However, in the AA group, the percentage of positive results for cannabinoids increased during the same period, from 44% to 54% ((B)).
Figure 5. (A) Percentage of positive test results for cannabinoids in each age bracket. (B) Percentage of positive tests for cannabinoids among all AA and CC patients tested.
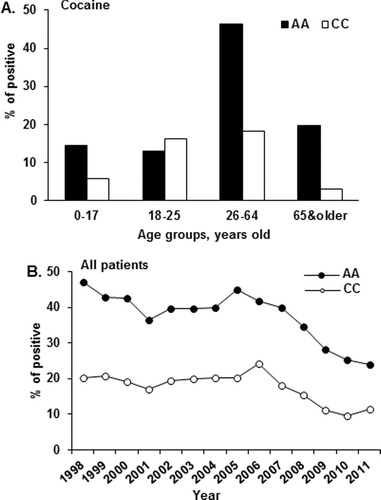
Cocaine
Among all age groups, the highest percentage of cocaine-positive UDS results was detected in the 26–64-years group. The percentage of positive results for cocaine metabolites was higher among AA patients than CC patients in most age groups ((A)) (in the 18–25-year group, the percentage of positive tests in the CC group was higher than in the AA group). Cocaine-positive results peaked in the 26–64-year-old group and then declined in the elderly group. The highest percentage of positive results for cocaine was detected in patients aged 26–64 years for both races ((A)). In the senior group (≥65 years), the percentage of positive results for cocaine declined among females and CC males but remained high in the AA male group. From 1998 to 2006, the percentage of positive results for cocaine stayed the same at about 40% in the AA population and about 20% in the CC population ((B)). Then, from 2005 to 2006, the percentage of positive results for cocaine began to decline and dropped almost two-fold among AA and CC patients ((B)).
Figure 6. (A) Percentage of positive test results for cocaine in each age bracket. (B) Percentage of positive tests for cocaine among all AA and CC patients tested.
Discussion
The majority of drug tests performed in the LSUHSC-S ED between 1998 and 2011 were for AA and CC patients, at 54% and 44%, respectively. This result mirrors the demographic profile of the city of Shreveport in 2010: 54.7% AA and 41.2% CC [Citation9]. By comparison, the nationwide analysis of ED visits that occurred between 1997 and 2007 indicated that more than 60% of patients were non-Hispanic/white and fewer than 25% were AA [Citation2].
The majority of UDSs performed at the LSUHSC-S ED were for patients between the ages of 18 and 54 years. This observation is similar to the nationwide study, which found that more than 40% of ED visitors were between the ages of 18 and 44 years [Citation2]. Our data suggest that a lower percentage of LSUHSC-S ED patients tested were seniors (≥65 years of age) compared with the national numbers (3% and 15%, respectively). Similarly, the percentages of children and teenagers younger than 18 years tested at the LSUHSC-S ED were lower than in the national survey (13% and 23%, respectively) [Citation1,Citation2]. This suggests that either the number of visitors in the “<18” and in “65 and older” age groups were lower or that the number of the tests performed for the patients in these age groups were lower compared to the national numbers.
Among all drugs tested at the LSUHSC-S ED between 1998 and 2011, the highest percentages of positive results were for cannabinoids, followed by opiates, cocaine, and benzodiazepines. These results correlate with other studies indicating the prevalence of these four drugs in the ED setting [Citation12]. However, the two- to three-fold increase in percentage of opiate-positive patients in the LSUHSC-S ED is alarming considering the addictive nature of opiates. Our results reflect a common trend nationwide and in the State of Louisiana, showing an increase in opiate prescriptions and abuse [Citation3,Citation13,Citation14]. The rate of increase in opiate-positive UDS results was much greater among CC patients than AA patients in all age groups, indicating racial disparity in opiate use. Some of the difference might be attributable to disparities in prescribing habits among physicians [Citation15].
The two age groups that were most likely to test positive for opiates were the extremes of age: 0–17 and ≥65 years of age. One can argue that the lower number of tests performed in these two age groups (14,096 tests in the younger group and 3420 tests in the older group) compared with young adults and adults (20,904 tests in 18–25-year olds and 72,117 tests in 26–64-year olds) could explain the higher percentage of opiate-positive results. However, with a similar number of tests as for opiates, the 0–17-year-old group and the 65-and-older group showed a lower number of positive results for amphetamine, cannabinoids, and cocaine compared with 18–25-year olds and 26–64-year olds, arguing against this suggestion. The high percentage of positive opiate UDS results in the 65-and-older group could be due to the increased likelihood of a chronic pain condition. The high percentage of children testing positive for opiates is alarming.
Benzodiazepines are another group of prescription drugs known to have high abuse potential. Our study shows that the percentage of positive UDS results for benzodiazepines increased with patient's age, especially in the CC group. The percentage of positive results for benzodiazepine in the CC group was two- to three-fold higher than in the AA group in all age groups, again indicating large racial disparity. Considering the medical uses for benzodiazepines include seizure, muscle spasms, anxiety, alcohol dependence, and agitation, there is no specific explanation for the race disparity. Interestingly, the percentage of positive UDS results for benzodiazepines started to decline from 2002 in both the AA and the CC groups. The overall downward trend in positive benzodiazepine testing may reflect more judicious use of benzodiazepines by prescribers.
We observed a high prevalence of CC patients with amphetamine-positive results in all age groups, indicating a large racial disparity. The screen for amphetamine does not differentiate between illicit drug use and prescription use to treat attention deficit disorder. Furthermore, considering the higher percentage of amphetamine-positive tests in the CC group over the AA group during all periods of study, it is possible that the difference could be at least partially attributed to disparities in prescribing habits among physicians. According to a recent study, the rate of amphetamine prescribing increased significantly from 1991 to 2010 [Citation3].
Our observation of a high prevalence of positive results for cannabinoids and cocaine correlates with nationwide and statewide trends in increased use of illicit drugs. The database maintained by the Substance Abuse and Mental Health Services Administration (SAMHSA), the National Household Survey on Drug Abuse, SAMHSA's Drug Abuse Warning Network (DAWN, which ended in 2011), and the National Institute of Justice Drug Use Forecasting (DUF) showed an increasing prevalence of marijuana use starting in 1992 [Citation16]. According to the National Survey on Drug Use and Health (NSDUH), 7.5% (19.8 million) of US citizens aged ≥12 years reported using marijuana during the preceding month [Citation17]. The CDC reported a similar trend for cocaine abuse, placing the drug as a leading cause of overdose-related deaths, second to opioids, in 2007 [Citation6]. Nationwide, cocaine led cannabinoids as the most common cause of ED visits from 2004 to 2011. However, the gap between cocaine-related and cannabinoid-related ED visits in the United States closed substantially during this period. The State of Louisiana had a similar trend, with cannabinoids and cocaine representing the highest percentages of treatment associated with drug abuse from 1992 to 2011 [Citation18]. The incidence of cannabinoid-positive UDS results in our study was consistently higher than the incidence of cocaine-positive tests, with AA patients (49% and 38%, respectively) having higher percentages than the CC group (41% and 18%, respectively), indicating another large racial disparity. The high percentage of patients in the 26–64-year age group testing positive for cannabinoids and cocaine in our study is in agreement with the SAMSHA report on the numbers of individuals dependent on illicit drugs in Louisiana between 2002 and 2006 [Citation19]. However, the high percentage of children in the 12–17-year age group at the LSUHSC-S ED testing positive for cannabinoids (more than 50%) is surprising considering that in 2003–2006, Louisiana was ranked among 10 states with the lowest rates in cannabinoid use (5.8%) [Citation19,Citation20].
This study has several limitations. The dataset contains information only about patients who underwent drug screening. The patient categories identified as most likely to receive UDSs include trauma, psychiatry, altered mental status, obstetric care, drug overdose, and other conditions as guided by physician judgment. The dataset does not contain information on the reason for the hospital visit, the reason for the screening, or the relationship, if any, between the visit and substance abuse. The dataset does not include information regarding confirmation of the UDSs results by GC/MS or other chemical assay. UDSs may yield false-positive and false-negative results and should always be interpreted as presumptive. Some positive results may represent the therapeutic use of medications prior to urine collection.
Conclusion
This study demonstrates that UDSs obtained from patients using a regional health care facility may be helpful in tracking drug use in that hospital's catchment region. Rates of positive drug screens tracked by age, race, and gender help identify the most at-risk segments of the population. With this information, we can follow trends in specific drug utilization in the community and develop drug-specific intervention strategies. In this database review, the CC population had a preponderance of the positive tests for prescription drugs (opiates and benzodiazepines) in all age groups for every year in the study, while the AA population predominated in illicit drug use (cannabinoids and cocaine). The increasing prevalence of positive tests for opioids and cannabinoids, particularly in our youngest patients, raises concerns and warrants close observation.
Acknowledgments
We thank Barry Dobbins for collecting the data and the Department of Pharmacology, Toxicology and Neuroscience and the Department of Emergency Medicine for supporting the data collection and analysis. Linda J. Kesselring, MS, ELS, copyedited the manuscript.
Disclosure statement
The authors declare that they have no competing interests. The authors alone are responsible for the content and writing of this article.
Additional information
Funding
Related Research Data
References
- Skinner H, Blanchard J, Elixhauser A. Trends in Emergency Department visits, 2006–2011. HCUP Statistical Brief #179; 2014 [ cited 2018 Apr 4]. Available from: http://www.hcup-us.ahrq.gov/reports/statbriefs/sb179-Emergency-Department-Trends.pdf
- Tang N, Stein J, Hsia RY, et al. Trends and characteristics of US emergency department visits, 1997–2007. JAMA. 2010;304(6):664–670.
- NIDA. Prescription drugs: abuse and addiction. In: Volkow ND, editor. NIDA research report series. U.S. Department of Health and Human Services, NIH; 2010. Available from: https://d14rmgtrwzf5a.cloudfront.net/sites/default/files/2609-misuse-of-prescription-drugs.pdf
- SAMHSA. 2016 National Survey on Drug Use and Health: detailed tables. Rockville (MD): Substance Abuse and Mental Health Services Administration; 2017 [ cited 2017 Nov 6]. Available from: https://www.samhsa.gov/data/sites/default/files/NSDUH-DetTabs-2016/NSDUH-DetTabs-2016.pdf
- Paulozzi LJ, Strickler GK, Kreiner PW, et al. Controlled substance prescribing patterns-prescription behavior surveillance system, eight states, 2013. MMWR Surveill Summ. 2015;64(9):1–14.
- CDC. Unintentional drug poisoning in the United States. 2010 [ cited 2018 Apr 4]. Available from: http://c.ymcdn.com/sites/www.productstewardship.us/resource/resmgr/imported/poison-issue-brief.pdf
- Hankin A, Daugherty M, Bethea A, et al. The emergency department as a prevention site: a demographic analysis of substance use among ED patients. Drug Alcohol Depend. 2013;130(1–3):230–233.
- NSDUH. Population data. [ cited 2018 Mar 23]. Available from: https://www.samhsa.gov/data/sites/default/files/NSDUHsaeSpecificStates2016A/NSDUHsaeSpecificStates2016.htm#tab047
- United States Census Bureau. 2010 Demographic profile data. Shreveport (LA) [ cited 2018 Mar 15]. Available from: https://factfinder.census.gov/faces/tableservices/jsf/pages/productview.xhtml?src=CF
- Centers for Disease Control and Prevention. Annual surveillance report of drug-related risks and outcomes — United States, 2017. Surveillance Special Report 1; 2017 [ cited 2018 Apr 4]. Available from: https://www.cdc.gov/drugoverdose/pdf/pubs/2017cdc-drug-surveillance-report.pdf
- SAMHSA. Results from the 2013 National Survey on Drug Use and Health: mental health findings. 2014. ( NSDUH Series H-49). HHS Publication No. (SMA) 14-4887. Rockville, MD: Substance Abuse and Mental Health Services Administration. [ cited 2018 Apr 4]. Available from: http://store.samhsa.gov/home
- Rockett IR, Putnam SL, Jia H, et al. Assessing substance abuse treatment need: a statewide hospital emergency department study. Ann Emerg Med. 2003;41(6):802–813.
- Manchikanti L, Helm S 2nd, Fellows B, et al. Opioid epidemic in the United States. Pain Physician. 2012;15(3 Suppl):ES9–ES38.
- SAMHSA. Population of Louisiana. Policy Academy State profile; 2012 [ cited 2012 Apr 2–3]. Available from: https://www.acl.gov/sites/default/files/programs/2016-11/Louisiana.pdf
- McDonald DC, Carlson K, Izrael D. Geographic variation in opioid prescribing in the U.S. J Pain. 2012;13(10):988–996.
- Rouse BA. Epidemiology of illicit and abused drugs in the general population, emergency department drug-related episodes, and arrestees. Clin Chem. 1996;42(8 Pt 2):1330–1336.
- Azofeifa A, Mattson ME, Schauer G, et al. National estimates of marijuana use and related indicators - National Survey on Drug Use and Health, United States, 2002–2014. MMWR Surveill Summ. 2016;65(11):1–28.
- Executive Office of the President of the United States. Louisiana drug control update. Drug use trends in Louisiana; 2011 [ cited 2018 Apr 4]. Available from: https://obamawhitehouse.archives.gov/sites/default/files/docs/state_profile-louisiana.pdf
- Wright D, Sathe N. State estimates of substance use from the 2003–2004 National Surveys on Drug Use and Health. Rockville (MD): Substance Abuse and Mental Health Services Administration, Office of Applied Studies; 2006. ( DHHS Publication No. SMA-06-4142, NSDUH Series H-29).
- Hughes A, Sathe N. State estimates of substance use from the 2005–2006 National Surveys on Drug Use and Health. Rockville (MD): Substance Abuse and Mental Health Services Administration, Office of Applied Studies; 2008. ( DHHS Publication No. SMA-08-4311, NSDUH Series H-33).