
Abstract
For most patients with an incomplete spinal cord injury, gait rehabilitation plays a key role in functional recovery. Gait is usually assessed by physiotherapists and rehabilitation physicians through observational analysis or by specialized personnel through laboratory gait analysis. However, observational analysis is prone to misjudgment, and laboratory analysis is complex and time-consuming. Inertial measurement units (IMUs) could be an interesting alternative to bring objective gait analysis closer to the actual healthcare providers. This article focuses on identifying the requirements of an IMU-based gait assessment interface for use in a clinical setting by rehabilitation physicians and physiotherapists. The design process consisted of four stages: (1) user research to identify physicians’ and physiotherapists’ needs and expectations, and the context wherein the system will be used; (2) analysing and interpreting user research results to collect insights and define the design vision; (3) conceptualization and evaluation of initial concepts for the layout of the gait assessment interface and visualization of the gait parameters; (4) developing and evaluating the initial design and prototype of the interface. Future research will need to be conducted to further develop the usability and functionality of the interface.
Subject classification codes:
Introduction and background
Spinal cord injuries
Injury to the spinal cord results in loss or impairment of motor and/or sensory function in the lower half of the body (paraplegia) or below the neck (tetraplegia). The severity of the spinal cord injury (SCI) largely determines functional capacity. The majority of people with preserved sensory and/or motor function in the lowest sacral segment (incomplete SCI) regain full or partial walking function (Kirshblum et al. Citation2011).
Gait analysis
Generally, persons with SCI are guided by a multidisciplinary team during their rehabilitation. Within this team, the physiotherapist’s role is to guide the patient in improving their physical functioning, including through gait rehabilitation for persons with incomplete SCI. The rehabilitation physician is responsible for developing the patient’s overall treatment plan and is involved in gait interventions, such as spasticity treatment and prescribing orthoses and orthopaedic shoes. The patient’s gait is regularly assessed throughout rehabilitation to evaluate progress, select interventions, and guide the therapy program. Gait assessment is based on observational gait analysis or laboratory gait analysis (Post et al. Citation2017).
In observational gait analysis, deficits, impairments, or abnormalities in the patient’s gait are assessed in real-time through visual inspection. However, due to limitations in visual perception and memory, clinicians may struggle to observe and grade all relevant features at one time (Jacinto and Silva Citation2018). For observational scales, such as the Edinburgh Visual Gait Score developed for children with cerebral palsy (Read et al. Citation2003), it was shown that the inter-rater reliability of assessors with less expertise in gait analysis is questionable (Ong, Hillman, and Robb Citation2008).
Laboratory gait analysis is time-consuming and usually performed by specialized personnel with complex and expensive equipment. Inertial measurement units (IMUs) could be an interesting alternative to lab-based systems and could be used to bring objective gait analysis closer to the actual healthcare providers (Celik et al. Citation2021). IMUs typically consist of a 3D gyroscope, accelerometer, and magnetometer and are placed on body segments. By combining data from multiple IMUs with an advanced biomechanical model, 3D kinematics can be captured, even in real-time (Paulich et al. Citation2018). Smart calibration allows relatively flexible placement of sensors on segments (Di Raimondo et al. Citation2022), making the application accessible to less specialized personnel. By applying additional algorithms, spatial and temporal parameters can be estimated from virtual marker positions. Because IMUs allow testing outside a laboratory, walking can be analysed in different environments and situations (Jarchi et al. Citation2018).
Although previous studies have shown that IMUs are valid and reliable for measuring kinematics and spatio-temporal parameters during gait (Kobsar et al. Citation2020), including for patients with abnormal gait patterns due to incomplete SCI (Werner et al. Citation2021), additional validation is desirable, especially with regard to spatio-temporal parameters.
Several articles have mentioned the potential benefits of applying IMUs in clinical practice (Bleser et al. Citation2017; Hendriks et al. Citation2022). However, large-scale implementation remains lacking. Currently available IMU software is not developed for use in a clinical setting (Routhier et al. Citation2020). Thus, the functionality of current IMU software may not meet the needs of physicians and physiotherapists in terms of data collection and presentation (Morris et al. Citation2019; Grimm and Bolink Citation2016).
Therefore, we initiated a user-centred study to identify requirements of a gait assessment interface, based on IMU-data collected in a clinical setting outside a gait lab, with the aim of providing physicians and physiotherapists with gait information for the most desired and clinically relevant gait metrics. Such a gait assessment interface would enable physicians and physiotherapists to perform their own (simple) objective gait analysis on their patients. They could use this information during consultations and therapy sessions, for example, to select and evaluate interventions. Given the potential benefits of IMUs for clinical gait analysis and the current availability of multi-sensor IMU systems, the starting point of the study was an IMU system capable of providing reliable 3D kinematics of the lower body (e.g. Xsens MTw Awinda IMUs combined with MVN Analyze software in a lower body with sternum setup; Xsens Technologies B.V., Enschede, The Netherlands) (“MTw Awinda” Citation2021).
Methods
Identifying requirements for a gait assessment user interface through user-centred design
The objectives of this paper are (1) to identify the requirements of an IMU-based mobile gait assessment user interface, intended to be used by rehabilitation physicians and physiotherapists in a clinical setting, and (2) to conceptualize and propose an initial interface design. The objectives were accomplished by incorporating the Double Diamond Model into the four primary stages of the project’s user-centred design process () (Melles, Albayrak, and Goossens Citation2021). These stages were: (1) user research to identify physicians’ and physiotherapists’ needs and expectations, and the context wherein the system will be used (Discover Phase); (2) analysing and interpreting user research results to collect insights and define the design vision (Define Phase); (3) conceptualization and assessment of initial concepts for the layout of the gait assessment interface and visualization of the gait parameters (Develop and Deliver Phases); (4) developing and evaluating the initial design and prototype of the interface (Develop and Deliver Phases).
Figure 1. The user-centred design process used to identify the requirements for an IMU-based gait assessment interface.
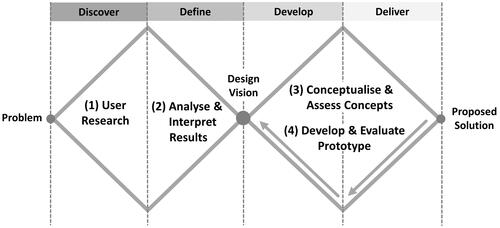
User-centred design was utilized in every stage of the design process to better understand and assess user needs and to adapt the design to these needs. By involving users throughout the whole design process, this approach allowed for a more usable and accessible product to be designed (Melles, Albayrak, and Goossens Citation2021).
It is not uncommon for a designer to receive an initial brief that already specifies the problem to be solved (Melles, Albayrak, and Goossens Citation2021). For this project, in the initial brief, it was detailed that IMUs would be incorporated into the gait assessment interface, proposing Xsens’ system as the IMU base system (“MTw Awinda” Citation2021). However, it was unknown what features and gait analysis parameters from the IMUs the physicians and physiotherapists would like to be present in the user interface, and how they wanted these parameters to be visualized.
In doing so, there was less focus on selecting the gait analysis technology and more focus on developing a user interface that meets user needs and incorporates information from the IMUs in a way the users could understand. Therefore, the focus of the first two stages of the design process was not to determine what technology to use, but rather to gain a deeper understanding of the users to develop an interface that meets their needs (Melles, Albayrak, and Goossens Citation2021).
Additionally, this paper focuses on research through a design approach. In doing so, we used interim design results iteratively to explore the possibilities and reflect on what the user needs were and whether the interim design met those needs. We then used exploration and evaluation to create the next version of the design. The user studies conducted and the different versions of the interface design were all exploratory in nature to gather rich insights and make the next design iteration. These designs were broad at first but became more and more detailed and feasible after each user study.
Research questions
The research questions, methods, and data analysis used in each stage of the study are featured in .
Table 1. Overview of research questions, methods, participants, and data analysis used in each stage of the design process.
In Methods, stage 1 of the design process, user research, will be further explained. The remaining stages will be detailed in Results. This is followed by Discussion, where we will reflect on the project and what can be done in future design iterations and research.
Experimental setup
The gait assessment interface was designed in collaboration with Delft University of Technology (Faculty of Industrial Design Engineering), Erasmus MC University Medical Centre, and Rijndam Rehabilitation. All work conducted in the project involving user testing and participation gained ethical approval from the Delft University of Technology Human Research Ethics Committee.
Participants
Physiotherapists and physicians who work for Rijndam Rehabilitation and treat patients with neurological disorders, including incomplete SCI, were recruited to participate in this research. The number of participants throughout the research depended on the methods applied in each stage and the participants’ availability, see . The eighteen participants involved in the study have a combined 242 years of clinical experience, with an average of 13.4 years per participant. Due to the within-group variation in clinical gait expertise, the meaning of gait parameters was explained when necessary.
Stage 1—User research (discover phase)
User research was conducted to examine how physiotherapists and physicians currently assess gait, what features and gait analysis parameters they would like to be present in the user interface, and how these parameters should be visualized. Due to the limited availability of the participants, a combination of questionnaires and focus groups was used. As discussing the participants’ current experiences with gait assessment did not require additional real-time follow-up questions from and discussion with the principal researcher, it was decided to obtain this information through a questionnaire and the user requirements for the gait assessment interface through focus groups.
Six physicians and twelve physiotherapists participated in this stage (). All participants gave informed consent.
Questionnaire on current experience with gait assessment
Physicians’ and physiotherapists’ current experience with gait assessment was assessed using a custom-made questionnaire with free-response questions. For data security purposes, the questionnaire was a fillable Adobe Acrobat pdf form. Questions in the questionnaire included:
How and why do you currently assess gait?
In a gait assessment, what do you look for?
What type of decisions do you make with the information from a gait assessment?
What do you feel is missing in the way you currently assess gait? What can be improved?
Focus group sessions on identifying requirements for gait assessment interface
Focus Groups were conducted to identify what features and gait analysis parameters physicians and physiotherapists would like to be present in the user interface and how these parameters should be visualized. Most participants had limited experience with interpreting laboratory gait analysis reports. Therefore, a focus group format was selected, rather than a questionnaire, to avoid confusion regarding terminology surrounding gait analysis parameters and to allow for discussion between participants.
The focus groups ranged in size to fit participants’ schedules, with a maximum of six participants in a session. Focus groups with a minimum of two participants and individual interviews were conducted, as we believed it was more beneficial to the research to have more participants than fewer participants and larger focus groups. The focus groups were conducted in person and over video teleconferencing over the course of two weeks, with each lasting one hour.
At the beginning of each session, a short presentation was given to explain the project’s purpose and how the session would be conducted. The presentation briefly explained what IMUs are and how they would be used in the operation of the user interface as well.
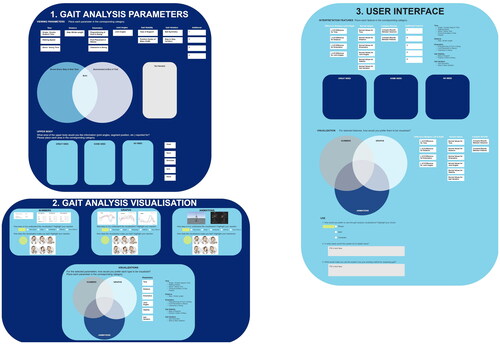
The participants then completed a series of interactive activities on a Miro Board (an online interactive white board) () (“Miro” Citation2022). Each participant was assigned a board that was broken down into three sections: (1) Selecting gait analysis parameters; (2) Selecting how the parameters should be visualized; (3) Additional features wanted to be included in the user interface. Each activity was first explained, and then after the participants completed it, there was a discussion on why the participants formed those answers.
Figure 2. Miro Activity Board consisted of interactive questions that were divided into three sections: (1) Gait Analysis Parameters, (2) Gait Analysis Visualizations, and (3) User Interface.
During each focus group session, notes were taken by the principal researcher. The audio of each session was recorded and later transcribed. Answers to the quantitative questionnaire and focus group questions were analysed using Excel. Answers to the qualitative questionnaire and focus group questions were collected and categorized using the Affinity Diagram method. In this method, ideas are clustered into similar groups and themes. These groups are then broken down into smaller groups to evaluate the relationship between the ideas (Holtzblatt and Beyer Citation2016).
Results
Stage 2—Analyse and interpret results (define phase)
This stage focussed on evaluating the insights gathered from the user research to develop the design vision.
Questionnaire on current experience with gait assessment
From the questionnaire responses, it was found that the most common reasons clinicians assess gait are to aid in selecting and developing a patient’s treatment and to evaluate interventions. This includes physicians determining if surgical or medical interventions are needed, physiotherapists pinpointing what gait parameters and exercises to focus on, and selecting walking aids, orthoses, and orthopaedic shoes.
In their current gait assessment methods, participants evaluate joint angles, foot position, time, distance, gait variation, and gait stability parameters. Joint angles and foot position were evaluated most often. Participants expressed that the observational gait analysis can be improved by allowing clinicians to obtain detailed kinematic measurements, compare interventions, and provide visual feedback to patients.
Participants believed laboratory gait analysis could be improved by making it easier to use and access. Part of this is the data being presented in a more intuitive manner and shortening the time it takes to receive the analysed test report. An added benefit of the gait analysis would be to have the option to conduct tests in different environments other than the laboratory.
Focus group sessions on identifying requirements for gait assessment interface
Participants were asked to select which gait parameters and IMU interpretation features listed in the activity board they would like in the gait assessment interface and how they would like them to be visualized and viewed. Their options were to be visualized as a number, line graph, animation (such as an avatar or graphic of the results), or a combination of these and to view the data in real-time and/or at the end of the trial. Participants with less expertise in clinical gait analysis mainly used instinct over knowledge to select gait parameters and visualizations.
As seen in , participants wanted all parameters to be visualized as animations and numbers or graphs, except for time and distance. Participants also wanted to view all parameters both in real-time and at the end of the trial, apart from time and gait variation.
Table 2. (a) Results on preferred visualizations and viewing of gait parameters. (b) Results on preferred interpretation features and the respective visualizations.
As shown in , for interpretation features, there was more favour towards visualizing with numbers and graphs. The features with the most need by participants were comparing results between sessions, foot position (difference between left and right, normal values), and joint angles (difference between left and right, normal values). Animations allow the physiotherapists and physicians to have a quick summary of the gait assessment, with numbers and graphs being used for a more in-depth and objective analysis.
The majority of participants said they would use the new gait assessment system when it is not possible to detect abnormalities with the observational gait analysis and when evaluating the effects of interventions. Participants noted that in order for them to adapt the system, it must make up for what the current methods are lacking. For the observational gait analysis, this is done by providing more accurate, objective, and detailed information. For laboratory gait analysis, the system must be accessible, easy to use, time efficient, and the results not difficult to interpret.
Design vision
A thorough analysis of the results from the user research resulted in the following design vision: Design an easy to use user interface that aids physicians and physiotherapists in selecting interventions for patients with incomplete SCI in an objective and time efficient manner through intuitive data visualizations.
Stage 3—Conceptualize and assess concepts
Conceptualize concepts (develop phase)
Based on the design vision, different concepts for the user interface were developed. In the first design iteration, ideation for the (1) visualizations of the gait parameters and (2) interface layout was conducted. To brainstorm ideas for visualizations of each gait parameter type (time, distance, foot position, joint angles, and gait stability), collages were first created of existing solutions. Using the collages for inspiration, sketches for each of the solution categories were drawn in Morphological Charts (Van Boeijen and Daalhuizen Citation2014). The principal researcher developed ideas by combining sketches from each category.
To design the interface layout, the steps a user takes to operate the interface were defined, such as logging in, viewing test data, etc. For each step, a collage of existing solutions was developed and then the ideas were illustrated using wireframe sketches (Van Boeijen and Daalhuizen Citation2014).
To select which ideas to develop into concepts, the ideas were evaluated through feasibility analysis and Harris Profiles (Van Boeijen and Daalhuizen Citation2014). Two to three ideas from each Harris Profile evaluation were selected to develop into concepts.
Assess concepts (deliver phase)
Participants who participated in stage one were recruited to provide feedback on the developed concepts. Two user test sessions were conducted with three physiotherapists and two physicians, respectively (). Each session lasted about one hour and was conducted in person.
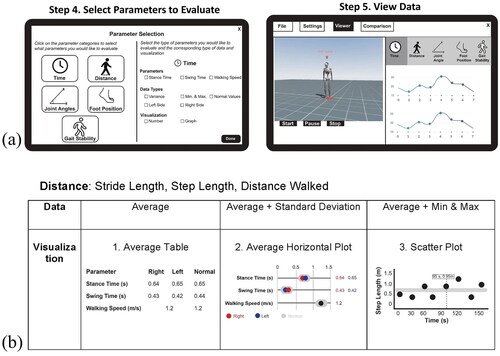
To evaluate the gait parameter visualizations and interface layouts, each participant was given a printed booklet. The first half of the booklet contained one to two wireframes for each of the seven user steps, see . The second half consisted of the visualization concepts for each type of parameter, see . The wireframes for each step were explained, followed by the visualizations for each parameter. As a group, it was discussed how intuitive the concepts were to understand, what the participants did and did not like, and when there was more than one concept per user step or parameter, if they preferred one over the other or a combination of the concepts. Additionally, for the interface wireframes, participants were asked to rate them using a Likert scale in terms of ‘How easy it is to understand and operate?’ from very difficult to very easy.
Figure 3. (a) Page from the Interface Layout section of the user test booklet for the user steps of Select Parameters to Evaluate and View Data. (b) Page from the Gait Parameters Visualizations section of the user test booklet featuring the concepts for the distance-related gait parameters.
Through the user tests, it was found that the participants preferred concepts with a simplistic structure that required the least steps possible to complete. They wanted to be able to select which gait parameters to view at a time, rather than the interface automatically showing all gait parameters.
They also wanted to have the capability to choose which type of visualization is shown for the gait parameters. However, to prevent being overwhelmed when initially using the interface, participants preferred for a set of standard visualizations to be automatically assigned to each gait parameter. As they gain more experience with the interface and gait assessment, the participants expect to feel comfortable enough to change the types of visualizations for each gait parameter.
Stage 4—Develop and evaluate prototype
Develop prototype (develop phase)
Using the feedback received in the user testing to influence the next design iteration, an initial layout design of the interface was constructed ().
Figure 4. Layout design of gait assessment interface.
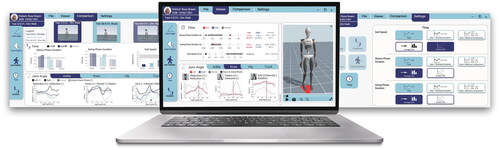
The interface would work in collaboration with wireless IMUs. The IMUs are placed on the patient, and the data collected is transferred to the interface, where it is then processed. Information on gait metrics could then be selected and visualized through the user interface.
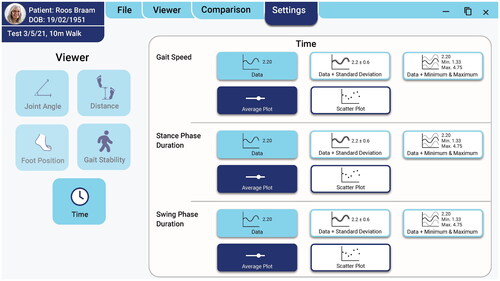
In the Viewer Screen, the patient’s gait could be viewed in real-time and after the test has concluded through an avatar and intuitive graphs and charts for fifteen different outcome parameters, see . In the Comparison Screen, the user can compare the results from up to three tests, see . In the Settings Screen, the user can customize each parameter display, with nine different types of data and visualization to choose from (). Through self-evident screen flow and actions, the interface could be operated by users with minimal technical experience.
Figure 5. (a) View patient’s gait through an avatar, graphs, and charts in the Viewer Screen. (b) Compare the results from up to three tests in the Comparison Screen.
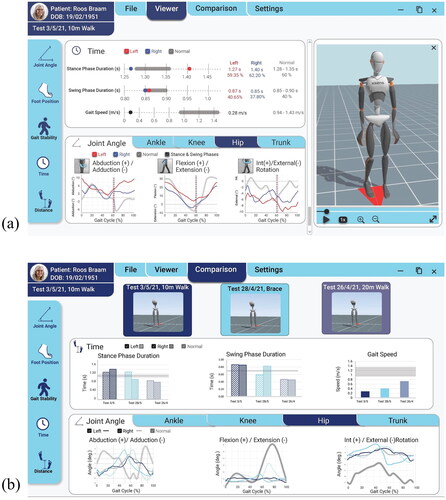
Figure 6. Settings Screen where the user can change the type of data and visualization that is displayed for each parameter.
Evaluation of interface design (deliver phase)
An interactive prototype of the interface was developed using Adobe XD. The parameter visualizations were designed using data collected by the IMUs and developed with Adobe InDesign. At the time of the project, the prototype did not have the capabilities to collect data from the IMUs and thus could not be operated in real-time.
The interface prototype was evaluated with four physiotherapists and three physicians (). All participants had participated in the user tests in stages one and/or three. The evaluations took place individually and in person, with each lasting one hour. Feedback was received on the interface and data visualizations regarding usability, functionality, intuitiveness, and aesthetics through participants interacting with the prototype and filling out System Usability Scale (SUS) and VisAWI questionnaires (Will Citation2021; “VisAWI” Citation2021).
It was found that participants could operate the interactive prototype with minimal to no instructions. They rated the usability of the layout positively, with an average System Usability Scale score of 85.8. This score falls in the category of an excellent rating (Will Citation2021). While some participants required some guidance to use the interface, they believed that they would be able to operate the interface independently after a quick training session. A majority of participants also rated the aesthetic of the interface positively, with an average VisAWI score of 6 (Agree) out of 7 for all categories (simplicity, diversity, colourfulness, and craftsmanship) (“VisAWI” Citation2021).
Participants found the test result visualizations easy to understand and intuitive. However, a few participants struggled with understanding the content in the interface due to their limited previous knowledge of laboratory gait assessment.
All participants said they would use the interface if it was fully functional and operational in the next year. However, they would use the interface in addition to the observational gait analysis and EMG data for special cases rather than everyday treatment. This includes when it is too difficult to detect gait changes with observational analysis, an in-depth gait analysis is needed, or to compare a patient’s gait before and after treatment.
Discussion and evaluation
The main focus of this paper was to identify the requirements of an IMU-based mobile gait assessment interface for use in a clinical setting by rehabilitation physicians and physiotherapists. For this, a user-centred design process was used.
As part of the user-centred design process, user tests were conducted throughout the different stages to obtain feedback on usability, interface layout, and intuitiveness of use and functionalities of the interface design. This led to many design iterations, using the users’ input to create the initial interface design and prototype.
While some participants required some guidance to use the interface and interpret the results, all believed that they would be able to operate the interface independently after a quick training session and getting acquainted with the terminology of the parameters.
Physician 1: ‘It is not about using the system. The system you made is easy. It is more about the content. Right now, it is a little bit difficult to interpret these aspects. I think it would help if we practiced with this.’
Participants found the gait assessment interface more objective than the observational gait analysis. The reason for this increase in objectivity is that due to less visual noise, they could see the patient walk clearer with the avatar. With the avatar and visualizations, it was possible to see the small differences in gait as well. In addition, participants found the interface to be a tool to check assumptions they made when evaluating with the observational gait analysis.
Physician 2: ‘When you first see the videos and then see the data you think, “Oh, okay. I thought that was different.” It invites you to evaluate your own perceptions.’
Overall, the participants had positive feedback on the interface and are excited to potentially use it in the future.
Physiotherapist 2: ‘I am really looking forward to it because I think it really adds something. I think we will frequently be using it.’
Physiotherapist 4: ‘I like the interface, and I think it is easy and is better than what we have now [observational analysis].’
Limitations of project
Participants worked in one rehabilitation centre and the sample size was limited. An obstacle in designing the user interface was that some participants had little experience with laboratory gait assessment. These participants were unfamiliar with the meaning of some of the gait parameters and were not previously educated on how to interpret them. Consequently, part of the terminology used had to be explained in the user research stage. Some participants also used instinct over knowledge to select gait parameters and visualizations.
Future research and recommendations
The initial interface design and prototype are not a final solution, but rather a stepping stone for future development to close the barrier between IMU-based gait instruments and physicians and physiotherapists effectively using this technology to improve patient care. To close this barrier, further research and development will need to be conducted.
Develop functional interface
In addition to further iterations of the interface design to improve usability and functionality, and develop and deliver phases of the design process, the IMU technology must be integrated to develop a working functional prototype. The prototype should be able to receive data from the wireless motion trackers so the user can view the test data in real-time and conduct testing outside the laboratory environment.
Training sessions
After a working prototype has been developed, training sessions should be implemented to get the users acquainted with the terminology of the parameters. These training sessions can be in the form of classes, online tutorials, or a booklet. In addition, the physicians and physiotherapists need to be trained in using the motion trackers and operating the interface before using the system independently.
Visual feedback for patients
In stage one of user research, it was expressed by the participants that they wanted to use the gait assessment interface to provide visual feedback to patients and for patients to be able to see their progress over time as a potential way to increase motivation. The feedback and progress could be implemented by designing a separate interface for the patient or adding features to the existing gait assessment interface design.
A key element to designing the visual feedback for patients is to involve patients in the design process. This is a critical component to ensure that patients’ needs are at the forefront of the development and that patients understand the information presented in the gait assessment interface. Through doing, patients could experience an increase in the quality and accessibility of their health information.
Design PDF and printable test report
In the initial interface design, there is currently no option to create a printable test report. Therefore, it is recommended to develop a version of the test results that can be sent as a PDF or printed out. This would allow the results to be added to a patient’s records and for clinicians without access to the interface to be able to view test reports.
Clinical feasibility and validity
Successful clinical implementation of a final interface also requires additional information on its clinical feasibility and validity. The interface should be usable by and applicable to clinicians with moderate expertise in clinical gait analysis. In addition, relatively little is known about the accuracy of both kinematic and spatiotemporal parameters determined using IMU data for patients with abnormal gait patterns. Follow-up research is needed to further investigate these facets.
Application of design to other fields and disorders
As the gait assessment process is similar across disorders, the gait assessment interface could be used for other patients with orthopaedic or neurological disorders. With some adaption to how the parameters are calculated, the interface could be used to show the gait parameters of children as well.
Gait analysis through IMUs also has applications in sports, workflow analysis, computer games, surveillance, modelling, human recognition, and numerous other fields (Bleser et al. Citation2017; Jarchi et al. Citation2018). Additional studies have been conducted in these fields regarding the advancement of IMUs in gait analysis (Refai et al. Citation2019, Citation2020; Bleser et al. Citation2017; Caldas et al. Citation2017).
Conclusion
Through utilizing user-centred design to involve users throughout every stage of the design process, requirements were identified for an IMU-based mobile gait assessment interface for use in a clinical setting by rehabilitation physicians and physiotherapists. The interface aims to allow physicians and physiotherapists with limited experience to objectively assess the gait characteristics of patients with incomplete SCI. In evaluating the interface prototype, participants gave positive feedback. They could operate the prototype with minimal to no instructions and found the parameter visualizations intuitive to understand.
The next steps are to develop the design further through additional research on utilizing IMU technology in gait assessment, iterations on the interface design, incorporating patient features into the interface, and creating a functional prototype.
Author contributions
Rebekah Kempske was the principal researcher who developed and led all user tests, created the initial design of the gait assessment interface, and was the primary author of the manuscript.
Dr. Karin Postma introduced the principal researcher to the daily practice of rehabilitation, advised on methodological aspects of the project, helped with the follow-up of the measurements, and reviewed and co-edited the manuscript.
Dr. Daniel Lemus Perez contributed to the conception of the work, the acquisition of data, and drafting and revising the manuscript.
Dr.ir. Armaĝan Albayrak contributed to the project by coaching the student, helping to set-up the context and user research, providing feedback on design iterations, and reviewing the manuscript.
Rutger Osterthun, Heike Vallery, and Gerard Ribbers advised on methodological aspects of the project and reviewed and co-edited the manuscript.
Dr. Herwin Horemans contributed to the conception of the work, the acquisition of data, the interpretation of data, and drafting and revising the manuscript.
Acknowledgements
The authors would like to thank all of the physicians and physiotherapists who participated in this project and aided in its development.
Disclosure statement
No potential conflict of interest was reported by the author(s).
Additional information
Funding
Notes on contributors
Rebekah Kempske
Rebekah Kempske is a Master of Science in Integrated Product Design. She graduated from the Faculty of Industrial Design Engineering of Delft University of Technology.
Karin Postma
Dr. Karin Postma is a physiotherapist and movement scientist with an interest in technological innovations to support treatment of patients with a spinal cord injury.
Daniel Lemus Perez
Dr. Daniel Lemus Perez is a Mechanical Engineer. His scientific interest focuses on the integration of robotic technologies to assist clinicians with diagnosis and therapy interventions in patients with neurologic impairments.
Armaĝan Albayrak
Dr.ir. Armaĝan Albayrak is an assistant professor in applied ergonomics and design. Her scientific work focuses on human-centred research and design for healthcare.
Rutger Osterthun
Rutger Osterthun is a rehabilitation doctor and scientist. His research focuses on innovative solutions for improving mobility of patients with incomplete spinal cord injury.
Heike Vallery
Heike Vallery is a professor of human motor augmentation. Her research interests are in bipedal locomotion and robotic assistance for individuals with gait disorders.
Gerard Ribbers
Gerard Ribbers is a professor in rehabilitation medicine with clinical focus on spinal cord injury, acquired brain injury, and paediatric rehabilitation.
Herwin Horemans
Dr. Herwin Horemans is a physiotherapist and movement scientist. His research focuses on making objective data about gait accessible to clinicians.
References
- Bleser, Gabriele, Bertram Taetz, Markus Miezal, Corinna A. Christmann, Daniel Steffen, and Katja Regenspurger. 2017. “Development of an Inertial Motion Capture System for Clinical Application.” i-com 16 (2): 113–129. doi:10.1515/icom-2017-0010.
- Caldas, Rafael, Marion Mundt, Wolfgang Potthast, Fernando Buarque de Lima Neto, and Bernd Markert. 2017. “A Systematic Review of Gait Analysis Methods Based on Inertial Sensors and Adaptive Algorithms.” Gait & Posture 57: 204–210. doi:10.1016/j.gaitpost.2017.06.019.
- Celik, Yunus, Sam Stuart, Wai Lok Woo, and Alan Godfrey. 2021. “Gait Analysis in Neurological Populations: Progression in the Use of Wearables.” Medical Engineering & Physics 87: 9–29. doi:10.1016/j.medengphy.2020.11.005.
- Di Raimondo, Giacomo, Benedicte Vanwanseele, Arthur Van der Have, Jill Emmerzaal, Miel Willems, Bryce Adrian Killen, and Ilse Jonkers. 2022. “Inertial Sensor-to-Segment Calibration for Accurate 3d Joint Angle Calculation for Use in OpenSim.” Sensors 22 (9): 3259. doi:10.3390/s22093259.
- Grimm, Bernd, and Stijn Bolink. 2016. “Evaluating Physical Function and Activity in the Elderly Patient Using Wearable Motion Sensors.” EFORT Open Reviews 1 (5): 112–120. doi:10.1302/2058-5241.1.160022.
- Hendriks, Maartje M. S., Marije Vos-van der Hulst, Ralf W. J. Weijs, Jaap H. van Lotringen, Alexander C. H. Geurts, and Noel L. W. Keijsers. 2022. “Using Sensor Technology to Measure Gait Capacity and Gait Performance in Rehabilitation Inpatients with Neurological Disorders.” Sensors 22 (21): 8387. doi:10.3390/s22218387.
- Holtzblatt, Karen, and Hugh Beyer. 2016. Contextual Design: Design for Life. 2nd ed. Amsterdam: Morgan Kaufmann.
- Jacinto, L. Jorge, and Miguel Reis Silva. 2018. “Gait Analysis in the Context of Spasticity Management.” In Advanced Technologies for the Rehabilitation of Gait and Balance Disorders, 471–487. Cham: Springer International Publishing. doi:10.1007/978-3-319-72736-3_31.
- Jarchi, Delaram, James Pope, Tracey K. M. Lee, Larisa Tamjidi, Amirhosein Mirzaei, and Saeid Sanei. 2018. “A Review on Accelerometry-Based Gait Analysis and Emerging Clinical Applications.” IEEE Reviews in Biomedical Engineering 11: 177–194. doi:10.1109/rbme.2018.2807182.
- Kirshblum, Steven C., Stephen P. Burns, Fin Biering-Sorensen, William Donovan, Daniel E. Graves, Amitabh Jha, Mark Johansen, et al. 2011. “International Standards for Neurological Classification of Spinal Cord Injury (Revised 2011).” The Journal of Spinal Cord Medicine 34 (6): 535–546. doi:10.1179/204577211X13207446293695.
- Kobsar, Dylan, Jesse M. Charlton, Calvin T. F. Tse, Jean-Francois Esculier, Angelo Graffos, Natasha M. Krowchuk, Daniel Thatcher, and Michael A. Hunt. 2020. “Validity and Reliability of Wearable Inertial Sensors in Healthy Adult Walking: A Systematic Review and Meta-Analysis.” Journal of NeuroEngineering and Rehabilitation 17 (1): 1–21. doi:10.1186/s12984-020-00685-3.
- Melles, Marijke, Armagan Albayrak, and Richard Goossens. 2021. “Innovating Health Care: key Characteristics of Human-Centered Design.” International Journal for Quality in Health Care 33 (Supplement_1): 37–44. doi:10.1093/intqhc/mzaa127.
- “Miro.” 2022. Miro. Accessed January 2, 2022. https://miro.com/
- Morris, Rosie, Samuel Stuart, Grace McBarron, Peter C. Fino, Martina Mancini, and Carolin Curtze. 2019. “Validity of Mobility Lab (Version 2) for Gait Assessment in Young Adults, Older Adults and Parkinson’s Disease.” Physiological Measurement 40 (9): 095003. doi:10.1088/1361-6579/ab4023.
- “MTw Awinda.” 2021. Xsens. Accessed October 5, 2021. https://www.xsens.com/products/mtw-awinda
- Ong, A. M. L., S. J. Hillman, and J. E. Robb. 2008. “Reliability and Validity of the Edinburgh Visual Gait Score for Cerebral Palsy When Used by Inexperienced Observers.” Gait & Posture 28 (2): 323–326. doi:10.1016/j.gaitpost.2008.01.008.
- Paulich, Monique, Martin Schepers, Nina Rudigkeit, and Giovanni Bellusci. 2018. Xsens MTw Awinda: Miniature Wireless Inertial-Magnetic Motion Tracker for Highly Accurate 3D Kinematic Applications, 1–9. Enschede: Xsens.
- Post, Marcel W. M., Carla F. Nooijen, Karin Postma, Jos Dekkers, Frans Penninx, Rita J. G. van den Berg-Emons, and Henk J. Stam. 2017. “People with Spinal Cord Injury in The Netherlands.” American Journal of Physical Medicine & Rehabilitation 96 (2 Suppl 1): S93–S95. doi:10.1097/PHM.0000000000000619.
- Read, Heather S., M. Elizabeth Hazlewood, Susan J. Hillman, Robin J. Prescott, and James E. Robb. 2003. “Edinburgh Visual Gait Score for Use in Cerebral Palsy.” Journal of Pediatric Orthopedics 23 (3): 296–301. doi:10.1097/01241398-200305000-00005.
- Refai, Mohamed Irfan Mohamed, Bert-Jan F. Van Beijnum, Jaap H. Buurke, Mique Saes, Johannes B. J. Bussmann, Carel G. Meskers, Erwin Van Wegen, Gert Kwakkel, and Peter H. Veltink. 2019. “Portable Gait Lab: Zero Moment Point for Minimal Sensing of Gait.” Annual International Conference of the IEEE Engineering in Medicine and Biology Society. IEEE Engineering in Medicine and Biology Society. Annual International Conference 2019, 2077–2081. doi:10.1109/embc.2019.8857314.
- Refai, Mohamed, Mohamed Irfan, Bert-Jan F. van Beijnum, Jaap H. Buurke, and Peter H. Veltink. 2020. “Portable Gait Lab: Estimating over-Ground 3D Ground Reaction Forces Using Only a Pelvis IMU.” Sensors 20 (21): 6363. doi:10.3390/s20216363.
- Routhier, François, Noémie C. Duclos, Émilie Lacroix, Josiane Lettre, Elizabeth Turcotte, Nathalie Hamel, François Michaud, Cyril Duclos, Philippe S. Archambault, and Laurent J. Bouyer. 2020. “Clinicians’ Perspectives on Inertial Measurement Units in Clinical Practice.” PLOS One 15 (11): e0241922. doi:10.1371/journal.pone.0241922.
- Van Boeijen, Annemiek, and Jaap Daalhuizen. 2014. “Roos Van Der Schoor, and Jelle Zijlstra.” In Delft Design Guide: Design Strategies and Methods. Amsterdam: BIS Publishers.
- “VisAWI.” 2021. VisAWI. Accessed May 14, 2021. https://visawi.uid.com/
- Werner, Charlotte, Chris Awai Easthope, Armin Curt, and László Demkó. 2021. “Towards a Mobile Gait Analysis for Patients with a Spinal Cord Injury: A Robust Algorithm Validated for Slow Walking Speeds.” Sensors 21 (21): 7381. doi:10.3390/s21217381.
- Will, T. 2021. “Measuring and Interpreting System Usability Scale.” UIUX Trend. Accessed May 16, 2021. https://uiuxtrend.com/measuring-system-usability-scale-sus/#calculation