
The overall incidence rate of active tuberculosis (TB) disease in Canada is low and has remained unchanged in the last 10 years at around 4.6-5.1 individuals per 100,000 population, with males more affected than females. The rate in 2020 was 4.7 per 100,000 population.
Pronounced disparities in certain population subgroups and geographic regions persist. Foreign-born individuals and Canadian-born Indigenous peoples in particular continue to be disproportionately affected by TB.
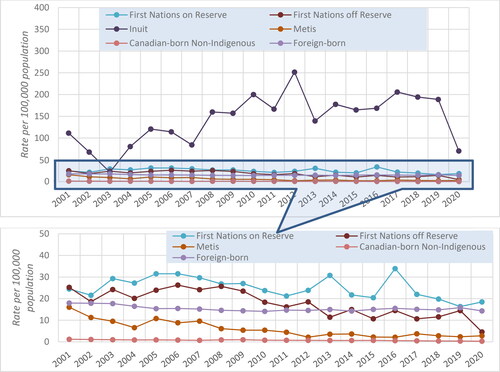
The active TB disease incidence rate in Inuit communities has been the highest in Canada for the past two decades, peaking in 2012 at 251.6 individuals per 100,000 population, more than 51 times the overall Canadian incidence rate. In 2020, the incidence rate was 70.3 per 100,000 population, or 15 times the overall Canadian rate.
The rate of active TB disease among First Nations on-reserve populations has gradually decreased since 2009, and leveled off after 2017 at just under 20.0 per 100,000 population, or three times the Canadian incidence rate. Incidence rates among First Nations off-reserve populations have been lower, at about 10.0 per 100,000 population since 2013.
Métis have been less affected among Canadian-born Indigenous peoples, with active TB disease incidence rates that gradually decreased to levels below the overall Canadian rate since 2012, varying between 2.2 and 3.7 per 100,000 population.
Individuals born outside Canada constitute the largest proportion of people reported with active TB disease, with an incidence rate that has remained almost unchanged since 2005, at about 15.0 individuals per 100,000 population.
The Canadian-born, non-Indigenous population is the least affected, with an incidence rate that gradually decreased by 83.3%, from 1.2 per 100,000 population in 2001 to 0.2 per 100,000 population in 2020.
Between 2017 and 2020, 3.5% of individuals who had active TB disease and whose human immunodeficiency virus (HIV) status was known were HIV-positive.
In the last 20 years, on average, 12 TB-related deaths per year were reported in Canadian-born, non-Indigenous populations, compared to about 44 deaths annually for foreign-born populations.
Over the last 12 years, drug-resistant TB was isolated in 9.5% (n = 1,598) of people diagnosed with active TB disease and whose isolates were subjected to susceptibility testing. Of these, 83.2% (n = 1,329) had mono-resistance, primarily to isoniazid (INH) (n = 1,072) and pyrazinamide (PZA) (n = 225). Multidrug resistance (ie, resistance to INH and rifampin) accounted for 3.6% (n = 57), and extensively drug-resistance (ie, resistance to isoniazid and rifampin), plus any fluoroquinolone and at least 1 of 3 injectable second-line drugs (ie, amikacin, kanamycin or capreomycin), was rare and detected only 6 times.
KEY POINTS
1. Background
1.1. Global epidemiology overview
The World Health Organization (WHO) estimates that approximately 10 million (between 8.9 to 11.0 million) individuals had active TB disease worldwide in 2019. Males and females respectively accounted for around 5.6 and 3.2 million, with children accounting for a further 1.2 million.Citation1 A total of 87% of these individuals were from high-TB-burden countries, including India, Indonesia, China, the Philippines, Pakistan, Nigeria, Bangladesh and South Africa.
Overall improvement in general living conditions and population health, in conjunction with intensive efforts of the global Stop TB Strategy, have led to the annual number of individuals with active TB disease falling progressively since 2006. Globally, there was a cumulative reduction of 8.5% in TB incidence between 2015 and 2019: from 142 individuals with newly acquired active TB disease per 100,000 population in 2015 to 130 per 100,000 in 2019, which corresponds to an annual reduction rate of about 2.1%. The goal for the WHO End TB Strategy was for a cumulative reduction of 20% by 2020.
Worldwide, TB continues to be among the top 10 causes of death and the leading cause of death from a single infectious agent, greater than that of HIV/acquired immunodeficiency syndrome (AIDS) AIDS. In 2020, TB-related mortality was estimated at 1.4 million (1.2 million among individuals who were HIV-negative, and approximately 200,000 among individuals who were HIV-positive); while this corresponded to a 14% reduction in total deaths from 2015, it remains far short from the WHO target of reducing TB-related deaths by 35% by 2020.
1.2. Surveillance of active TB disease in Canada
In Canada, local public health authorities are required to report on all individuals diagnosed with active TB disease to their respective provincial/territorial TB program. Provincial and territorial TB programs then voluntarily submit reports that meet the surveillance definition of active incident (new and retreatment) TB disease to the Canadian TB Reporting System (CTBRS), at the Public Health Agency of Canada (PHAC). Although participation in the CTBRS is voluntary, all provinces and territories are active participants.
The CTBRS definition of active TB disease is based on either clinical or laboratory criteria. The clinical definition refers to one or a combination of:
signs and symptoms or diagnostic imaging findings compatible with active TB disease;
pathologic or postmortem evidence of active TB disease; and
a favorable response to a therapeutic trial of anti-TB drugs.
A positive laboratory diagnosis requires a positive culture to Mycobacterium TB (M. tuberculosis) complex (not including Mycobacterium bovis BCG strain) or a combination of clinical findings consistent with active TB disease and a positive nucleic acid amplification test.
Individuals with active TB disease are diagnosed by health care professionals and documented for local, provincial/territorial and national reporting. Reports are collated at the CTBRS, which maintains a database of non-identifying information on each person diagnosed with active TB disease, including demographic (age, sex, indigenous identity and ethnicity), clinical, co-morbid (HIV/AIDS, diabetes), treatment and outcome details.
Incidence rates for a specific population (Indigenous, Canadian-born non-Indigenous, foreign-born) in a given location (province/territory) are calculated as the number of individuals with active TB disease in that population divided by the total population born in that location. For foreign-born incidence rates, these denominators were Statistics Canada estimates of individuals residing in Canada who were born abroad.
2. Data on active TB disease in Canada
2.1. Morbidity
In the early 20th century, TB was a major cause of morbidity and mortality in Canada. displays records of active TB disease going back as far as 1924, although nationwide systematic reporting was only instituted in 1933.
Figure 1. Reported incidence and mortality rates of active tuberculosis in Canada, 1924-2020.
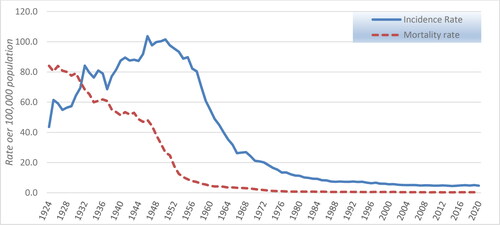
From the available records, 1 in 13 reported deaths in Canada in 1926 were due to TB, a number slightly higher than the number of deaths reported for cancer at the time. As a result of improved living conditions and healthcare and prevention, as well as the development and implementation of public health measures and availability of antibiotics effective against M. tuberculosis, the morbidity and mortality rates have significantly decreased over time ().
2.2. Infection sites
Respiratory TB has been the most frequently reported form of active TB disease in Canada, of which pulmonary TB is the most common (). TB of the peripheral lymph nodes accounted for the majority of reported non-respiratory TB.
Table 1. Reported incident cases of active TB disease by main diagnostic sites, CTBRS: 2001-2020.
2.3. Demographics
2.3.1. Sex distribution
The overall incidence rate of active TB disease in Canada since 2002 has remained unchanged at about 5.0 individuals per 100,000 population per year (). In 2020, 1,772 individuals with active TB disease were reported for a national rate of 4.7 per 100,000. The rate among males has remained higher than that among females, as illustrated in and , with active TB disease diagnosed 1.1 to 1.4 times more frequently among males compared to females. This is consistent with global TB trends.Citation1
Figure 2. Reported incidence rate (per 100,000 population) of active TB by sex in Canada, CTBRS: 2001-2020.Abbreviations: TB, tuberculosis; CTBRS, Canadian TB Reporting System.
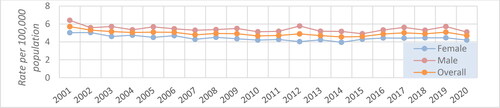
Table 2. Reported number of active TB disease by sex in Canada, CTBRS: 2009-2020.
2.3.2. Age distribution
The CTBRS data demonstrate that, between 2001 and 2020, individuals 15-64 years of age accounted for the largest number with active TB disease in comparison to other age groups (). Until 2020, the highest age-specific incidence rate had consistently been found in the 65+ years old agegroup. In 2020, however, the highest incidence rate was found in the 15-34 years old age group, at 6.3 individuals per 100,000 population (). For the last two decades, the lowest annual numbers (and incidence rates) have been among individuals less than 15 years of age ().
Figure 3. Reported incidence rate (per 100,000 population) of active TB disease by age group in Canada, CTBRS: 2001-2020.Abbreviations: TB, tuberculosis; CTBRS, Canadian TB Reporting System.
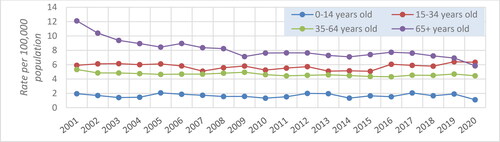
Table 3. Reported active TB disease by age group in Canada over time, CTBRS: 2001-2020.
2.3.3. Regional distribution
While the northern Canadian territories (Yukon Territory [YT], Northwest Territory [NWT] and Nunavut [NU]) collectively reported the lowest absolute numbers of individuals with active TB disease, they consistently posted the highest annual incidence rate, in part due to their small populations ( and ). The variations observed are mainly indicative of the sporadic nature of outbreaks in the territories. The incidence rates in all other regions of Canada have remained unchanged in the past two decades (). Western (Manitoba [MB], Saskatchewan [SK], Alberta [AB] and British Columbia [BC]) Canada reported the second-highest active TB disease incidence rates (between 5.6 and 6.4 cases per 100,000 population; ). The region with the lowest incidence rates has consistently been Atlantic Canada (New Brunswick [NB], Nova Scotia [NS], Prince Edward Island [PEI] and Newfoundland [NL]), which has recorded an annual rate of 0.8 to 1.4 per 100,000 population since 2001 (). Although there has been an increase in the overall number of individuals with active TB disease during the last 4 years, mainly in central and western Canada (), the incidence rate of active TB disease has remained approximately constant due to corresponding increases in population size.
Figure 4. Reported incidence rate (per 100,000 population) of active TB disease by geographical region, CTBRS: 2001-2020.Abbreviations: TB, tuberculosis; CTBRS, Canadian TB Reporting System.
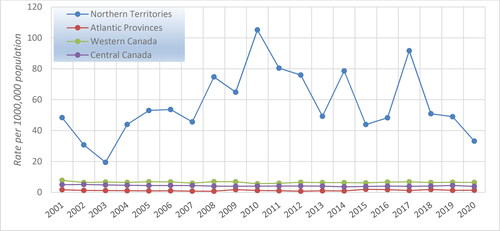
Table 4. Reported active TB disease by geographical region in Canada over time, CTBRS: 2001-2020.
2.3.4. TB in specific populations
The burden of TB in Canada is not shared equally across the entire population. Foreign-born individuals and Canadian-born Indigenous peoples are disproportionately affected by TB (). The former has consistently accounted for the majority of reported cases: between 65% and 67% from 2001 to 2012, and between 70% and 72% from 2013 to 2020, Canadian-born Indigenous peoples, for their part, represented between 14% and 22% of individuals with active TB disease between 2001 and 2020, despite comprising only 4.3% of the Canadian population.Citation2 In Canadian-born, non-Indigenous populations, the incidence rate of active TB disease has been gradually decreasing over the years, from 1.2 cases per 100,000 in 2001 to 0.4 in 2019; in 2020, however, it increased to 1.2 per 100,000 population.
Figure 5. Reported incidence rate (per 100,000 population) of active TB disease by population subgroup in Canada, CTBRS: 2001-2020.
Note: Indigenous status not reported by British Columbia from 2016 onward. Abbreviations: TB, tuberculosis; CTBRS, Canadian TB Reporting System.
2.3.4.1 TB in Indigenous populations
While the greatest number of individuals with active TB disease is reported among foreign-born individuals, the incidence rate of active TB disease over the past 2 decades has consistently been highest among some groups of Canadian-born Indigenous peoples (), which include First Nations, Métis and Inuit, as per the Constitution Act of 1982.Footnotei Social conditions such as over-crowding have played an important role in the TB situation among Indigenous peoples, increasing the risk of infectionCitation3 as well as the risk of progression to active TB disease.Citation4,Citation5 The incidence rate of TB among the Inuit has been the highest among these three groups. In 2019, the active TB disease incidence rate among the Inuit (188.7 cases per 100,000 population) was approximately 472 times that of the Canadian-born, non-Indigenous (0.4 cases per 100,000 population) population (), but in 2020, it decreased significantly to 70.3 cases per 100,000 population. While the reasons for this decrease are not fully understood, it may be related to public health measures put in place for COVID-19 that resulted in reduced transmission, and/or the pandemic’s impacts on health services access and delivery, leading to under-diagnosis of active TB disease.
Among First Nations peoples, the incidence rate of active TB disease has been consistently higher among those living on-reserve than those living off-reserve ( and ). Incidence rates for First Nations on-reserve were relatively stable from 2001 to 2010, but have been decreasing incrementally since 2015 (). Incidence rates among First Nations off-reserve have also been decreasing, and in 2020, they reached a level below the national average of 4.6 per 100,000 population ().
Table 5. Reported active TB disease by population subgroup in Canada over time, CTBRS: 2001-2020.
Unlike Inuit and First Nations peoples, the reported TB incidence among the Métis is similar to that of the non-Indigenous, Canadian-born population. However, this may partly be influenced by challenges in collecting Métis-specific data and in separating Métis from First Nations individuals when there is shared ancestry.Citation6 Reported incidence rates among Métis populations remained stable from 2000 to 2007, after which they progressively decreased and have been below the national average since 2011 ().
2.3.4.2 TB in foreign-born populations
The total annual number of foreign-born individuals with active TB disease reported to the CTBRS increased noticeably in the last 8 years (). However, this did not significantly affect the corresponding incidence rate, which has been relatively stable since 2011 ().
Table 6. Reported active TB disease in foreign-born individuals by WHO birth region, CTBRS: 2001-2020.
Foreign-born individuals diagnosed with active TB disease are assigned to a WHO epidemiologic region on the basis of the country of birth. depicts changes over time in the number of foreign-born individuals with active TB disease reported in Canada between 2001 and 2020 grouped by their epidemiologic region of birth as per the WHO definition. Associated incidence rates () are calculated using denominators produced by latest census data from Statistics Canada.Citation7
Figure 6. Reported incidence rate of active TB disease in foreign-born individuals by WHO region of birth, CTBRS: 2001-2020.Abbreviations: TB, tuberculosis; WHO, World Health Organisation; CTBRS, Canadian TB Reporting System.
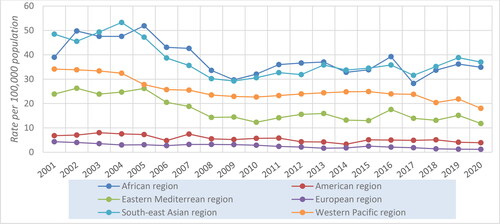
South-East Asia (SEAR) and African regions (AFR) have consistently posted the highest incidence rates of active TB disease among foreign-born individuals for the past two decades (), followed by Western Pacific (WPR) and Eastern Mediterranean (EMR) regions. Comparatively, incidence rates have been the lowest among individuals from the European (EUR) and Americas (AMR) regions ().
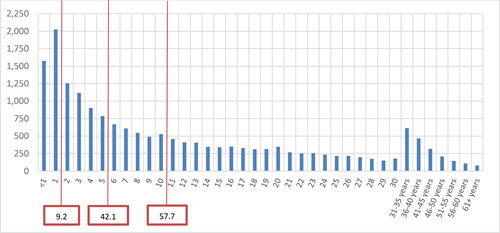
For individuals born outside Canada who were diagnosed with TB disease, the dates of arrival in Canada and active TB disease diagnosis were used to estimate the time lived in Canada until active TB disease diagnosis. Among those foreign-born individuals with active TB disease reported between 2001 and 2020 with known date of arrival, 9.2% were reported within the first year of arrival, 20.2% within the first 2 years of arrival, and 42.0% within the first 5 years, with an additional 15.6% in the subsequent 5 years ().
Figure 7. Reported active TB disease in Canada by time (in years) from arrival to Canada to diagnosis; CTBRS: 2001-2020 (with cumulative percentages noted in the boxes). Abbreviations: TB, tuberculosis; CTBRS, Canadian TB Reporting System.
2.4. TB-HIV Co-Infection
Canada’s national HIV/AIDS and TB surveillance systems have limitations regarding their ability to estimate TB-HIV co-infection. However, data collection on the HIV status of individuals reported with active TB disease has greatly improved over the years, along with the percentage of individuals who are offered HIV testing. In 2001, HIV status was unknown for 83.4% of individuals diagnosed with TB disease; by 2017, that figure had decreased to 30.9%, but in 2020, it had increased again, to 57.3% ().
Figure 8. Percentage of individuals with TB disease by HIV status, Canada, CTBRS: 2001-2020.Abbreviations: TB, tuberculosis; HIV, human immunodeficiency virus; CTBRS, Canadian TB Reporting System.
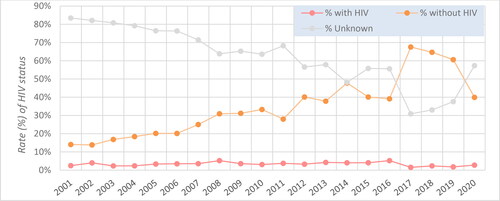
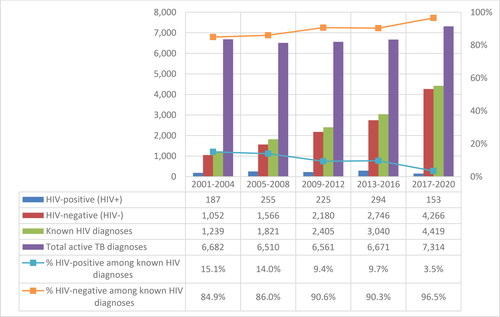
The percentage of HIV-positive individuals among those diagnosed with active TB disease whose HIV status was known decreased over time, from 15.1% in 2001-2004 (when only 1,239 of 6,682, or 18.5% of individuals with active TB disease reported their HIV-status), to 3.5% in 2017-2020 (when 4,419 of 7,314, or 60.4% of individuals with active TB disease reported their HIV-status) (). It should be noted that underreporting of HIV status imposes serious limitations in national level interpretation of changes in the incidence of TB-HIV co-infection.
Figure 9. Known HIV diagnosis among individuals reported with active TB disease, CTBRS: 2001- 2020.Abbreviations: TB, tuberculosis; HIV, human immunodeficiency virus; CTBRS, Canadian TB Reporting System.
2.5. TB-Diabetes mellitus co-morbidity
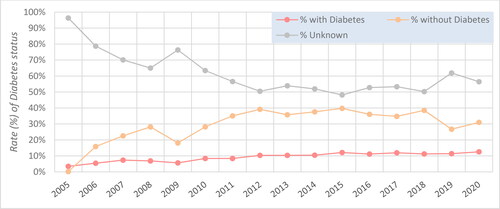
Since the introduction of data collection on TB-diabetes mellitus (DM) co-morbidity into the surveillance of active TB disease in 2005, underreporting of DM status gradually decreased until 2012; since then, it has remained approximately constant (). The overall proportion of missing information on DM has consistently been above 50%, which makes it challenging to interpret national-level data on TB-DM co-morbidity. In the last 2 years, the proportion of individuals diagnosed with active TB disease for whom DM information was missing has increased, following a period of stability: from 50.3% in 2018 to 61.9% and 56.4% in 2019 and 2020, respectively ().
Figure 10. Percentage of individuals reported with active TB disease by diabetes mellitus status, Canada, CTBRS: 2005-2020. Abbreviations: TB, tuberculosis; CTBRS, Canadian TB Reporting System.
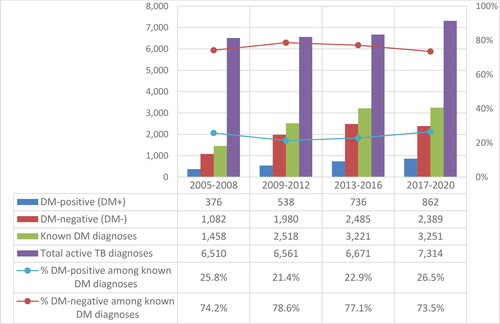
The percentage of individuals reported with active TB disease identified as having a DM diagnosis did not change significantly over time, remaining in the range of 21.4-26.5% ().
Figure 11. Known diagnosis of diabetes mellitus among individuals reported with active TB disease in Canada over time, CTBRS: 2005-2020. Abbreviations: TB, tuberculosis; CTBRS, Canadian TB Reporting System.
2.6. Treatment and outcomes
Data from 2000-2004 show especially high proportions (about 60%) of individuals with active TB disease lost to follow up, and so the treatment outcome data for this period are limited (). Improved follow-up since 2004 has resulted in outcome data being obtained for 90.0% or more of individuals diagnosed with active TB disease in recent years. The proportion with successful active TB disease treatment has consistently been above 90% ().
Figure 12. Treatment outcome for reported active TB disease, CTBRS: 2000-2019. Abbreviations: TB, tuberculosis; CTBRS, Canadian TB Reporting System.
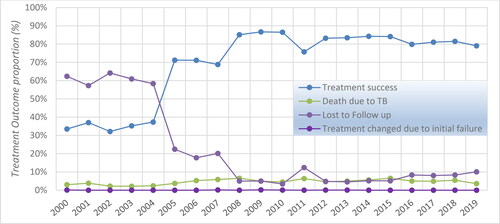
Table 7. Outcome of active TB disease treatment in Canada over the years, CTBRS: 2000-2019.
2.6.1. TB-Related mortality
Reported TB-related deaths (ie, TB disease was either a direct cause of, or a contributing factor to, the death) increased by about 42% from 2000-2003 to 2004-2007, and by 35% from 2004-2007 to 2008-2011. Since 2011, TB-related mortality has been stable (). This increase in the two earlier periods was in part a reporting issue, since data before 2008 were significantly impacted by the relatively high proportion of individuals under treatment for active TB disease who were lost to follow-up ().
Table 8. Summary of TB-related deaths in different population subgroups, CTBRS: 2000-2019.
2.6.1.1 TB-related mortality in Indigenous peoples
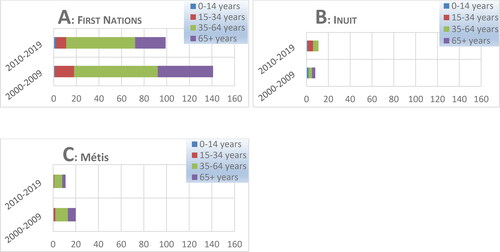
The majority of TB-related deaths in Indigenous peoples in Canada were among First Nations peoples and mostly among those aged 35 years and older (). The total numbers of deaths among the Inuit and Métis populations in each age group were significantly lower than those recorded among First Nations in general ().
Figure 13. Reported TB-related deaths in Indigenous peoples by age group, CTBRS 2000-2019.Abbreviations: TB, tuberculosis; CTBRS, Canadian TB Reporting System.
2.6.1.2 TB-related mortality in Canadian-born, non-Indigenous populations
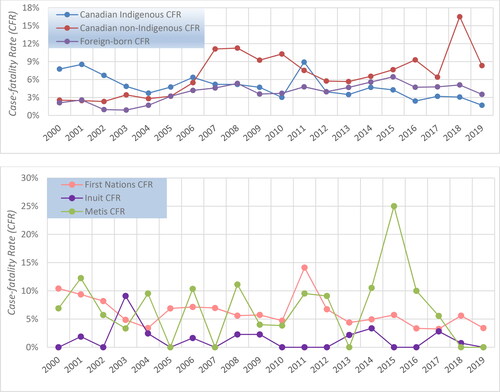
In terms of numbers, the Canadian-born, non-Indigenous population has consistently recorded the lowest TB-related mortality compared to other population subgroups. In the last 20 years, an average of 12 TB-related deaths per year were reported for this population (). The corresponding TB case-fatality rate, however, has generally been higher compared to both the Canadian-born Indigenous and foreign-born populations since 2007 (, upper panel). Within the Indigenous sub-populations, the TB case-fatality rate has generally been lowest among the Inuit (, lower panel).
Figure 14. Reported TB case-fatality rate (CFR) in different population subgroups, CTBRS: 2000-2019.
Note: The Canadian-born Indigenous group is broken down by sub-population in the lower panel. Abbreviations: TB, tuberculosis; CTBRS, Canadian TB Reporting System.
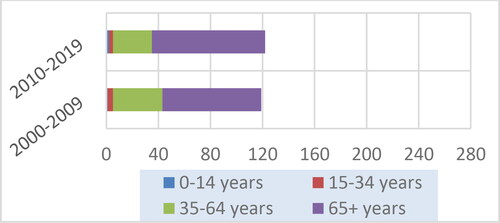
The majority of deaths in Canadian-born, non-Indigenous populations was among those aged 65 years or older, with more than twice as many deaths in this age group compared to the 35-64 age group over the time period (). The lowest mortality has been among children (aged 0-14 years of age), with only three deaths in total over the past 2 decades ().
Figure 15. Reported TB-related deaths in the Canadian-born, non-Indigenous population, CTBRS: 2000-2019.Abbreviations: TB, tuberculosis; CTBRS, Canadian TB Reporting System.
2.6.1.3 TB-related mortality in foreign-born populations
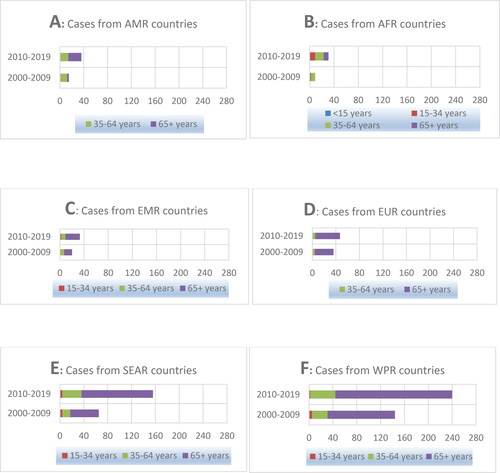
The majority of TB-related deaths among foreign-born individuals in the last 2 decades in Canada occurred among older individuals, aged 65 years or older, who were born in the Western Pacific and South-East Asia regions (), which reflects the high TB burden observed in individuals coming from these 2 regions (). The lowest annual TB mortality among foreign-born individuals has been consistently found among individuals born in the European, African, Eastern Mediterranean and Americas regions ().
Figure 16. Reported TB-related deaths among foreign-born Canadians and Canadian residents, CTBRS: 2000-2019.Abbreviations: TB, tuberculosis; CTBRS, Canadian TB Reporting System. AMR, Americas region; AFR, African region; EMR, Eastern Mediterranean region; EUR, European region; SEAR, South East Asian region; WPR, Western Pacific region.
The case-fatality rate in foreign-born individuals has been variable, ranging from a low of 0.9% in 2003 to a high of 6.5% in 2015. After remaining stable at around 5.0% from 2016 to 2018, it dropped to 3.5% in 2019 (, upper panel).
2.7. Drug resistance
Detailed information on TB-related drug resistance in Canada is collected through the Canadian Tuberculosis Laboratory Surveillance System (CTBLSS). Between 2009 and 2020, 20,546 individuals were reported with TB disease. Isolates from 81.6% (16,766) were subjected to susceptibility testing, of which 1,598 (9.5%) showed resistance to anti-TB drug(s) (). The majority of individuals reported with drug-resistant TB (83.2%; n = 1,329) had mono-resistance, primarily resistance to isoniazid (INH) (n = 1,072) or pyrazinamide (PZA) (n = 225). Multi- and polydrug resistance accounted for approximately 13% (n = 206) and 3.6% (n = 57) of all TB-resistant isolates, respectively. Extensively drug-resistance has been very sporadic and limited to a maximum of one individual per year. These trends have been stable over time ().
Figure 17. Reported drug-resistant TB (%) over time, CTBLSS: 2009-2020. Abbreviations: TB, tuberculosis; CTBRS, Canadian TB Reporting System.
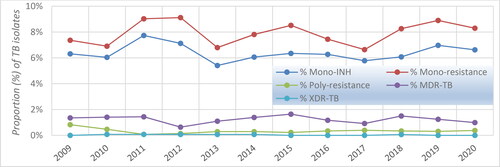
Table 9. Reported drug-resistant TB over time, CTBLSS: 2009-2020.
In general, poly- and multidrug-resistance were found almost exclusively in isolates from foreign-born individuals, while mono-resistance (dominated by INH-resistance) was detected in individuals from all population groups. Additional details on TB drug resistance in Canada are available in Chapter 8: Drug-Resistant Tuberculosis.
3. Conclusions
As detailed in this chapter, there are pronounced disparities in Canada regarding TB. Certain populations and geographic regions continue to be disproportionately affected. In addition to foreign-born and Indigenous populations in Canada, those who are incarcerated or experience homelessness also show higher incidence rates of active TB disease, as will be outlined in subsequent chapters of these Standards. There are numerous determinants of health that relate to TB, including education, employment, physical environment, social support, access to health services, personal health practices and culture. Addressing health inequities and the underlying determinants of health is universally recognized by TB experts as being an integral component of TB prevention and response, both in CanadaCitation8 and globally.Citation9,Citation10
Additionally, ongoing collaboration with community partners, key stakeholders and governments, enhancement of TB surveillance data and evaluation of TB programs are needed to effectively address and reduce TB-related inequities and burden in Canada. Enhancing TB surveillance data would require a comprehensive integration of the different components of the current surveillance program (eg, clinical, laboratory, treatment), an expansion to include subclinical TB, as well as the use of new tools such as whole genome sequencing, which could greatly support outbreak investigation and control.
A collaborative, multi-faceted approach is needed to meet these aims and, ultimately, eliminate TB in Canada, as noted in the 2018 Chief Public Health Officer (CPHO) report on eliminating TB in Canada.Citation8 Specifically, continued engagement with communities by all levels of government and effective coordination of TB surveillance and programmatic areas can help ensure interventions are appropriately tailored for specific groups and are evidence-informed. This is essential to help reduce disparities and improve TB diagnosis, monitoring, treatment outcomes and, ultimately, TB prevention.
The Canadian Tuberculosis Laboratory Surveillance System Contributing Provincial/Territorial Partners
The Canadian Tuberculosis Reporting System Contributing Provincial/Territorial Partners
Acknowledgments
The Public Health Agency of Canada (Centre for Communicable Diseases and Infection Control and National Microbiology Laboratory) would like to acknowledge the valuable contributions of the provincial and territorial tuberculosis programs and their teams to the Canadian Tuberculosis Reporting System and the Canadian Tuberculosis Laboratory Surveillance System. Without their participation, this report would not have been possible.
Disclosure statement
The CTS TB Standards editors and authors declared potential conflicts of interest at the time of appointment and these were updated throughout the process in accordance with the CTS Conflict of Interest Disclosure Policy. Individual member conflict of interest statements are posted on the CTS website.
Funding
The 8th edition Canadian Tuberculosis Standards are jointly funded by the Canadian Thoracic Society (CTS) and the Public Health Agency of Canada, edited by the CTS and published by the CTS in collaboration with AMMI Canada.However, it is important to note that the clinical recommendations in the Standards are those of the CTS. The CTS TB Standards editors and authors are accountable to the CTS CRGC and the CTS Board of Directors. The CTS TB Standards editors and authors are functionally and editorially independent from any funding sources and did not receive any direct funding from external sources.The CTS receives unrestricted grants which are combined into a central operating account to facilitate the knowledge translation activities of the CTS Assemblies and its guideline and standards panels. No corporate funders played any role in the collection, review, analysis or interpretation of the scientific literature or in any decisions regarding the recommendations presented in this document.
Notes
References
- World Health Organization. Global Tuberculosis Report. 2020.
- Kiprop V. Canadian Provinces And Territories By Indigenous Population. https://www.worldatlas.com/articles/canadian-provinces-and-territories-by-indigenous-population.html.
- Kilabuk E, Momoli F, Mallick R, et al. Social determinants of health among residential areas with a high tuberculosis incidence in a remote Inuit community. J Epidemiol Community Health. May 2019;73(5):401–406. doi:10.1136/jech-2018-211261.
- Clark M, Riben P, Nowgesic E. The association of housing density, isolation and tuberculosis in Canadian First Nations communities. Int J Epidemiol. 2002;31(5):940–945. doi:10.1093/ije/31.5.940.
- Khan FA, Fox GJ, Lee RS, et al. Housing and tuberculosis in an Inuit village in northern Quebec: a case-control study. CMAJ Open. 2016;4(3):E496–E506. doi:10.9778/cmajo.20160049.
- Jetty R. Tuberculosis among First Nations, Inuit and Métis children and youth in Canada: Beyond medical management. Paediatr Child Health. 2021;26(2):e78–e81. doi:10.1093/pch/pxz183.
- Statistics Canada. Citizenship (5), Place of Birth (272), Immigrant Status and Period of Immigration (11), Age (12) and Sex (3) for the Population in Private Households of Canada, Provinces and Territories, Census Metropolitan Areas and Census Agglomerations, 2016 Census - 25% Sample Data. 2017;
- Public Health Agency of Canada. CPHO SPOTLIGHT ON ELIMINATING TUBERCULOSIS IN CANADA. 2018.
- Lonnroth K, Raviglione M. Global epidemiology of tuberculosis: prospects for control. Semin Respir Crit Care Med. 2008;29(5):481–491. doi:10.1055/s-0028-1085700.
- Rasanathan K, Sivasankara Kurup A, Jaramillo E, Lonnroth K. The social determinants of health: key to global tuberculosis control. Int J Tuberc Lung Dis. 2011;15 Suppl 2:30–36. doi:10.5588/ijtld.10.0691.