
ABSTRACT
Despite its crucial role for social scientists, the concept of social class remains elusive and its measurement inconsistent. Building on the class voting literature, this study presents an updated assessment of the explanatory power of vote of objective class indicators (occupation, income and education) and subjective class measures. To do so, it uses three class schemes commonly used in survey questionnaires: two of them refer to the lowest categories as ‘lower’ or ‘working’ class alternatively, while the third one uses a numerical scale. This article scrutinizes (a) the link between objective indicators and subjective class, (b) the association between the two sets of measures and voting behaviour and ideology and (c) the influence of different subjective class measurements on the results. Based on an experimental survey fielded in Catalonia, the results show that different subjective class schemes result in substantially different distributions of class identities. Despite these differences, all subjective class measures appear to be more robustly associated with political preferences and behaviour than objective indicators. Once subjective class is controlled for, the significance of the association between objective indicators and the dependent variable is influenced by the stratifying power of the survey question used to measure class identity.
Introduction
Surveys capture respondents’ social class using objective indicators like occupation, income or education or relying on their expressed subjective class identity. Most social research on political behaviour uses alternatively one of the two, despite the fact that they often differ (D’Hooge, Achterberg, and Reeskens Citation2018). Thus, choosing one or the other to predict vote might lead to very different results. Moreover, there is no consensus on the literature regarding how to measure either of them. This article aims at contributing to the understanding of class measurement by providing an updated account of the link between objective and subjective class and their influence on political behaviour or preferences using different measurements.
Sociologists and political scientists have largely debated about the association of social class and electoral behaviour and the extent to which this has weakened over time (Clark and Lipset Citation1991; Evans Citation2017; van der Waal, Achterberg, and Houtman Citation2007). The substantial changes and increasing instability of Western electorates since the 1970s have called into question the idea that the structuring effects of social cleavages can predict party choice. In addition to Lipset and Rokkan (Citation1967) classic cleavages (religion, worker-employer, centre-periphery and urban-rural), new dimensions and issues are increasingly influencing electoral behaviour. The emergence of new cleavages like the transnational one implies that the shaping power of prior cleavages diminishes over time, but does not necessarily lead to their disappearance (Hooghe and Marks Citation2018). Thus, despite the decline of the magnitude of differences between social classes, the order in which different strata favour left or right parties is still consistent with the class voting literature (Jansen, Evans, and Graaf Citation2013, 72). Similarly, empirical evidence shows a persistent association between social class and political preferences (Ares Citation2020; Langsæther Citation2019; Langsæther, Evans, and O’Grady Citation2021).
Despite the continued importance of the concept of social class, there is no consensus in the existing literature on how to measure it. In fact, the operationalization of social class is a matter of ongoing debate for social scientists (D’Hooge, Achterberg, and Reeskens Citation2018; Hout Citation2008, 26–28). Social class is sometimes measured using objective indicators like occupation, income, education, or a combination of them. Alternatively, some scholars rely on the subjective identification of respondents to classify them, but different survey questions influence respondents expressed identities differently (Hout Citation2008). Thus, the lack of consensus on how to measure social class is a major challenge for social scientists, in particular for those interested in class politics.
This study compares the stratifying power of different objective and subjective indicators. I rely on the three most common objective indicators, that is occupation, education, and income. As regards the measurement of subjective class, I use data from a survey experiment that randomly assigned two different survey questions on social class identification. The first question uses a categorical class scheme that includes ‘working’ class categories; a second categorical scheme substitutes ‘working class’ by ‘lower class’. Moreover, all respondents were asked an additional self-placement question using a continuous status scale (ranging from 0 to 10). Using these three measurements of subjective class, I control the extent to which using one particular question instead of another influences the distribution of expressed class identity. Moreover, the association between the different subjective class identities and objective indicators is scrutinized.
In a second step, this study examines the explanatory power of voting behaviour and ideology of objective and subjective socioeconomic indicators, while exploring the extent to which measurement can influence the results. Combined, the examinations presented in this article provide a renewed account of the measurement of social class and class voting patterns. To do so, the present study relies on a survey experiment fielded in Catalonia, Spain, in 2018. This context can be thought of as a litmus test for class voting since we expect class-voting patterns to be overshadowed by the independence issue.
The findings suggest that social class retains the explanatory power of vote even in such a context. As regards the measurement of social class, the results show that objective and subjective measures stratify respondents differently. The three operationalizations of subjective social class can partially explain political behaviour and ideology. However, the regression coefficients of objective indicators vary substantially depending on which subjective measure is included in the model.
The remainder of this paper is structured as follows. The second section critically reviews the most common measurements of social class and the association between objective and subjective measures. The third Section describes the case study and the data used in the analysis. The results are presented in the fourth section and the fifth section discusses the implications of the results for the measurement of social class.
The measurement of social class
This section provides an overview of the main operationalizations of social class. After reviewing the most common indicators of objective social class, I discuss how the use of different categorizations influences the study of subjective class. Finally, I address the relationship between objective and subjective class.
Objective class
Objective social class can be thought of as prolonged access (or exclusion) from critical resources (Kraus, Piff, and Mendoza-Denton Citation2012). In other words, we can think of a class as ‘how people earn their money, how much money they have, or what they do with their money’ (Hout Citation2008, 26). The most common objective measures of socioeconomic status are occupation (see Erikson and Goldthorpe Citation1992; Langsæther Citation2019), income (see Bartels Citation2008; Leighley and Nagler Citation2007) and education (see Bartels Citation2006). A review of the operationalization of social class in organizational studies finds that over 67% of social class measures account for one of these three main objective indicators: occupation, education, and income (Loignon and Woehr Citation2018, 75–76). By contrast, only 5% of measures refer to the subjective class.
The effect of the different objective indicators on value orientations tends to run in parallel. For instance, Welzel (Citation2013) finds a quasi-universal pattern suggesting that emancipative values are more pronounced among white-collar workers than among blue-collar workers, more among high-income earners than among low-income earners, and more among people with a university education than among people with little or no education (Welzel Citation2013, 99). At the same time, not all objective indicators have the same influence on policy preferences or voting behaviour: income cleaves citizens on the economic dimension (Romero-Vidal and Van Hauwaert Citation2021), while education cleaves citizens on the noneconomic dimension. Kitschelt and Rehm (Citation2019) show that the crossed pressures of education and income on economic and cultural matters can explain voters realignment in the US and, more generally, that focusing on a single objective indicator might not suffice to explain electoral behaviour.
Relying on education only might be problematic due to the heterogeneity of life chances of people with similar educational backgrounds (Manza and Brooks Citation1999; Sosnaud, Brady, and Frenk Citation2013). Relying exclusively on income might also problematic: income responses are more susceptible to bias resulting from respondents’ reluctance to disclose it, and prone to error because of vagueness regarding what to include as income (Evans Citation2017, 178). As a result, using income as a stratifying variable leads to more missing observations than relying on occupation (Fernández and Jaime-Castillo Citation2018).
Occupation-based measures are expected to be more stable over time and to account simultaneously for income, working conditions, career prospects and, to a large extent, lifetime expected earnings (Goldthorpe and McKnight Citation2006). However, the tertiarization of the employment structure in post-industrial societies introduces greater heterogeneity in the occupational configuration.Footnote1 The complexity of the evolving occupational structure translates into a large variation of the number of categories used to rank occupational schemes, ranging from 2 to 17 in most studies (Loignon and Woehr Citation2018, 75), but going up to the 126 ‘micro classes’ put forward by Weeden and Grusky (Citation2005). In order to deal with such complexity, the Standard International Occupational Prestige Scale (SIOPS; see Ganzeboom and Treiman Citation1996, Citation2003) and the International Socio-Economic Index (ISEI: see Ganzeboom, De Graaf, and Treiman Citation1992) provide internationally comparable measures of occupational status, either by relying on prestige ratings from survey data or on the average income and educational qualifications.Footnote2
Such a large number of operationalizations of social class reveals a lack of consensus, particularly between political scientists and sociologists, as to what measures better capture objective social class.
Subjective class
Subjective class captures the rank-based sense of one’s position within the economic hierarchy (Kraus, Tan, and Tannenbaum Citation2013). Bourdieu (Citation1984) suggests that status is the symbolic aspect of class structure that transcends sheer economic relations. Such subjective feelings of status can drive opinions toward redistribution and other ideological views that justify those positions (Brown-Iannuzzi et al. Citation2015). Consequently, the subjective class can provide us with substantive information about the socio-political orientations and behaviour of respondents.
Previous research on class identity suggests that citizens tend to see themselves in the middle of the social scale regardless of their material situation (Bellani et al. Citation2021; Evans and Kelley Citation2004). This is particularly true in rich countries, where citizens are less likely to identify as ‘lower class’ (Andersen and Curtis Citation2012). Crucially, class identities expressed by survey respondents are conditioned by the question they are asked. When they ask about subjective class, an overwhelming majority of survey questionnaires use closed-ended questions. Class identities expressed in close-ended questions and open-ended ones vary widely: in open questions, respondents are less likely to identify as working class and more likely to identify as middle-class (Hout Citation2008, 30). By contrast, close-ended questions prompt respondents with specific class labels (the possible responses they must choose from), which might affect the relative position respondents pick. In particular, the probability of identifying as lower class is likely to depend on the name used to define it (e.g. lower class or working class) and the number of categories included in a class scheme.
The lack of a standard class categorization in survey questionnaires results in different class schemes to measure subjective class. Some include three categories (which, in turn, may include subcategories): upper, middle and lower class. Some substitute lower for working class, while others include both lower and working class as distinct categories, as in the World Values Survey or the European Elections Study. Since respondents are sensitive to the way in which a question is posed, the different class labels used in questionnaires may lead to substantially different response patterns (Hout Citation2008).
Let us take the surveys fielded in the USA as a case in point. The American National Election Survey (ANES) primes respondents with a dichotomy between middle class versus working class: ‘Most people say they belong either to the middle class or the working class. Do you ever think of yourself as belonging in one of these classes?’. The ANESFootnote3 data shows that between 1948 and 2016, 99.19% of respondents chose one of the two labels they were primed with: 51.63% of respondents identified as working class, whereas 47.56% as middle class. Only 0.45% and 0.13% chose the not mentioned ‘lower’ and ‘upper’ class respectively. Another US-American survey, the General Social Survey (GSS), offers instead a four-point scale that explicitly includes upper, middle, working and lower class. The distribution of subjective class responses between 1972 and 2018 differs when using this alternative scale. When presented this option explicitly, the percentage of respondents identifying as lower class increases to 6.31%, reducing the number of people identifying as working class to 45.6%. Similarly, the proportion of respondents identifying as upper class increases to 3.21%, reducing the number of middle-class responses to 44.87%.Footnote4 The World Values Survey uses a five-point scale, distinguishing between upper, upper middle, lower middle, working and lower class. The results of this survey in the US between 1995 and 2017 suggest that the inclusion of a lower-middle class further reduces de number of respondents choosing working class (28%) or lower class (5.3%).Footnote5
Alternative subjective-class questions result in substantially different distributions of class identities.Footnote6 The different shares of low- and middle-status identities are likely to influence the explanatory power of class as a predictor of policy preferences or electoral behaviour. The largest differences in subjective class responses appear within the lower status categories, which suggests that the inclusion or exclusion of the ‘working class’ category particularly alters the distribution of identities. The labels lower or working class might hold politically charged meanings that influence how people think of them (Kelley and Evans Citation1995). As a consequence, survey questions about social class self-identification are particularly sensitive to the contextual meaning attributed to the words used in the question.
A way to avoid linguistic and cultural biases is to use a numerical scale in which respondents place themselves in a status gradient from 0 to 10. A numerical scale has the additional benefit of enhancing cross-national comparability (Evans, Kelley, and Kolosi Citation1992, 462). Nevertheless, it is unclear that respondents can easily translate their class identities into numbers. For instance, Hoffmeyer-Zlotnik and Krebs (Citation2000) find a low correlation between the self-placement of respondents in categorical and continuous self-ranking scales in Germany. Respondents seem to identify with lower categorical labels while placing themselves in higher positions in the continuous scale. The mismatches between the two call into question the equivalence of continuous and categorical measurements.
Each of the measurements of the subjective social class discussed in this brief review presents some advantages and caveats. The lack of a golden standard to measure social class leaves unanswered the question of which measurement is more useful to study political behaviour.
The relationship between objective and subjective class
Weber’s (Citation1978[1922]) distinction between class and status has often been overlooked and class has been reinterpreted in terms of status (Chan and Goldthorpe Citation2007). As a result, a lot of research relies on a one-dimensional view of stratification that implicitly assumes a direct influence of labour market position on socio-political attitudes and, ultimately, electoral choices. However, rather than alternative measures of a unidimensional concept, social class can be thought of as a complex construct involving both objective socioeconomic characteristics and subjective identities (Bornschier et al. Citation2021).
Social scientists highlight that, together with objective measures of social class, subjective class identification also shapes political orientation (Calhoun Citation1982; Centers Citation1949; Jackman and Jackman Citation1973). In their classic study on social class and status, Bendix and Lipset (Citation1966) argue that in order for material conditions to shape attitudes and behaviour, individuals need to believe and feel that they are in such a position. However, the vast majority of empirical studies using objective social class measures do not control whether this is the case. As a result, the relationship between objective and subjective class is often taken for granted and these categories are sometimes used interchangeably.
Kelley and Evans (Citation1995) find that material conditions are indeed linked to subjective class, and that this association is mostly driven by income and education. This does not mean, however, that this relationship is stable over time. Alexander and Welzel (Citation2017) report that subjective social class correlated equally strongly with education and income in the mid-1990s. In the early 2010s, however, the correlation of subjective social class with education had decreased, while that with income had increased, which speaks for a monetization of class identity (Alexander and Welzel Citation2017, 11). The authors find this association using data from the World Values Survey, which includes both lower- and working-class categories. In order to assess the contemporary link between objective and subjective class and its robustness, I will analyse the influence of income, education and occupation on three different scales of subjective class. Building on the research discussed above, I expect that while education and occupation will be associated with class identity, income should be the stronger predictor of class identity in a post-industrial setting.
The relevance of measurement for class voting
Understanding the relationship between objective and subjective socioeconomic indicators is a necessary step to then assess how social class influences voting behaviour in post-industrial societies. The class voting literature generally posits that economic interests are stratified through social class and that voting behaviour reflects conflicting class interests (Svallfors Citation1997; van der Waal, Achterberg, and Houtman Citation2007). Thus, lower-class citizens would typically vote left-wing parties that would foster redistribution. Higher-class citizens would be more reluctant to support state intervention in the economy and would therefore tend to vote right-wing parties.
Against this backdrop, the increasing salience of the cultural dimension has called into question this classic pattern. In particular, lower-class voters are expected to hold more conservative attitudes on cultural issues, whereas higher-class voters are more progressive on issues like immigration (Van der Brug and Van Spanje Citation2009) or sexuality norms (Alexander and Welzel Citation2017). As a result, voters experience crossed pressures to make their vote choices, which might be triggering a realignment of class voting patterns (Kitschelt and Rehm Citation2019).
Unlike the rest of Europe, the socio-economic dimension during the Great Recession contained the ascendance of a socio-cultural cleavage in Southern Europe (Charalambous, Conti, and Pedrazzani Citation2021). This relative lack of salience of a second dimension might explain why party positions on the economic and cultural dimensions tend to correlate highly. Thus, I rely on an inclusive left-right dimension to assess the extent to which objective and subjective class (based on different measurements) can predict political preferences and electoral behaviour.
Data and measurements
This study relies on an experimental survey fielded in Catalonia (Spain) in November 2018. A priori, the Catalan political arena is quite an adverse case for a study on class voting. Class differences in Spain have been shrinking since the first decade of the 2000s, both in terms of ideology (Medina and Caínzos Citation2018) and electoral behaviour (Orriols Citation2013). Furthermore, Catalonia is a rich post-industrial region, and thus one in which we should find the lowest levels of lower-class identity. More notably, the debate about independence has dominated Catalan politics for the last decade and became a major determinant of vote choice in the 2015 regional elections (Orriols and Rodon Citation2016). Cross-class alliances have been crucial in the surge of support for independence since 2010 (della Porta and Portos Citation2021), and Catalan independentism has decreased the salience of the left-right cleavage as a result. The Catalan electorate thus constitutes a least-likely case for class voting, as it is a particularly adverse context to explain electoral behaviour through the social class. In that sense, the Catalan case provides the litmus test for class voting: if we can find class voting patterns in such a context, we should find them in other post-industrial societies.
To examine the extent to which the use of different variables results in different classifications of respondents, I rely on the Experimental survey on social classes in Catalonia (REO 914), fielded by the Catalan Centre of Opinion Studies (CEO). I focus on three variables related to objective class (occupation, income, and education) and three class schemes used in survey questionnaires. A representative sample of 1803 individuals were asked about their objective and subjective class, using three different measures of subjective class. These data provide a unique opportunity to compare how different subjective-class categorizations influence the distribution of responses. While it is possible to compare different surveys using different scales, the differences in responses in separate surveys might be caused by different sampling strategies, questionnaire design or timing of the fieldwork. In this case, the question on subjective class is the only difference across groups of respondents, ensuring that differences are not caused by other external factors.
All respondents were asked to place themselves on a continuous status scale, ranging from 0 (lowest status) to 10 (highest status). Additionally, the questionnaire included two alternative questions using different categorical class schemes. Half of the sample (922 respondents) were asked to place themselves in a class scheme including lower class as the lowest category, whereas the other half (901 respondents) were presented with a scale which used the label working class instead.Footnote7 Hereafter, this categorization offering ‘working class’ responses will be referred to as the working-class scheme, while the categorization using the lower class label will be referred to as lower-class scheme.
In order to get a sense of the stratifying power of objective and subjective class categories, I create three broad low- middle- and high-status categories across different indicators, as listed in .
Table 1. Categorization of objective and subjective class variables.
displays the distribution of respondents across objective and subjective classifications. The first three bars show the weighted composition of the social class groups as a function of objective measures. Interestingly, income and occupation result in similar aggregate groups close to terciles. By contrast, groups by education are less balanced, due to a larger share of individuals with tertiary education (48%). According to OECD, 38.6% of Spanish citizens between 25 and 64 years have attained tertiary education. Thus, even when relying on the weighted proportions, there is an overrepresentation of well-educated citizens in the survey sample.
Figure 1. Percentage of respondents in each social class using different indicators.
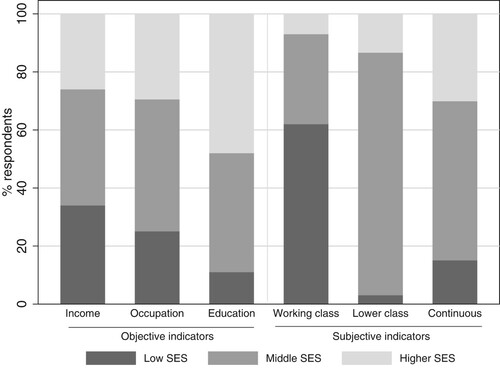
The next three bars show the distribution of subjective class identities. At first glance, it is noticeable that more respondents choose working class than the alternative low-status options. Over 60% of respondents identify as working class, outnumbering the number of low- and middle-class respondents according to the objective measures. By contrast, when using the lower-class scheme, the middle class is largely overrepresented (83.6% of respondents) and only 3% of respondents identify as a lower class. Lastly, the continuous 11-point scale produces a relatively more balanced distribution of status perceptions, closer to that of the objective measures.
The descriptive statistics of reveal great discrepancies between and within the objective and subjective dimensions of social class, particularly within the latter. In what follows, I explore how each objective and subjective component relate to each other and how they influence electoral behaviour and ideology. To do so, I use the original values for each variable: income has eleven categories with monthly income ranges; education is coded in four groups (less than high school, secondary education, university degree, master/PhD); occupation is grouped in nine categories (from lower to higher SES: elementary occupations, unskilled workers, semi-skilled workers, skilled workers, services, clerical workers, technicians, higher technicians, and managers)Footnote8 As regards subjective class, all models use the original response options displayed in . To measure left-right vote, I use the reported vote in the 2018 Catalan electionsFootnote9, in which seven parties entered the resulting parliament.Footnote10 Each party has a left-right score from the Regional Manifestos Project Dataset (Gómez, Alonso, and Cabeza Citation2020), which is attributed to each respondent that voted for it.Footnote11 Moreover, I use a left-right self-placement question (seven points) to assess the influence of social class on political preferences. To facilitate the comparison of coefficients across models and given the different number of categories across subjective class schemes, all variables are normalized between minimum 0 and maximum 1.
Results
The first step of the empirical analysis is to examine the link between objective measures (occupation, income, and education) and subjective class. Do objective indicators explain class identity? Is the response to this classic question influenced by the different measurements of subjective class? shows the effects of a set of socio-demographic variables on subjective class using the three alternative measurements in three separate OLS regressions. In the first model, the dependent variable is class identification of those who were asked the working-class scheme question, the second model uses responses to the question using the lower-class scheme, and in the third model responses to the continuous scale question. In all cases, higher coefficients indicate higher subjective socioeconomic status.
Table 2. Effects of objective indicators on subjective class using different schemes.
According to these models, education is positively associated with class identity, indicating that higher educational attainment tends to lead to higher perceptions of social status. This result holds across subjective class measurements. The regression coefficient for occupation is also a positive and significant one in the three models, indicating that higher-ranking occupations are associated with higher-class identification. Lastly, income also has a positive and significant association with subjective class, regardless of its operationalization. The size of the coefficient clearly surpasses that of education and occupation. This is consistent with the shift from occupation to income-based subjective class identities reported by Alexander and Welzel (Citation2017, 11).
The link between objective and subjective measures indicates that, as expected, objective indicators significantly influence class identity. Income seems to influence subjective class the most, while occupation and education have a relatively smaller effect. Despite this positive relationship between objective and subjective indicators, the distribution of responses in shows that subjective class identities do not necessarily correspond to one’s position in the income, education or occupation ranks. That is, while the association between objective and subjective class is a positive one, this does not ensure that class identification is fully consistent with objective class indicators.
The models in also include controls for gender and religiosity. These variables do not seem to have a significant effect on class identity, except for non-religious individuals, who appear to identify as lower class than Catholics. Age does not have a significant effect when using the lower-class scheme or the continuous variable. Interestingly, older respondents tended to choose higher subjective class responses in the working-class scheme, suggesting that older individuals are more reluctant to identify as working class than younger ones, all other conditions being equal. This suggests that different class labels might influence responses differently to various subpopulations. As will be shown, this might affect in turn the results of subsequent analysis using these variables.
Let us now turn to the comparison of the influence of objective and subjective class on political preferences and vote choice. presents the results of six OLS regression analyses for left-right vote and left-right self-placement. The first three columns take voting behaviour as a dependent variable, using left-right scores of the party voted for each respondent, while the next three columns take self-placement as a dependent variable. The results indicate that the association between subjective class and both voting behaviour and ideology is robust. Regardless of the class scheme used to capture it, higher class identification is linked to more conservative votes and values.
Table 3. The influence of different social class measurements on left-right vote and self-placement.
In contrast to the consistent results for subjective class indicators, objective indicators do not retain much explanatory power once we control for subjective class. Objective indicators still display some significant association with the vote, although not robust. Income would have a positive and significant effect on the vote in two of the three models, suggesting that higher income is associated with support for more conservative parties. However, when using the lower-class scheme, the coefficient loses significance and even changes its sign. The occupational category is only significantly related to vote when measuring subjective class using the lower-class schemeFootnote12, but not for the others. Finally, educational attainment does not appear to relate to left-right vote in any model. When modelling left-right self-placement, the three objective indicators (income, occupation and education) fail to predict ideological orientations once the subjective class is accounted for.
The models in include again some controls like age or gender, which appear not to be significant. On the other hand, religiosity seems to retain some predictive power. Non-religious voters tend to vote more left-wing parties that Catholics; non-Catholic religious individuals seem to also vote more progressive parties, but the coefficient is only significant when using the continuous scale. The controls preserve more explanatory power for ideology than for the vote. Female respondents appear to hold more left-wing preferences across models (and reaching significance in two of them), and again non-religious individuals place themselves more to the left.
When using the working-class scheme, the negative and significant coefficient of age indicates that older people tend to hold more conservative values. This is important, since this age effect does not appear with the other subjective class schemes. As we have seen in , age seems to condition responses to the question using the working class-scheme. If class identification is to partially capture the effect of objective indicators, but this is captured using a question that is responded differently across age groups, subjective class will fail to fully capture its effect on ideology and age will retain explanatory power.
These results seem to indicate that subjective class self-identification can predict both ideology and voting behaviour more accurately than objective class indicators. As regards the different measurements of subjective class, all schemes capture a positive relationship with conservative vote or ideology. However, the extent to which objective indicators retain explanatory power after controlling for subjective class seems to depend on how we measure the latter.
The regression analyses in show how different subjective class schemes influence the results for other variables. When using the working-class scheme or the continuous scale to predict vote, only income appears to have a significant effect, which cannot, therefore, be mediated by subjective class. By contrast, when using the lower-class scheme, the only objective class indicator that appears to be associated with voting behaviour is occupation instead of income. Using the working-class scheme to predict ideology, age also appears to have a significant effect, which is not present in the models using alternative subjective class schemes. As already discussed, the relative reluctance of older respondents to identify as a working class would result in a less explanatory power of class identity for the group that expresses class identities in a systematically different way.
If class identification mediates the effects of objective indicators on political preferences and behaviour, these results suggest that different operationalizations capture these indirect effects to different extents. Although all subjective class measures are significantly influenced by sociodemographic and socioeconomic characteristics (see ), the extent to which the identities expressed in survey responses can capture the effects of objective indicators varies widely ().
Discussion and conclusions
This article reviews the operationalization of social class considering both objective and subjective class measures. Using data from a survey fielded in Catalonia in 2018, this study assesses the extent to which different measurements of social class influence the study of voting behaviour or ideology. Moreover, it provides an updated account of the link between objective indicators and subjective class identity and their association with vote and ideology.
To do so, this study relies on three survey questions asking respondents to choose the social class they identify with from a list of pre-established labels. The first question includes ‘working’ class categories as an option; the second one uses ‘lower class’ instead, and the third one uses a numerical status scale ranging from 0 to 10. The distribution of the social class identities expressed by respondents’ changes substantially depending on the question asked. The working-class scheme results in a large lower-status group, while not including it produces substantially larger middle categories. These differences are likely to stem from the political meaning attached to the different labels (Kelley and Evans Citation1995) or to the differences in the number of subcategories. It is also possible that a majority of respondents identify as working class simply because they work for a living, regardless of their perceived rank-based position on the social scale. In that regard, the continuous scale offers a good alternative, as it avoids using specific labels whose meaning might influence responses and change from context to context. In addition to the increased comparability of numerical scales, the distribution of subjective class responses using it is closer to that of objective indicators.
Although each objective and subjective class measurement results in substantially different stratifications, they are not independent. As shown in this study, and in line with previous research, objective conditions play an important role in determining class identity. Income is the stronger predictor of subjective class, while education and occupation also contribute to class identification to a smaller degree. This is consistent with the notion that income has increased its influence on the subjective class at the expense of occupation over the last decades (Alexander and Welzel Citation2017, 11; Hout Citation2008, 46).
Since the subjective class is at least partially a result of objective conditions, it is reasonable to assume that the effect of income, education and occupation on vote or ideology is mediated by class identification. This study compares the direct influence of objective and subjective class on the vote, showing that the relative effect sizes of the two depend on how they are measured and, potentially, the extent to which subjective measures capture the effect of objective indicators. When controlling for subjective class, objective indicators retain some explanatory power of voting behaviour. Income has the strongest influence on class identification, and it still does a better job at predicting vote than education or occupation. As expected, higher income increases the probability to vote conservative parties. Occupation and education seem to play a minor role in voting behaviour, at least once the subjective class is accounted for. Similarly, when subjective class is included in the models, none of the objective class indicators exhibit any significant association with ideology.
In contrast to these results, the effects of subjective class on voting behaviour are robust: they appear to be significant across models and while controlling for objective indicators. Higher subjective class increases the chances to vote for a right-wing party. Similarly, when modelling ideological self-placement, only subjective measures of class appear to be able to predict it. This is consistent with previous research showing that, since the 1970s, left-right political orientations have become increasingly associated with ‘social identities’, at the expense of the role of the objective position within the social structure (Freire Citation2006).
What difference does using a specific operationalization of subjective class make? The different operationalizations of the subjective class show similar associations to voting behaviour or ideology, indicating that higher class is linked to more conservative vote or ideology. However, using different subjective class measures might shape the results for objective indicators in various ways. The case of the working-class scheme illustrates this point clearly: since a majority of respondents identify as working class, this question cannot capture the indirect effect of income, which retains significant explanatory power. Moreover, older respondents identified less with the working-class label (potentially because they are retired and thus might not think of themselves as workers). This might explain why age appears to have a significant effect on ideological self-placement when controlling for the subjective class using the working class-scheme, but not for the others.
Overall, this study shows that the measurement of subjective social class can influence the study of class voting in an indirect way. Thus, the findings presented here uncover an important challenge: responses to subjective class questions are deeply influenced by the categories included in the question and different population subgroups might respond to class labels differently. As a result, different operationalizations of social class can absorb the effects of objective indicators to different extents.
While there is no one-size-fits-all solution, social scientists can find ways to address this issue. If designing a questionnaire, researchers and pollsters should account for the potential biases that a specific class scheme can trigger in a specific context. If using survey datasets that include both objective and subjective class indicators, scrutinizing the association between the two prior to using them as separate independent or control variables can help interpreting the results. Establishing the (lack of) association between objective indicators and class identity can help us interpret the association of social class with any dependent variable and the extent to which this association is absorbed by subjective class identification. Researchers interested in tracing the causal mechanism can rely on structural equation models to control the covariance between objective indicators and, more importantly, estimate their direct and indirect effects on voting behaviour and the extent to which these are mediated by class identification.
More research is needed to overcome the measurement challenges discussed in this paper. Given the importance of the contextual meaning of different wordings used in survey questionnaires, further research should study the effects of different questions on social class in a comparative setting. While this study provides evidence of class voting and its measurement challenges in an adverse context, we need comparative evidence to identify response patterns across countries and cultural zones. Due to data availability, this study cannot control for the effect of the number of categories in different class schemes. Thus, more research on how altering the number of categories (keeping the wording constant) might influence the distribution of expressed class self-identification is needed. Future studies should also consider the prompting effect of survey questions including simultaneously working-class and lower-class categories. These caveats aside, this study provides new insights about the measurement of social class, showing that different indicators produce substantially different groups and that this, in turn, can affect the observed effects of objective and subjective class on voting behaviour and ideological orientations.
Acknowledgements
I thank Mario Serrano, Pol Bargués, Sebastian Dellepiane, Juan J. Fernández, Sadhbh Juárez, Steven M. Van Hauwaert, Christian Welzel and the anonymous reviewers for their helpful comments and suggestions. Institutional and financial support were provided by the Leuphana University of Lüneburg and the Ministry for Science and Culture of Lower Saxony (Germany).
Disclosure statement
No potential conflict of interest was reported by the author(s).
Additional information
Funding
Notes
1 In order to deal with this increasing heterogeneity, we can distinguish occupational categories vertically (the level of marketable skills required in the job) and horizontally (as regards the nature of work or work logic) (Oesch Citation2006). Due to the wide range of variables discussed in this article, I treat occupational categories in a single main dimension.
2 For a review of occupation-based social classifications for social survey research, see Connelly, Gayle, and Lambert (Citation2016).
3 Source: Time Series Cumulative Data File (1948–2016) of the American National Election Studies.
4 Source: Cumulative data file (1972-2018) of the General Social Survey.
5 Source: World Values Survey Time Series (1981–2017).
6 The different results might also be the result of different sample designs or coverage of the overall design. Thus, the fact that this study relies on a single survey enhances the comparison of different questions.
7 The exact wording of the questions was: ‘From the following list, what social class do you think you belong to?’ (‘Del següent llistat, a quina classe social creu que pertany?’) and ‘In a social scale in which 0 represents the lowest social class and 10 the highest one, in which point would you place yourself?’ (‘En una escala social, en la qual 0 representa la classe social més baixa i 10 la més alta, en quin punt es situaria?’)
8 Categories (10) military occupations and (11) non-workers/living on capital gains are omitted. Combined, the two categories comprise 14 observations.
9 While regional elections are sometimes thought of as second-order elections, Spanish regional elections are not dependent on the national level but rather autonomous from it (Liñeira Citation2016)
10 Non-voters or voters of unspecified parties are treated as missing values.
11 As a robustness test, all models have been replicated using an alternative measure of party ideology. Specifically, I use data from a post-electoral survey to attribute an ideological score to each party. Respondents were asked to place each party on a 1–10 left-right ideological scale. I take the average score of each party and impute it to each recalled vote in the survey experiment. Using the alternative measurement of party ideology does not change the results.
12 The negative coefficient indicates that the lower occupational category is associated with support for left-wing parties, as expected.
References
- Alexander, A. C., and C. Welzel. 2017. “The Myth of Deconsolidation: Rising Liberalism and the Populist Reaction.” Journal of Democracy (28): 1–14.
- Andersen, R., and J. Curtis. 2012. “The Polarizing Effect of Economic Inequality on Class Identification: Evidence from 44 Countries.” Research in Social Stratification and Mobility 30 (1): 129–141. doi:https://doi.org/10.1016/j.rssm.2012.01.002.
- Ares, M. 2020. “Changing Classes, Changing Preferences: how Social Class Mobility Affects Economic Preferences.” West European Politics 43 (6): 1211–1237. doi:https://doi.org/10.1080/01402382.2019.1644575.
- Bartels, L. M. 2006. “What’s the Matter with What’s the Matter with Kansas?” Quarterly Journal of Political Science 1 (2): 201–226. doi:https://doi.org/10.1561/100.00000010
- Bartels, L. M. 2008. Unequal Democracy: The Political Economy of a New Gilded Age. Princeton: Princeton University Press.
- Bellani, L., N. Bledow, M. R. Busemeyer, and G. Schwerdt. 2021. When Everyone Thinks They’re Middle-Class: (Mis-)Perceptions of Inequality and Why They Matter for Social Policy. Policy Paper 06. Konstanz: Das Progressive Zentrum e. V.
- Bendix, R., and S. M. Lipset. 1966. Class, Status, and Power: Social Stratification in Comparative Perspective. New York: Free Press.
- Bornschier, S., S. Häusermann, D. Zollinger, and C. Colombo. 2021. “How ‘Us’ and ‘Them’ Relates to Voting Behavior – Social Structure, Social Identities, and Electoral Choice.” Comparative Political Studies. doi:https://doi.org/10.1177/0010414021997504.
- Bourdieu, P. 1984. Distinction: A Social Critique of the Judgement of Taste. Cambridge: Harvard University Press.
- Brown-Iannuzzi, J. L., K. B. Lundberg, A. C. Kay, and B. K. Payne. 2015. “Subjective Status Shapes Political Preferences.” Psychological Science 26 (1): 15–26. doi:https://doi.org/10.1177/0956797614553947.
- Calhoun, C. 1982. The Question of Class Struggle: Social Foundations of Popular Radicalism During the Industrial Revolution. Chicago, IL: University of Chicago Press.
- Centers, R. 1949. The Psychology of Social Classes. The Psychology of Social Classes. Princeton: Princeton University Press.
- Chan, T. W., and J. H. Goldthorpe. 2007. “Class and Status: The Conceptual Distinction and its Empirical Relevance.” American Sociological Review 72 (4): 512–532. https://doi.org/https://doi.org/10.1177/000312240707200402.
- Charalambous, G., N. Conti, and A. Pedrazzani. 2021. “Issue Salience and Party Competition in Southern Europe Before and After the Euro Crisis: The Primacy of the Economy Holding Back Cultural Issues.” Journal of Elections, Public Opinion and Parties 0 (0): 1–20. doi:https://doi.org/10.1080/17457289.2021.1908312.
- Clark, T. N., and S. M. Lipset. 1991. “Are Social Classes Dying?” International Sociology 6 (4): 397–410. doi:https://doi.org/10.1177/026858091006004002.
- Connelly, R., V. Gayle, and P. S. Lambert. 2016. “A Review of Occupation-Based Social Classifications for Social Survey Research.” Methodological Innovations 9. doi:https://doi.org/10.1177/2059799116638003.
- della Porta, D., and M. Portos. 2021. “ A Bourgeois Story? The Class Basis of Catalan Independentism.” Territory, Politics, Governance 9 (3): 391–411. doi:https://doi.org/10.1080/21622671.2020.1737208.
- D’Hooge, L., P. Achterberg, and T. Reeskens. 2018. “Imagining Class: A Study Into Material Social Class Position, Subjective Identification, and Voting Behavior Across Europe.” Social Science Research 70: 71–89. doi:https://doi.org/10.1016/j.ssresearch.2017.11.003.
- Erikson, R., and J. H. Goldthorpe. 1992. The Constant Flux: A Study of Class Mobility in Industrial Societies. Oxford: Clarendon Press.
- Evans, G. 2017. “Social Class and Voting.” In The SAGE Handbook of Electoral Behavior, edited by K. Arzheimer, J. Evans, and M. S. Lewis-Beck, 177–198. London: SAGE.
- Evans, M. D. R., and J. Kelley. 2004. “Subjective Social Location: Data from 21 Nations.” International Journal of Public Opinion Research 16 (1): 3–38. doi:https://doi.org/10.1093/ijpor/16.1.3.
- Evans, M. D. R., J. Kelley, and T. Kolosi. 1992. “Images of Class: Public Perceptions in Hungary and Australia.” American Sociological Review 57 (4): 461–482. doi:https://doi.org/10.2307/2096095.
- Fernández, J. J., and A. M. Jaime-Castillo. 2018. “The Institutional Foundation of Social Class Differences in Pro-Redistribution Attitudes: A Cross-National Analysis, 1985–2010.” Social Forces 96 (3): 1009–1038. doi:https://doi.org/10.1093/sf/sox068.
- Freire, A. 2006. “Bringing Social Identities Back In: The Social Anchors of Left-Right Orientation in Western Europe.” International Political Science Review 27 (4): 359–378. doi:https://doi.org/10.1177/0192512106067358.
- Ganzeboom, H. B. G., P. M. De Graaf, and D. J. Treiman. 1992. “ A Standard International Socio-Economic Index of Occupational Status.” Social Science Research 21 (1): 1–56. doi:https://doi.org/10.1016/0049-089X(92)90017-B.
- Ganzeboom, H. B. G., and D. J. Treiman. 1996. “Internationally Comparable Measures of Occupational Status for the 1988 International Standard Classification of Occupations.” Social Science Research 25 (3): 201–239. doi:https://doi.org/10.1006/ssre.1996.0010.
- Ganzeboom, H. B. G., and D. J. Treiman. 2003. “Three Internationally Standardised Measures for Comparative Research on Occupational Status.” In Advances in Cross-National Comparison: A European Working Book for Demographic and Socio-Economic Variables, edited by J. H. P. Hoffmeyer-Zlotnik, and C. Wolf, 159–193. Boston, MA: Springer US. doi:https://doi.org/10.1007/978-1-4419-9186-7_9.
- Goldthorpe, J. H., and A. McKnight. 2006. “The Economic Basis of Social Class.” In Mobility and Inequality: Frontiers of Research in Sociology and Economics, edited by S. L. Morgan, D. B. Grusky, and G. S. Fields, 109–136. Stanford: Stanford University Press.
- Gómez, B., S. Alonso, and L. Cabeza. 2020. “Regional Manifestos Project Dataset.” www.regionalmanifestosproject.com.
- Hoffmeyer-Zlotnik, J. H., and D. Krebs. 2000. “Effects of Rank Versus Category in Measuring Subjective Social Inequality.” In Developments in Survey Methodology, edited by A. Ferligoj and A. Mrvar, 93–108. Ljubljana: University of Ljubljana.
- Hooghe, L., and G. Marks. 2018. “Cleavage Theory Meets Europe’s Crises: Lipset, Rokkan, and the Transnational Cleavage.” Journal of European Public Policy 25 (1): 109–135. doi:https://doi.org/10.1080/13501763.2017.1310279.
- Hout, M. 2008. “How Class Works: Objective and Subjective Aspects of Class Since the 1970s.” In Social Class. How Does It Work?, edited by A. Lareau and D. Conley, 25–64. New York: Russell Sage Foundation.
- Jackman, M. R., and R. W. Jackman. 1973. “An Interpretation of the Relation Between Objective and Subjective Social Status.” American Sociological Review 38 (5): 569–582. doi:https://doi.org/10.2307/2094408.
- Jansen, G., G. Evans, and N. D. Graaf. 2013. “Class Voting and Left–Right Party Positions: A Comparative Study of 15 Western Democracies, 1960–2005.” Social Science Research 42 (2): 376–400. doi:https://doi.org/10.1016/j.ssresearch.2012.09.007.
- Kelley, J., and M. D. R. Evans. 1995. “Class and Class Conflict in Six Western Nations.” American Sociological Review 60 (2): 157–178. doi:https://doi.org/10.2307/2096382.
- Kitschelt, H. P., and P. Rehm. 2019. “Secular Partisan Realignment in the United States: The Socioeconomic Reconfiguration of White Partisan Support Since the New Deal Era.” Politics & Society 47 (3): 425–479. doi:https://doi.org/10.1177/0032329219861215.
- Kraus, M. W., P. K. Piff, R. Mendoza-Denton, M. L. Rheinschmidt, and D. Keltner. 2012. “Social Class, Solipsism, and Contextualism: How the Rich are Different from the Poor.” Psychological Review 119 (3): 546–572. doi:https://doi.org/10.1037/a0028756.
- Kraus, M. W., J. J. X. Tan, and M. B. Tannenbaum. 2013. “The Social Ladder: A Rank-Based Perspective on Social Class.” Psychological Inquiry 24 (2): 81–96. doi:https://doi.org/10.1080/1047840X.2013.778803.
- Langsæther, P. E. 2019. “Class Voting and the Differential Role of Political Values: Evidence from 12 West-European Countries.” Journal of Elections, Public Opinion and Parties 29 (1): 125–142. doi:https://doi.org/10.1080/17457289.2018.1464015.
- Langsæther, P. E., G. Evans, and T. O’Grady. 2021. “Explaining the Relationship Between Class Position and Political Preferences: A Long-Term Panel Analysis of Intra-Generational Class Mobility.” British Journal of Political Science, 1–10. doi:https://doi.org/10.1017/S0007123420000599.
- Leighley, J. E., and J. Nagler. 2007. “Unions, Voter Turnout, and Class Bias in the U.S. Electorate, 1964–2004.” The Journal of Politics 69 (2): 430–441. doi:https://doi.org/10.1111/j.1468-2508.2007.00541.x.
- Liñeira, R. 2016. “Second-Order Elections: Everyone, Everywhere?” Regional and National Considerations in Regional Voting. Publius: The Journal of Federalism 46 (4): 510–538. doi:https://doi.org/10.1093/publius/pjw015.
- Lipset, S. M., and S. Rokkan. 1967. Party Systems and Voter Alignments: Cross-National Perspectives. New York: Free Press.
- Loignon, A. C., and D. J. Woehr. 2018. “Social Class in the Organizational Sciences: A Conceptual Integration and Meta-Analytic Review.” Journal of Management 44 (1): 61–88. doi:https://doi.org/10.1177/0149206317728106.
- Manza, J., and C. Brooks. 1999. Social Cleavages and Political Change: Voter Alignments and U.S. Party Coalitions. Oxford: Oxford University Press.
- Medina, L., and M. Caínzos. 2018. “Clase e ideología en España: patrones de diferenciación y de cambio.” Revista de Estudios Políticos 0 (181): 97–133. doi:https://doi.org/10.18042/cepc/rep.181.04.
- Oesch, D. 2006. Redrawing the Class Map: Stratification and Institutions in Britain, Germany, Sweden and Switzerland. New York: Palgrave Macmillan.
- Orriols, L. 2013. Social Class, Religiosity, and Vote Choice in Spain, 1979–2008. Oxford: Oxford University Press.
- Orriols, L., and T. Rodon. 2016. “The 2015 Catalan Election: The Independence Bid at the Polls.” South European Society and Politics 21 (3): 359–381. doi:https://doi.org/10.1080/13608746.2016.1191182.
- Romero-Vidal, X., and S. M. Van Hauwaert. 2021. “Polarisation between the rich and the poor? The dynamics and structure of redistributive preferences in a comparative perspective.” International Journal of Public Opinion Research. doi:https://doi.org/10.1093/ijpor/edab015.
- Sosnaud, B., D. Brady, and S. M. Frenk. 2013. “Class in Name Only: Subjective Class Identity, Objective Class Position, and Vote Choice in American Presidential Elections.” Social Problems 60 (1): 81–99. doi:https://doi.org/10.1525/sp.2013.60.1.81.
- Svallfors, S. 1997. “Worlds of Welfare and Attitudes to Redistribution: A Comparison of Eight Western Nations.” European Sociological Review 13 (3): 283–304. doi:https://doi.org/10.1093/oxfordjournals.esr.a018219.
- Van der Brug, W., and J. Van Spanje. 2009. “Immigration, Europe and the ‘New’ Cultural Dimension.” European Journal of Political Research 48 (3): 309–334. doi:https://doi.org/10.1111/j.1475-6765.2009.00841.x.
- van der Waal, J., P. Achterberg, and D. Houtman. 2007. “Class is Not Dead – It Has Been Buried Alive: Class Voting and Cultural Voting in Postwar Western Societies (1956–1990).” Politics & Society 35 (3): 403–426. doi:https://doi.org/10.1177/0032329207304314.
- Weber, M. 1978. Economy and society: An outline of interpretive sociology. University of California Press.
- Weeden, K. A., and D. B. Grusky. 2005. “The Case for a New Class Map.” American Journal of Sociology 111 (1): 141–212. doi:https://doi.org/10.1086/428815.
- Welzel, C. 2013. Freedom Rising: Human Empowerment and the Quest for Emancipation. New York: Cambridge University Press.