
ABSTRACT
The Political Parties Crosswalk (PPC) maps party codes used in questions about party preferences in European cross-national public opinion surveys to Party Facts IDs, which are commonly used identifiers of parties in political science datasets. The PPC, a data linkage tool, supports research that combines data on party support from surveys with characteristics of parties, and in particular, facilitates research that combines data from different survey projects. PPC v.1 covers surveys conducted in Europe in the following projects: European Social Survey, European Values Study, World Values Survey, Asia Europe Survey, Consolidation and Democracy in Central and Eastern Europe, Integrated and United, Life in Transition Surveys, New Baltic Barometer, New Europe Barometer, and selected waves from the Candidate Countries Eurobarometer, Eurobarometer, and the International Social Survey Programme. In addition to describing the scope and properties of PPC, as well as the steps of data processing and quality assurance, we present case studies that illustrate possible applications in substantive and methodological research.
Introduction
With the growing number of datasets available for secondary analysis, standards for coding certain information become increasingly important, as they facilitate combining data from different sources thus creating new opportunities for research. Among datasets with characteristics of political parties, the Party Facts (PF) dataset (Bederke, Döring, and Regel Citation2020; Döring and Regel Citation2019) provides such a standard, and PF IDs are now commonly used in political science datasets, such as ParlGov (Döring and Manow Citation2021) and V-Party (Lührmann et al. Citation2020). The Party Facts ID has not (so far) been adopted as a coding scheme by cross-national survey projects, which frequently include questions about the party the respondent voted for, would vote for, or feels close to.
Political scientists are often interested in analyzing the characteristics of voters together with characteristics of their preferred parties, but linking party-level data with survey data to date required substantial effort to create the necessary recodes. The Political Party Crosswalk maps party codes used in cross-national surveys conducted in Europe to PF IDs to facilitate research that requires linking public opinion surveys with party properties, and in particular to encourage studies that combine data from multiple survey projects, for example, to create time series of support for particular political parties.
The crosswalk format proposes a solution to the limited compatibility of recent efforts in ex-post harmonization of existing survey datasets that rely – solely or partly – on recode scripts, which are hard to read, modify, extend and verify (CitationForthcoming). Crosswalks, on the other hand, are both human-friendly and machine-readable, and can be used in conjunction with different programming languages and software packages. Crosswalks can also be easily extended by adding new survey datasets, alternative codes to match different party-level datasets, as well as additional information and comments for users.
This note is organized as follows. First, we present the surveys and variables, for which PPC provides mapping. Next, we briefly describe the data processing steps, including the selection of the source variables, creating the values table for mapping, assigning target codes and verification. Finally, we present case studies illustrating some of the opportunities of merging survey and party-level data with PPC.
Scope
PPC provides mapping of party codes for data from 53 waves of 12 cross-national survey projects from 41 European countries (according to United Nations Statistics Division Citation2021) between 1981 and 2019. The coverage of countries is quite unequal, and ranges from a single survey in Andorra and two surveys in Kosovo, to 37 surveys in Hungary, 38 in Slovenia, and 39 in Poland. The survey data include information about party preferences and/or voting behaviour of over 1 million respondents and over 1200 political parties or coalitions. The projects with their basic characteristics are listed in , while full information about dataset versions with references are provided in the Appendix and in the documentation accompanying the PPC data.
Table 1. Summary of survey projects, for which responses to questions about party preferences were mapped in PPC.
It is worth noting that a few other initiatives have taken up the task of mapping survey party codes to PF IDs. Party Facts themselves provide crosswalks to numerous other datasets, including surveys: ESS, WVS, Afrobarometer 2016, Latinobarometer and the European Elections Survey 2014 (https://partyfacts.herokuapp.com/data/). The project ‘Old and new boundaries: National Identities and Religion', as part of the documentation, created a mapping for party codes for selected countries for ESS, EVS and ISSP (Bechert et al. Citation2020). Sophie E. Hill has also created a crosswalk for ESS which is available online (Hill Citation2020). PPC contributes crosswalks for additional European survey projects, while at the same time proposing procedures for the documentation of data processing, quality assurance, as well as crosswalk format that facilitates verification and reuse. The existing crosswalks were used as part of the verification strategy for PPC, as we note later.
Outline of data processing
To create PPC, data processing included the following steps:
Data screening.
Selection of candidate survey projects and waves.
Identification of surveys with variables corresponding to questions on party preferences.
Selection of variables for mapping.
Creation of a mapping table with source values of the selected survey variables.
Assigning PF IDs to the source survey codes.
Verification.
Screening survey data and identification of source variables
The scope of the survey data was defined as cross-national survey projects on general population samples of adult populations in European countries that included questions referring to trust in state institutions. Altogether, we screened 83 data files listed in the PPC documentation. In these datasets, we identified 1106 candidate variables, including questions about:
Party the respondent voted for in the last parliamentary election (ASES, CDCEE, EB, ESS, INTUNE, ISSP, LITS, NEB).
Party the respondent would vote for if a parliamentary election was held tomorrow or next Sunday (CCEB, CDCEE, EB, EVS, NBB, NEB, WVS).
Party the respondent feels close to, identifies with, etc. (ASES, CDCEE, EB, ESS, EVS, INTUNE, ISSP, NBB, NEB, WVS).
Party the respondent voted for in the recent election to the European Parliament (EB, INTUNE).
Party the respondent would vote in next elections to the European Parliament (INTUNE).
Questions about presidential elections were excluded due to the domination of questions about parties in the analyzed surveys. Of these 1106 selected variables some were ultimately discarded, if, for example, they were country-specific variables while equivalents being available in a single variable or if they lacked value labels both in the data and in the survey documentation. The final selection includes 974 variables from 41 data files.
Mapping template
The processing of survey metadata, i.e. the variable names and labels, as well as values and value labels, was performed in R (R Core Team Citation2020). To create mapping templates, we extracted value labels from SPSS data files with the packages haven (Wickham and Miller Citation2019) and labelled (Larmarange Citation2019). We created separate mapping tables for each national survey (project-wave-country). This is particularly important if – in a multi-country dataset – in one variable the same codes have different meanings in different countries, as is the case, for example, of ISSP, wave 1991. Further, having separate mappings per survey makes it possible to include in the crosswalk information about the frequencies of responses, which are often useful in identifying parties where value labels are insufficient. The combined mapping templates were exported to a spreadsheet programme. In cases where value labels with explicit party names were not available in the data files, labels from printed documentation (codebooks, questionnaires) were added to the spreadsheet file manually.
Mapping
The coding was performed manually via a custom-made mapping utility, a Python script based on the PyInquirer package, ‘a Python module for collection of common interactive command line user interfaces, based on Inquirer.js’ (Oyetoke Citation2020). The script takes survey metadata from the mapping templates and from the Party Facts data, and displays them next to each other in tree-like feeding lists that facilitate matching of the corresponding items. The coder’s task is to select parties from a given country in the mapping table and match them with selected parties from Party Facts. The work is done country by country. Matched parties are removed from the list and the same applies to countries for which all parties are matched. The resulting matches are saved to a CSV file. The organization, display of data and the automated removal of matched parties substantially improve the efficiency of the coding.
Verification
The multi-step verification included basic checks on the complete crosswalk, such as the screening of all survey value labels that were assigned the same PF ID, as well as investigating cases where a label could not be matched with a PF ID, especially in the case of parties that received many survey responses.Footnote1 We also screened the data to identify large jumps in support for major political parties, however, these large jumps sometimes result from differences in the question type (e.g. party the respondent voted for versus party the respondent would vote for). We return to this issue in the case studies section. Next, we merged PPC with party-level data from the V-Party dataset and ParlGov’s Election dataset to verify the matching with existing high-quality party-level datasets.
Additional checks were performed on the recoded survey data. For example, we verified that in all surveys supporters of electoral winners had higher trust in parliament than supporters of electoral losers (e.g. Martini and Quaranta Citation2019) and scrutinized the few instances where this was not the case. Finally, we verified the coding for ESS and WVS with the mapping tables provided in the Party Facts project, finding almost perfect agreement in the party codes.
Limitations, challenges, and opportunities
We briefly mention the main challenges encountered during the mapping. More details and examples are provided in the PPC documentation.
Identifying parties
While in the vast majority of cases it was possible to unambiguously identify and match the parties from survey value labels to PF IDs, a handful of cases were challenging due to the brevity of the labels that included a shortened version of the party name or just its abbreviation (in the local language or in English), or resulting from the fact that PF only includes parties that received at least a few per cent share in elections, in addition to challenges posed by party name changes and alliance or coalition formation.
Coalitions and name changes
There is a tension between accuracy in reflecting the political scene at the time of the survey and the continuity in representing support for political forces. This tension manifests itself in the coding of parties which change names and in the coding of coalitions, especially those that are led by one large party accompanied by smaller coalition partners. This problem applies both to the labelling in the survey data and, perhaps to an even larger extent, to external party-level dataset with which survey data would be merged.
In PPC, we assigned PF IDs that best match the given survey label. In order to match survey data, via PPC, to external party-level datasets, PF IDs assigned in PPC may have to be adjusted to match codes in the external dataset, which have their own rules for dealing with name changes, mergers and coalitions. For example, the V-Party dataset, while predominantly relying on PF IDs, occasionally uses their own codes for alliances. Thus, even ensuring maximal internal consistency within PPC does not guarantee that the merging with an external dataset will be seamless. It is also important to consider whether the survey question asks about past or potential voting. Response options to questions about past voting behaviour may be reasonably expected to reflect parties that had contested in the latest election the question asks about. At the same time, response options to questions about potential vote choice reflect the situation at the time of the survey, which may be different from that in the most recent and in the following election. Ultimately, the coding in such cases should be determined by the intended use of the data.
To facilitate merging the data with V-Party and ParlGov’s Election datasets, we provide necessary adjustments that match survey responses with the most recent election results, prior to the first day of survey fieldwork. These adjustments account for less than 4% of all responses. We caution data users to carefully verify the merging of survey data, via PPC, to party-level datasets.
Special codes
We used standardized special codes for parties that we could not match to Party Facts IDs or response options that referred to ‘other parties'. Additionally, survey responses that did not refer to parties at all were classified into several categories, including responses about casting a blank vote, supporting independent candidates, respondents being ineligible to vote, as well as when the question was inapplicable, often because the preceding filtering question about having voted or planning to vote was answered negatively. Identifying and consistent coding of such ‘missing value' categories enables distinguishing between non-voters and item non-response, and the analysis of these special groups across survey datasets. Details about these special codes are available in the documentation.
Case studies
In this section we provide case studies to illustrate selected properties of party support as measured in cross-national surveys, allowing to verify the integrity of the party mapping and its suitability for longitudinal analyses of partisanship, as well as methodological research.
Following changes in party support
When examining the level of support for specific political parties based on survey variables recording the support for these parties, it is necessary to keep in mind the type of question the respondent answered. PPC provides mapping of responses for different types of variables: the party the respondent voted for in the last election, the party they would vote for if an election was held the coming Sunday or otherwise soon, the party the respondent feels close to, etc. Some of the differences in the level of support for the same parties even in the same years are related to these question types.
Bulgaria’s National Movement Simeon the Second
shows levels of support (proportions of respondents weighted with the available survey weights) for the National Movement Simeon the Second (Национално движение “Симеон Втори”, NDSV) in Bulgaria between 2001 and 2013 in different surveys, in addition to official election results in 2001, 2005 and 2009 based on the ParlGov’s Elections dataset (Döring and Manow Citation2021). Depending on the question type, survey levels of support refer to shares of respondents who declared having voted, declared that they would vote if elections were held shortly, or declared feeling close to the party. Until 2006 only ‘would vote’ questions are available. Levels of support from CCEB and NEB, both in October 2001 and shortly after the election of June 2001, are close to the election results. The first ‘voted for' variable is available in the ESS Round 3 (fieldwork from November 2006 to January 2007), after the June 2005 parliamentary election where NDSV received 19.9%votes. According to ESS Round 3, around 8% of those who had voted in this election, declared having voted for NDSV. At the same time, 55% respondents declared having voted for the ruling Socialist Party (as part of the Coalition for Bulgaria), which in fact received 31% votes. NDSV was part of the cabinet led by the Coalition for Bulgaria, which may explain the underreporting of the votes in ESS Round 3. In EB 69.2 (March 2008), around 17% of respondents declared having voted for NDSV, in EB 71.1 (January 2009) – 15%, and in ESS Round 4 (March–May 2009) – 12%.
Figure 1. Survey support and election results for Bulgaria's National Movement Simeon the Second, 2001–2013. Points indicate survey proportions of respondents who declared having voted, the intention to vote, or support for the party, weighted with survey weights, with 95% confidence intervals for the proportions. Grey lines indicate election dates, while grey diamonds indicate vote shares received. Survey data come from: Candidate Countries Eurobarometer, Eurobarometer, European Social Survey, European Values Study, Integrated and United, New Europe Barometer, World Values Survey. Information on vote shares in elections and election dates comes from ParlGov's Elections dataset.
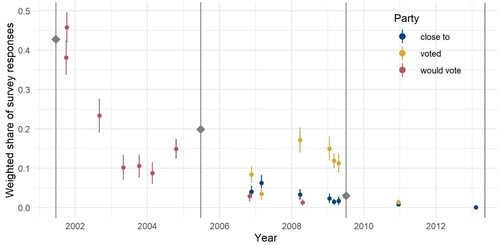
Responses to ‘would vote’ and ‘close to' questions between the 2005 and 2009 elections indicated very low support, which manifested in the 3% vote share in the July 2009 election. Only just above 1% of respondents in the ESS Round 5 (December 2010–March 2011) declared having voted for NDSV and less than 1% – feeling close to. In ESS Round 6, a single respondent declared feeling close to the party.
Poland’s Democratic Left Alliance
This case study illustrates the challenges associated with examining changes in support for parties that often participated in elections as part of coalitions and alliances. We use the example of Poland’s Democratic Left Alliance (Sojusz Lewicy Demokratycznej, SLD), whose support trajectory is presented in . SLD was created in 1991 as an alliance led by the party Social Democracy of the Republic of Poland, the main successor of the communist Polish United Workers’ Party. In 1999, SLD registered as a party under the same name, Democratic Left Alliance. For the 2001 election, SLD formed an alliance with the Labour Union, which went on to win the election with 41% of votes. In the next election in 2005, SLD participated on its own, received 11% of votes and lost power. It is worth noting the discrepancy in the reports of voting in the last elections and current support in the ESS Round 2, carried out in late 2004. In this survey, over 40% of respondents who declared having voted in the last election selected the coalition of SLD and Labour Union (close to the alliance’s election result), while only about 16% declared feeling close to SLD, indicated declining support which materialized in 11% of votes in 2005.
Figure 2. Survey support and election results for Poland’s Democratic Left Alliance and its coalitions, 1991–2019. Points indicate survey proportions of respondents who declared having voted, the intention to vote, or support for the Democratic Left Alliance or coalitions it formed, weighted with survey weights, with 95% confidence intervals for the proportions. Colours indicate the name of the party/alliance asked about in the survey question. The shape indicates the type of the survey question. Grey lines indicate election dates, and grey diamonds indicate vote shares received. Survey data come from: Candidate Countries Eurobarometer, Consolidation of Democracy in Central and Eastern Europe, Eurobarometer, European Social Survey, European Values Study, Integrated and United, International Social Survey Programme, New Europe Barometer, World Values Survey. Information on vote shares in elections and election dates comes from ParlGov's Elections dataset.
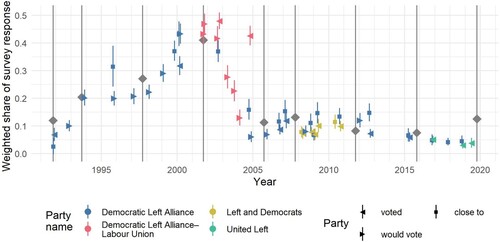
For the pre-term election in 2007, SLD formed a coalition ‘Left and Democrats' with the Social Democracy of Poland, Labour Union and Democratic Party – demokraci.pl. In the 2011 election SLD participated on its own, while for the 2015 election the party formed an alliance ‘United Left' with Your Movement, Polish Socialist Party, Labour Union and the Greens. Finally, for the 2019 parliamentary election, SLD formed a coalition ‘The Left' with four smaller left-wing parties: Spring, Together, Your Movement and the Polish Socialist Party, and received 12.6% of votes.
The V-Party data list SLD (instead of the coalition with Labour Union, SLD-UP) in the 2001 election and SLD (instead of United Left) in the 2015 election. ParlGov’s Election dataset uses the SLD code for all elections except for the one in 2007, when the Left and Democrats name is used.
Left-right placement of respondents and parties over time
The second case study illustrates over-time changes in the meaning of survey items measuring respondent’s left-right self-placement in different countries. We applied PPC to combined data from European survey projects that included questions about individual left-right self-placement, and merged in party characteristics from the V-Party dataset depending on the respondent’s preferred political party. We examined the correlations between respondent’s left-right placement and three party characteristics: economic left-right scale, following religious principles and support for LGBT equality. Correlations for selected two countries – Poland and Slovenia – are presented in . In this graph, each point corresponds to a correlation in one survey between respondent’s left-right self-placement and one of the three party characteristics.
Figure 3. Correlations between respondent’s left-right self-placement and the characteristics of preferred parties in Poland and Slovenia over time. Survey data include: Candidate Countries Eurobarometer, Consolidation and Democracy in Central and Eastern Europe, Eurobarometer, European Social Survey, European Values Study, World Values Survey. Information on party characteristics comes from V-Dem’s V-Party dataset. Dashed horizontal lines indicate correlations of −0.5, 0, and +0.5.
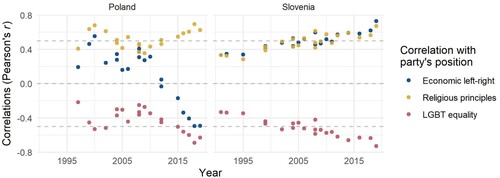
According to these results, correlations between individual left-right placement and parties’ economic left-right position in Slovenia have been positive throughout the studied period and have increased between 1991 and 2019. A similar pattern is found regarding correlations with party’s religious character. This means that in Slovenia people who identify as right-wing tend to support parties with economic right-wing orientations and parties that invoke God or religion. At the same time, left-wing self-identification more often coincides with support for parties that promote LGBT social equality.
In Poland, correlations between individual left-right self-placement and party’s religious character remained strongly positive during the thirty-year period under study. Meanwhile, correlations between left-right self-placement and party’s economic left-right character started in the positive range and then became negative during the 2010s. In 2019, respondents who identified as right-wing were more likely to support economically left-wing parties. Over time, the popular understanding of left-right has clearly lost much of its economic meaning. This example illustrates the limitations to cross-national and over-time comparability of the meaning of left-right self-placement scales that have been raised by other researchers (Bauer et al. Citation2017; Wojcik, Cislak, and Schmidt Citation2021; Zuell and Scholz Citation2019).
Modelling winner-loser gaps in political trust
The combined survey data, with respondents’ party preferences matched to parties’ winner-loser status based on the V-Party dataset, enable the analysis of long time series of changes in political support among electoral winners, losers and non-voters. Winner-loser gaps reflect the degree to which losers consent to their loss, which is a stronger signal of elections and democratic legitimacy than the satisfaction of winners (Anderson et al. Citation2005). Analysing support among non-voters completes the picture with information about the possible political alienation of these groups.
presents estimated levels of political trust based on items on trust in the national parliament, political parties, and justice system, among electoral winners, losers, and non-voters, in surveys from Hungary and Poland between the early 1990 and 2019. The estimates were obtained based on Bayesian item response theory models, which allowed for different numbers of points on response scales to trust items across projects (Bürkner Citation2017, Citation2019, Kołczyńska et al. Citation2020). This approach enables model-based harmonization of response scales without resorting to simplistic linear rescaling, which is commonly used, but which has been found to be problematic (Valgarðsson and Devine Citation2021). With the probit link function, the resulting estimates are interpretable as standardized z-values.
Figure 4. Estimated median levels and 95% posterior credible intervals of political trust based on survey responses to items on trust in the national parliament, political parties, and justice system, among supporters of electoral winners, losers, and non-voters in Hungary and Poland over time. Survey data include: Candidate Countries Eurobarometer, Consolidation and Democracy in Central and Eastern Europe, Eurobarometer, European Social Survey, European Values Study, International Social Survey Programme, New Europe Barometer, World Values Survey. Information on party status comes from V-Dem’s V-Party dataset.
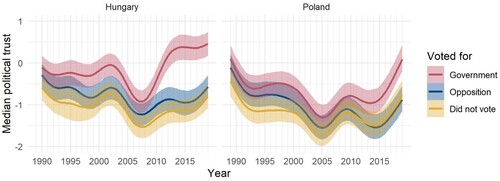
As could be expected, at all times political trust among winners is higher than among losers and non-voters. In Hungary, the winner-loser gap remained roughly stable during the first two decades post-transition and increased sharply following the 2010 election won by Fidesz. Political trust among supporters of the ruling party after 2010 exceeds 0, which means that positive responses to the trust items are more frequent than negative ones. At the same time, political trust among losers and non-voters is clearly negative.
In Poland, the situation is similar in that the winner-loser gap was stable and below 0.5 units on the probit scale until around 2010, then increased to approach 1 unit in 2019. The year 2010 marks the escalation of the conflict between supporters of the then ruling Civic Platform and the main opposition party Law and Justice, following the 2010 plane crash in Smolensk, Russia, which killed 96 passengers and crew, including President Lech Kaczyński and high ranking state and military officials, on their way to commemorate victims of the Soviet Katyń massacre during the Second World War (Etkind et al. Citation2012). Until 2015 the winner-loser gap increased primarily because of the decline of political trust among losers. In 2015, Law and Justice won elections, and their supporters – the new winners – saw a sharp increase in political trust, resulting in the largest winner-loser trust gap since 1990.
In the case of both countries, the sharp increase in the winner-loser gaps in political trust coincides with the increase in political and societal polarization scores according to the V-Dem data (Coppedge et al. Citation2021). The question about systematic link between the winner-loser gap in political support and other aspects of social and political polarization remains an avenue for exploration by future research.
Concluding remarks
PPC provides mapping tables for variables recording party preferences in 12 cross-national survey projects carried out in Europe until 2019. The crosswalk format is preferable to a more common approach of providing recode scripts, because it is both human- and machine-friendly and software agnostic. The crosswalk format makes it easy to filter and subset the data, e.g. in a spreadsheet programme, and thus facilitates verification of the mapping. This format makes crosswalks straightforward to extend, by simply adding rows that represent new variables from added datasets. The application of standardized party codes can be performed by directly using the crosswalk to transform the data, e.g. by merging the crosswalk into the survey data or as a basis for the creation of recode scripts in the chosen programming language. In this way, PPC proposes a standard for the collaborative development of resources for cross-national social science research with survey data, including on the harmonization of existing surveys and integrating them with other data sources. We acknowledge that creating such crosswalks, as any form of ex-post survey data harmonization, is time-consuming and error-prone, and always a second best alternative to ex-ante harmonization. We, therefore, encourage survey data producers to consider using Party Facts IDs to record responses to party-related survey questions, or to provide crosswalks from survey codes to Party Facts IDs in new datasets.
Disclosure statement
No potential conflict of interest was reported by the author(s).
Data availability statement
PPC is available at https://osf.io/w7q4u.
Additional information
Funding
Notes
1 Not all parties are present in the Party Facts data, because criteria for inclusion are at least 5% in elections with some degree of arbitrariness (cf. https://partyfacts.herokuapp.com/documentation/codebook/). Parties that received just a few responses, for which we could not find a corresponding Party Facts ID were thus not as suspicious as parties chosen by sizeable shares of respondents.
References
- Anderson, C. J., A. A. Blais, S. Bowler, T. Donovan, and O. Listhaug. 2005. Losers’ Consent. Elections and Democratic Legitimacy. Oxford: Oxford University Press.
- Bauer, P. C., P. Barberá, K. Ackermann, and A. Venetz. 2017. “Is the Left-Right Scale a Valid Measure of Ideology?” Political Behavior 39 (3): 553–583. doi:10.1007/s11109-016-9368-2.
- Bechert, I., A. May, M. Quandt, and K. Werhan. 2020. “ONBound – Old and New Boundaries: National Identities and Religion.” Customized dataset. GESIS Data Archive, Cologne. Accessed http://onbound.gesis.org/wizard
- Bederke, P., H. Döring, and S. Regel. 2020. Party Facts. Accessed www.partyfacts.org
- Bürkner, P.-C. 2017. “brms : An R Package for Bayesian Multilevel Models Using Stan.” Journal of Statistical Software 80: 1. doi:10.1017/S175577392000003X.
- Bürkner, P.-C. 2019. “Bayesian Item Response Modelling in R with brms and Stan.” ArXiv: 905.09501. Accessed http://arxiv.org/abs/1905.09501
- Coppedge, M., J. Gerring, C. H. Knutsen, S. I. Lindberg, J. Teorell, N. Alizada, D. Altman, et al. 2021. “V-Dem [Country–Year/Country–Date] Dataset v11.1” Varieties of Democracy (V-Dem) Project. doi:10.23696/vdemds21
- Döring, H., and P. Manow. 2021. “Parliaments and Governments Database (ParlGov): Information on Parties, Elections and Cabinets in Modern Democracies.” Accessed http://www.parlgov.org/
- Döring, H., and S. Regel. 2019. “Party Facts: A Database of Political Parties Worldwide.” Party Politics 25 (2): 97–109. doi:10.1177/1354068818820671.
- Etkind, A., R. Finnin, U. Blacker, J. Fedor, S. Lewis, M. Mälksoo, and M. Mroz. 2012. Remembering Katyn. Cambridge: Polity Press. Accessed http://politybooks.com/bookdetail/?isbn=9780745655765
- Hill, S. E. 2020. “ESS PartyFacts Crosswalk.” Accessed August 9 2021. https://github.com/sophieehill/ess-partyfacts-crosswalk
- Larmarange, J. 2019. “labelled: Manipulating Labelled Data.” Accessed https://cran.r-project.org/package = labelled
- Lührmann, A., N. Düpont, M. Higashijima, Y. B. Kavasoglu, K. L. Marquardt, M. Bernhard, H. Döring, et al. 2020. “Varieties of Party Identity and Organization (V-Party) Dataset V1.” Varieties of Democracy (V-Dem) Project. doi:10.23696/vpartydsv1.
- Kołczyńska, M. “Combining Multiple Survey Sources: A Reproducible Workflow and Toolbox for Survey Data Harmonization.” Forthcoming. Forthcoming in Methodological Innovations. doi:10.1177/20597991221077923
- Kołczyńska, M., P.-C. Bürkner, L. Kennedy, and A. Vehtari. 2020. “Modeling Public Opinion Over Time and Space: Trust in State Institutions in Europe, 1989–2019.” SocArXiv. August 11. doi:10.31235/osf.io/3v5g7
- Martini, S., and M. Quaranta. 2019. “Political Support Among Winners and Losers: Within- and Between-Country Effects of Structure, Process and Performance in Europe.” European Journal of Political Research 58 (1): 341–361. doi:10.1111/1475-6765.12284.
- Oyetoke, T. 2020. “PyInquirer. A Python module for collection of common interactive command line user interfaces, based on Inquirer.js.” Accessed https://pypi.org/project/PyInquirer/
- R Core Team. 2020. “R: A Language and Environment for Statistical Computing. Vienna, Austria.” Accessed https://www.r-project.org/
- United Nations Statistics Division. 2021. “Standard country or area codes for statistical use (M49).” Accessed https://unstats.un.org/unsd/methodology/m49/overview/
- Valgarðsson, V. O., and D. Devine. 2021. “What Satisfaction with Democracy? A Global Analysis of “Satisfaction with Democracy” Measures.” Political Research Quarterly, doi:10.1177/10659129211009605.
- Wickham, H., and E. Miller. 2019. “haven: Import and Export “SPSS”, “Stata” and “SAS” Files.” Accessed https://cran.r-project.org/package = haven
- Wojcik, A. D., A. Cislak, and P. Schmidt. 2021. “The Left is Right’: Left and Right Political Orientation Across Eastern and Western Europe.” The Social Science Journal. doi:10.1080/03623319.2021.1986320.
- Zuell, C., and E. Scholz. 2019. “Construct Equivalence of Left-Right Scale Placement in a Cross-National Perspective.” International Journal of Sociology 49 (1): 77–95. doi:10.1080/00207659.2018.1560982.
- Asia Europe Survey (ASES): https://www.icpsr.umich.edu/web/ICPSR/studies/22324 (Inoguchi 2001)
- Candidate Countries Eurobarometer (CCEB): https://ec.europa.eu/commfrontoffice/publicopinion/archives/cceb2_en.htm (Mohedano-Brethes and Magny 2004, 2016; Magny 2004a, 2004b, 2004c)
- Consolidation of Democracy in Central and Eastern Europe (CDCEE): https://search.gesis.org/research_data/ZA4054 (Rotman et al. 2004)
- Eurobarometer (EB): https://ec.europa.eu/commfrontoffice/publicopinion (European Commission 2012a, 2012b, EB 51.0; 2012c, 2012d, 2019; Papacostas 2013a, 2013b, 2012)
- European Social Survey (ESS): https://www.europeansocialsurvey.org/(European Social Survey 2002, 2004, 2006, 2008, 2010, 2012, 2014, 2016, 2018)
- European Values Study (EVS): https://europeanvaluesstudy.eu/(Gedeshi, Zulehner, et al. 2020; Gedeshi, Kritzinger, et al. 2020)
- International Social Survey Programme (ISSP): http://www.issp.org/(Evans et al. 1993; Kelley et al. 2000; Höllinger et al. 2018)
- Integrated and United: A Quest for a Citizenship in an Ever Closer Europe (INTUNE): https://www. mzes.uni-mannheim.de/d7/en/datasets/integrated-and-united-a-quest-for-a-citizenship-in-an-ever-closer-europe (Cotta, Isernia, and Bellucci 2013)
- Life in Transition Survey (LITS): https://www.ebrd.com/what-we-do/economic-research-and- data/data/lits.html (European Bank for Reconstruction and Development 2016)
- New Baltic Barometer (NBB): http://www.cspp.strath.ac.uk/catalog2_0.html (Rose 2010a)
- New Europe Barometer (NEB): http://www.cspp.strath.ac.uk/nebo.html (Rose and Paul Lazarsfeld Society (Vienna) 2010a, 2010b, 2010c; Paul Lazarsfeld Society (Vienna) and Rose 2010; Rose 2010b; Rose and Mishler 2010)
- World Values Survey (WVS): http://www.worldvaluessurvey.org/wvs.jsp (World Values Survey 2015)
- Cotta, Maurizio, Pierangelo Isernia, and Paolo Bellucci. 2013. “IntUne Mass Survey Wave 2, 2009.” Inter-university Consortium for Political; Social Research [distributor]. https://doi.org/10.3886/ICPSR34272.v2.
- European Bank for Reconstruction and Development. 2016. “Life in Transition Survey 2016.” EBRD, https://www.ebrd.com/what-we-do/economic-research-and-data/data/lits.html.
- European Commission. 2012a. “Eurobarometer 44.2bis (Jan-Mar 1996).” GESIS Datenarchiv, Köln. ZA2828 Datenfile Version 1.0.1 (2012), doi: https://doi.org/10.4232/1.10919.
- European Bank for Reconstruction and Development. 2012b. “Eurobarometer 48.0 (Oct-Nov 1997).” GESIS Datenarchiv, Köln. ZA2959 Datenfile Version 1.0.1 (2012), doi: https://doi.org/10.4232/1.10929.
- European Bank for Reconstruction and Development. 2012c. “Eurobarometer 54.1 (Oct-Nov 2000).” GESIS Datenarchiv, Köln. ZA3387 Datenfile Version 1.1.0 (2012), doi: https://doi.org/10.4232/1.10937.
- European Bank for Reconstruction and Development. 2012d. “Eurobarometer 61 (Feb-Mar 2004).” GESIS Datenarchiv, Köln. ZA4056 Datenfile Version 1.0.1 (2012), doi: https://doi.org/10.4232/1.10961.
- European Bank for Reconstruction and Development. 2019. “Eurobarometer 91.5 (2019).” GESIS Datenarchiv, Köln. ZA7576 Datenfile Version 1.0.0 (2019), doi: https://doi.org/10.4232/1.13393.
- European Social Survey. 2002. “European Social Survey Round 1 Data.” Data file edition 6.6, doi:10.21338/NSD-ESS1-2002; NSD – Norwegian Centre for Research Data, Norway – Data Archive; distributor of ESS data for ESS ERIC. https://doi.org/10.21338/NSD-ESS1-2002.
- European Social Survey. 2004. “European Social Survey Round 2 Data.” Data file edition 3.6, doi:10.21338/NSD-ESS2-2004; NSD – Norwegian Centre for Research Data, Norway – Data Archive; distributor of ESS data for ESS ERIC. https://doi.org/10.21338/NSD-ESS2-2004.
- European Social Survey. 2006. “European Social Survey Round 3 Data.” Data file edition 3.7, doi:10.21338/NSD-ESS3-2006; NSD – Norwegian Centre for Research Data, Norway – Data Archive; distributor of ESS data for ESS ERIC. https://doi.org/10.21338/NSD-ESS3-2006.
- European Social Survey. 2008. “European Social Survey Round 4 Data.” Data file edition 4.5, doi:10.21338/NSD-ESS4-2008; NSD – Norwegian Centre for Research Data, Norway – Data Archive; distributor of ESS data for ESS ERIC. https://doi.org/10.21338/NSD-ESS4-2008.
- European Social Survey. 2010. “European Social Survey Round 5 Data.” Data file edition 3.4, doi:10.21338/NSD-ESS5-2010; NSD – Norwegian Centre for Research Data, Norway – Data Archive; distributor of ESS data for ESS ERIC. https://doi.org/10.21338/NSD-ESS5-2010.
- European Social Survey. 2012. “European Social Survey Round 6 Data.” Data file edition 2.4, doi:10.21338/NSD-ESS6-2012; NSD – Norwegian Centre for Research Data, Norway – Data Archive; distributor of ESS data for ESS ERIC. https://doi.org/10.21338/NSD-ESS6-2012.
- European Social Survey. 2014. “European Social Survey Round 7 Data.” Data file edition 2.2, doi:10.21338/NSD-ESS7-2014; NSD – Norwegian Centre for Research Data, Norway – Data Archive; distributor of ESS data for ESS ERIC. https://doi.org/10.21338/NSD-ESS7-2014.
- European Social Survey. 2016. “European Social Survey Round 8 Data.” Data file edition 2.1, doi:10.21338/NSD-ESS8-2016; NSD – Norwegian Centre for Research Data, Norway – Data Archive; distributor of ESS data for ESS ERIC. https://doi.org/10.21338/NSD-ESS8-2016.
- European Social Survey. 2018. “European Social Survey Round 9 Data.” Data file edition 2.0, doi:10.21338/NSD-ESS9-2018; NSD – Norwegian Centre for Research Data, Norway – Data Archive; distributor of ESS data for ESS ERIC. https://doi.org/10.21338/NSD-ESS9-2018.
- Evans, Mariah, Clive Bean, Jonathan Kelley, Peter Ph. Mohler, Petra Beckmann, Michael Braun, Roger J Jowell, et al. 1993. “International Social Survey Programme: Religion I – ISSP 1991.” GESIS Datenarchiv, Köln. ZA2150 Datenfile Version 1.0.0 (2010), doi: https://doi.org/10.4232/1.2150.
- Gedeshi, Ilir, Sylvia Kritzinger, Gevorg Poghosyan, David Rotman, Merab Pachulia, Georgy Fotev, Jadranka Kolenović-Đapo, et al. 2020. “European Values Study 2017: Integrated Dataset (EVS 2017).” GESIS Datenarchiv, Köln. ZA7500 Datenfile Version 3.0.0, https://doi.org/10.4232/1.13511.
- Gedeshi, Ilir, Paul M Zulehner, David Rotman, Larissa Titarenko, Jaak Billiet, Karel Dobbelaere, Jan Kerkhofs, et al. 2020. “European Values Study Longitudinal Data File 1981–2008 (EVS 1981–2008).”
- GESIS Datenarchiv, Köln. ZA4804 Datenfile Version 3.1.0 (2020), doi: https://doi.org/10.4232/1.13486.
- Höllinger, Franz, Max Haller, Ann Evans, Ann Carton, Carolina Segovia, Croatia for Social Research Zagreb, Bambos Papageorgiou, et al. 2018. “International Social Survey Programme: Religion III – ISSP 2008.” GESIS Datenarchiv, Köln. ZA4950 Datenfile Version 2.3.0 (2018), doi: https://doi.org/10.4232/1.13161.
- Inoguchi, Takashi. 2001. “Asia Europe Survey (ASES): A Multinational Comparative Study in 18 Countries.” Ann Arbor, MI: Inter-university Consortium for Political; Social Research. https://doi.org/10.3886/ICPSR22324.v1.
- Kelley, Jonathan, Mariah Evans, Franz Höllinger, Max Haller, Kathrin Scholz, Lilia Dimova, Canada Carleton University Survey Centre Ottawa, et al. 2000. “International Social Survey Programme: Reli- gion II – ISSP 1998.” GESIS Datenarchiv, Köln. ZA3190 Datenfile Version 1.0.0 (2010), doi: https://doi.org/10.4232/1.3190.
- Magny, Renaud de. 2004a. “Candidate Countries Eurobarometer 2002.2.” GESIS Datenarchiv, Köln. ZA3979 Datenfile Version 1.0.0 (2010), doi: https://doi.org/10.4232/1.3979.
- Magny, Renaud de. 2004b. “Candidate Countries Eurobarometer 2003.2.” GESIS Datenarchiv, Köln. ZA3983 Datenfile Version 1.0.0 (2010), doi: https://doi.org/10.4232/1.3983.
- Magny, Renaud de. 2004c. “Candidate Countries Eurobarometer 2003.4.” GESIS Datenarchiv, Köln. ZA3986 Datenfile Version 1.0.0 (2010), doi: https://doi.org/10.4232/1.3986.
- Mohedano-Brethes, Ruben, and Renaud de Magny. 2004. “Candidate Countries Eurobarometer 2001.1.” GESIS Datenarchiv, Köln. ZA3978 Datenfile Version 1.0.0 (2010), doi: https://doi.org/10.4232/1.3978.
- Mohedano-Brethes, Ruben, and Renaud de Magny. 2016. “Candidate Countries Eurobarometer 2004.1.” GESIS Datenarchiv, Köln. ZA4246 Datenfile Version 1.0.1 (2016), doi: https://doi.org/10.4232/1.12468.
- Papacostas, Antonis. 2012. “Eurobarometer 71.3 (Jun-Jul 2009).” GESIS Datenarchiv, Köln. ZA4973 Datenfile Version 3.0.0 (2012), doi: https://doi.org/10.4232/1.11135.
- Papacostas, Antonis. 2013a. “Eurobarometer 69.2 (Mar-May 2008).” GESIS Datenarchiv, Köln. ZA4744 Datenfile Version 5.0.0 (2013), doi: https://doi.org/10.4232/1.11755.
- Papacostas, Antonis. 2013b. “Eurobarometer 71.1 (Jan-Feb 2009).” GESIS Datenarchiv, Köln. ZA4971 Datenfile Version 4.0.0 (2013), doi: https://doi.org/10.4232/1.11756.
- Paul Lazarsfeld Society (Vienna), and Richard Rose. 2010. “New Europe Barometer IV, 1995.” UK Data Service. SN: 6455, doi: https://doi.org/10.5255/UKDA-SN-6455-1.
- Rose, Richard. 2010a. “New Baltic Barometer I-VI Trend Dataset, 1993-2004.” UK Data Service. SN: 6510, 2nd Edition, doi: https://doi.org/10.5255/UKDA-SN-6510-1.
- Rose, Richard. 2010b. “New Europe Barometer VI, 2001.” UK Data Service. SN: 5242, doi: https://doi.org/10.5255/UKDA-SN-5242-1.
- Rose, Richard, and William Mishler. 2010. “New Europe Barometer VII, 2004-2005.” UK Data Service. SN: 5243, doi: https://doi.org/10.5255/UKDA-SN-5243-1.
- Rose, Richard, and Paul Lazarsfeld Society (Vienna). 2010a. “New Europe Barometer II, 1992- 1993.” UK Data Service. SN: 6453, doi: https://doi.org/10.5255/UKDA-SN-6453-1.
- Rose, Richard, and Paul Lazarsfeld Society (Vienna). 2010b. “New Europe Barometer III, 1993- 1994.” UK Data Service. SN: 6454, doi: https://doi.org/10.5255/UKDA-SN-6454-1.
- Rose, Richard, and Paul Lazarsfeld Society (Vienna). 2010c. “New Europe Barometer V, 1998.” UK Data Service. SN: 6456, doi: https://doi.org/10.5255/UKDA-SN-6456-1.
- Rotman, David, Andrei Raychev, Kancho Stoychev, Jan Hartl, Ján Misovic, Zdenka Mansfeldová, Aandrus Saar, et al. 2004. “Consolidation of Democracy in Central and Eastern Europe 1990-2001: Kumulation PCP I und II.” GESIS Datenarchiv, Köln. ZA4054 Datenfile Version 1.0.0 (2010), doi: https://doi.org/10.4232/1.4054.
- World Values Survey. 2015. “World Values Survey 1981–2014 Longitudinal Aggregate v.20150418.” Madrid: World Values Survey Association. Aggregate File Producer: JDSystems, Madrid, Spain. www.worldvaluessurvey.org.