
Abstract
Available research analysing the playing structure in kids tennis on different scaled courts identifies a severe problem at the transition from the U9 (Orange stage) to the U10 (Green stage), which can mainly be reasoned by the enlargement of the court from a small-sided field to the full-sized court. Aware of this problem, an intermediate stage, called Lime Court (stage), between Orange and Green was introduced in Austria. The study at hand aims to compare the playing structure between the Green and the Lime Court in kids’ tennis aged 9-10 years (U10). Twelve videos from matches on Lime in 2013 were analysed and compared to the results found in 2014. The playing structure was defined by 18 performance parameters. The differences in the mean values as well as one-way ANOVA were calculated between the groups. The results found in the study lead to the conclusion that the Lime Court enables children to play more similar to elite players than the Green Court. Thus, Lime closes the existing gap between the Tennis10s stage Orange and Green and should be used for 10-year old tennis players in order to properly develop their playing skills.
1. Introduction
In the year 2007, the International Tennis Federation (ITF) launched a campaign called “Play & Stay, Serve-Rally-Score” in order to raise the worldwide tennis participation (Crespo, McInerney, & Miley, Citation2007). This campaign promoted tennis as a modern and easy to play game sport and aimed to enable all beginners to serve, rally and score from their very first lesson. The main idea of the campaign was to give kid players the experience to participate in a type of tennis (regarding the technical and tactical playing style/structure) which is very close to the adults’ sport. Therefore, environments had to be tailored, which enable children to play tennis like adults from the perspective of the technical and tactical playing structure. In a first step, slower balls were used and in 2008 the ITF introduced a guide called “Tennis 10s”, which describes specific adaptions regarding not only balls but also court sizes, the net height and rackets. After positive feedback from almost all member nations, the ITF announced the official rule change according to the mandatory use of slower balls on appropriate-sized courts (ITF, Citation2016) in official tournaments for children aged under 10 years in 2012. There are three stages of Tennis 10s (Tennisplayandstay, Citation2016): Red (Stage 3, age: 5–8), Orange (Stage 2, age: 8–10) and Green (Stage 1, age: 9–10). Supported by professional players like Federer and Nadal (Miley, Citation2010), the launch of the Tennis 10s campaign immediately had positive effects on the number of children playing tennis. In Belgium for instance, children’s participation in tennis competitions increased significantly (Declercq, Citation2010) after adapting the framework conditions for kids’ tennis.
The term “scaled tennis” in this article includes changes in the environment regarding to smaller court sizes, slower balls, lower net height and lighter rackets. For purposes of shorting most often only the overall term is used (“Orange”, “Green”, “Lime”).
There are multiple expected advantages of slower balls and smaller courts in order to prepare young players for professional tennis. Slower balls give players more time and control, making it easier for them to rally and to develop advanced tactics and techniques. Pressure reduced balls will most often land within an optimal striking zone for young children, whereas the traditional yellow balls frequently bounce above their head (Newman, Citation2010). The smaller courts are scaled to the size of children, which enables kids to better cover the whole playing area. This enables movement patterns and tactical behaviours more similar to adults’ tennis (Newman, Citation2010). Kid players learn advanced skills and shot making, as they are required later on the regular court, not by high repetitions of specific exercises but just by playing tennis. This is fun and fosters implicit learning, which culminates in a more efficient performance compared to conscious learning (Reid, Buszard, Farrow, & Masters, Citation2013). Larson and Guggenheimer (Citation2013) studied the effects of scaled tennis equipment on the forehand groundstroke performance of children. The stroke quality was assessed by measuring its velocity and precision. Children playing with adapted balls on modified courts achieved better results than the players using standard balls on the traditional court. The authors concluded that the use of scaled balls and courts may increase the control, velocity and overall success rate of the tennis forehand groundstroke in kid’s tennis. This study goes along with many other investigations and experiences of experts in youth tennis emphasising the importance of changing the environment in youth tennis in order to improve the children’s abilities to rally, score and acquire important skills that are crucial for a professional career (Anderson, Citation2007; Cabral, Citation2010; Martens & De Vylder, Citation2007; McEnroe, Citation2010; Miley, Citation2007; Newman, Citation2010; Tennant, Citation2011).
For a proper development of kids’ playing abilities, the environmental tasks should be adapted to the player’s individual progression of skills and physical capabilities (Gonzalez, Citation2012). Therefore, each scaled court should be used in a certain period of the development of a kid player. However, tournaments can only be regulated referring to the calendrical age. Thus, a nine-year old kid has to play competitions on full-sized courts (the Green stage still has slower balls) even though the average height at this age is only about 80% of that of an adult (Newman, Citation2010). This often leads to constraint tactical behaviours like moon balls (i.e. the player waits for the ball to drop, then returns it very high above the net to force the opponent to hit the ball very high). Moon balls mostly occur on the Green Court, whereas the size of the Orange Court hardly allows this type of stroke. As the kids grow and develop, this problem fades. At the age of 11, moon balls occur very rarely due to the aligned proportions between the players’ body sizes and the court dimensions. Schmidhofer, Leser, and Ebert (Citation2014) discussed a couple of other negative effects of disproportionately large courts and showed that the playing structure of U10 kids playing on the Green Court differs from (adult) ATP tennis more than U9 tennis on the Orange Court and U12 tennis on the regular court (Figure ). The figure merges twelve analysed performance indicators to six basal parameters. Assuming that the goal of kids’ tennis training is to come as close as possible to the playing structure (exemplarily defined by the described performance parameters) of adults’ (ATP) tennis, then Figure gives a clear picture of the effects of different adaptions of the environment referring to the playing style of children. A priori we would assume that the playing structure in youth tennis comes closer to the ATP values the older the kids are, but something different is the case. Whereas the U9 tennis (having the most distinctive scaling adaptions, see Table ) has about the same values then the much older U12 group, the U10 kids (playing already on the full-scaled court) show much higher deviations. There is a clear (negative) peak in nearly each line at U10 Green Court, which means that the structure of the game is more different to ATP than at any other age/stage. U10 kids seem to struggle with the step from Orange to Green. The much larger court leads to a less aggressive serve, an overall slower play (regarding the time interval between two consecutive strokes) and to less success when approaching the net. This leads to the assumption that a smaller court at the age of 10 could lead to a playing structure more similar to ATP tennis.
Figure 1. Course of selected performance parameters (Schmidhofer et al., Citation2014).
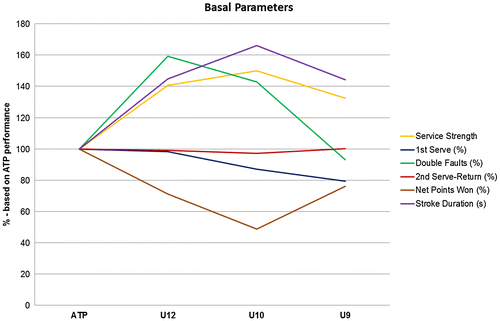
Table 1. The Austrian Tennis System.
The article at hand takes a closer look at the Tennis 10s’ transition from the Orange to the Green Court, which was proved to be inappropriately for the children’s development by Schmidhofer et al. (Citation2014). As described above, the courts sizes change inadequately between Green and Orange, which can be expressed by the ratios between the court dimensions and the average body heights of the kids (Table ). Already aware of this problem, Ebert (Citation2012) introduced the Lime Court as connecting piece (Tennis4kids, Citation2016). This court is larger than the Orange Court, but smaller than the Green Court. It was officially launched in 2012 as part of the Austrian Tennis System (Table ), but it is not part of the ITF Tennis 10s. This study bases on the results of Schmidhofer et al. (Citation2014) and extends the investigations to the Lime Court by applying nearly the same performance parameters. With this, we examine if the Lime Court is a solution to bypass the undesired effects in the playing structure emerging at the transition from Orange to Green tennis.
2. Methods
2.1. Sample
This study comprised 24 matches played by the best Austrian tennis players aged 9–10 years. Twelve matches played on the Lime Court were filmed in June 2013 at a development tournament, an event where the best kids from each of the nine federal states of Austria were invited. The other 12 matches were played on the Green Court and filmed in July 2016 at the Kids Team Cup Austria, a tournament in which the two best children from each of the nine federal states participated. The video footage was taken with permission of the parents as well as the kids. The Lime group comprised 12 children, each of them appeared not more than twice in the sample. The Green group comprised also 12 children, each of them appeared a maximum of three times in the sample. Altogether, 9.796 strokes were measured with a mean number of 408 strokes per match.
2.2. Data acquisition and performance parameters
Video footage was taken from all analysed matches by placing a camera behind the courts in about 4 m height. The videos were used by an operator to observe and manually annotate the investigated performance parameters (Table ). The basic observation system and concept of analysis were borrowed from Schmidhofer et al. (Citation2014), but there are few alterations concerning the performance parameters: the parameter Return Points Won was not used because it just represents the counterpart of Serve Points Won. For specific service analyses, the parameters 1st Serve Points Won (%) and 2nd Serve Points Won (%) were combined to Total Serve Points Won (%), which is an overall indicator of the effectiveness of the serve. Furthermore, the performance parameters were extended for forced and unforced errors and winners. Whereas Forced Error &Winner (%) is an indicator for the aggressivity of a playing style, the three parameters for unforced errors (baseline, sideline, net) give information if those types of errors occur on specific scaled courts more often than on the others.
Table 2. Investigated performance parameters.
The 1st and 2nd Serve Points Won (%) were calculated by dividing the points won after the 1st/2nd serve by all points after a 1st or 2nd serve, respectively. The same procedure was done for Total Serve Points Won (%). All three parameters were calculated per match. A net approach was registered when a player runs to the net, not distinguishing if this approach is forced by an opponent’s drop shot or if it is an offensive action of the player on the net.
Breaks Won (%) were calculated by dividing the won breaks by the total number of games played, tiebreaks do not count as a game.
The numbers for Aces (n) and Double Faults (n) were calculated as mean values for one single match. Similar, the inter contact times were computed as mean values per stroke type and Rally Duration (s) is the average time span of all rallies.
In order to ensure objectivity of the data, an inter-rater-reliability study as well as an intra-rater-reliability study were performed for all critical parameters gathered for the investigation.
The parameters Aces (n), 1st Serve (%), 1st Serve Points Won (%), 2nd Serve Points Won (%) and Total Serve Points Won (%) are well defined or determined by the referee, respectively, and thus were no subject to reliability tests. If a rally ends with Net or Baseline/Sideline out is also obvious and was thus not checked. Surprisingly, also the distinction between Baseline out and Sideline out was found to be unproblematic by the investigators and was therefore not involved in the reliability study. All strokes, which were Baseline out and Sideline out at the same time were coded as too long (Baseline out).
The Cohen’s Kappa values for the outcome of a rally (Forced Error, Unforced Error or Winner) are .951 for the inter-rater-reliability study and 1.000 for the intra-rater-reliability study. As laid down by Altman (Citation2011) this can be classified as very good accordance.
The reliability for the timing factors (ICTs and Rally Duration (s)) was checked separately. Due to the very exact determination of the time instances by going through the videos frame per frame, only few deviations between the two operators performing the reliability tests occurred. If there were diverging results, the time shifts between the operators were only one or two frames at maximum (.04 or .08 s). Considering the scales of the ICT parameters and the rally duration, this deviation is negligible. Nevertheless, Cohen’s Kappa was calculated for the times being exactly the same (yes/no) and resulted in .837 for the inter-rater-reliability study and .936 for the intra-rater-reliability study.
The ATP as well as the U10 Green results are carried over from the Schmidhofer et al. (Citation2014) study.
2.3. Data analysis
The video footage (25 frames per second) was analysed by the software Kinovea .8.24. Besides using the software as video player with slow motion functions etc., it was applied to measure the ICTs in particular. The annotation of each single stroke as well as descriptive statistics and charts were done in Microsoft Excel 2010. The tests for significance were performed with the software SPSS 22.0.
There were three test groups that were compared to each other: ATP, Lime and Green – whereby the ATP and Green data originated from the Schmidhofer et al. (Citation2014) study and the Lime data was collected specifically for this study. The differences between the mean values for each parameter and group were analysed via one-way ANOVA with p < .05. Few parameters showed inhomogeneous variances, so the post hoc tests by Games-Howell (for inhomogeneous variances) as well as by Scheffé (for homogeneous variances) were performed. The Kolmogorov-Smirnov-Test as well as optical examinations of the normal distribution plots were applied to examine whether the variables were normally distributed. For those parameters not distributed normally, the Kruskal-Wallis-Test was performed to calculate the differences in the mean values.
3. Results
The following sections present descriptive statistics (mean values ± standard deviations) of the analysis parameters and give information on whether the differences between the groups are significant or not (ANOVA, p < .05).
In Table , the service parameters are listed. Aces occurred on Lime as well as on Green very rarely. The parameters 1st Serve (%) and Double Faults (n) show no significant differences between any of the three groups. The double faults have a very high standard deviation and seem to depend more on the type of player than on the court size or age. ATP players have higher values for the 1st Serve Points Won (%). The difference for this parameter is significant compared to both other groups. The Lime Court ranks first when it comes to 2nd Serve Points Won (%). The values are significantly higher than on the Green Court but do not differ significantly from ATP. The Total Serve Points Won (%) is for the Green Court significantly lower than for the other two groups.
Table 3. Service parameters.
The Inter Contact Times (Table ) are significantly different in all analysed parameters and between all groups. It is the same picture for all five variables: ATP has the lowest values, followed by Lime and Green is ranked third.
Table 4. ICT parameters.
Due to the unavailability of the types of error parameters from the ATP study, these parameters are only compared between the U10 groups Lime and Green (Table ). Concerning the types of unforced errors (baseline, net, sideline), neither a significant result nor any tendencies were found. The Forced Error &Winner (%) is higher for Lime than for Green, but also this result is not significant.
Table 5. Types of error.
The three remaining parameters are shown in Table . The mean duration of all rallies is significantly higher for Green compared to ATP. The Lime value is in the middle, but with no significant differences to the other groups. The Break (%) is a consequence of the 1st Serve (%) and the 1st Serve Points Won (%) and therefore is significantly lower in ATP tennis than on the Lime and Green Court. The Net approach won (%) is highest in ATP, followed by Lime and Green, whereas the Green value is significantly lower than the two others.
Table 6. Other parameters.
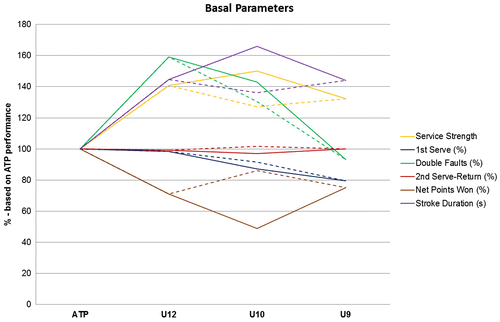
Figure depicts the results concerning the merged (so called basal) parameters by Schmidhofer et al. (Citation2014). It shows that all six parameters are in the U10 Lime group closer to the ATP values compared to the U10 Green group.
Figure 2. Course of selected parameters by Schmidhofer et al. (Citation2014) complemented with the U10 Lime results from 2016 (spotted lines).
4. Discussion
Worldwide recognised experts in the field of youth tennis endorse the concept of scaled courts (Anderson, Citation2007; Cabral, Citation2010; Martens & De Vylder, Citation2007; McEnroe, Citation2010; Miley, Citation2007; Newman, Citation2010; Tennant, Citation2011), but there is few empirical evidence about the effectiveness of scaled courts. The study of Schmidhofer et al. (Citation2014) gives a quantitative overview of the playing style in contemporary tennis characterised by means of several performance parameters for elite tennis and kid’s tennis playing under the ITF’s Tennis 10s concept. This concept aims at a faster development of tactical and technical skills in tennis and also at making this sport more fun to play for children. Schmidhofer et al. (Citation2014) give an overview about the similarities and differences between kid’s tennis at the different Tennis 10s’ stages and ATP professional tennis. They conclude that the concept of scaled courts works well, but there is a problem at the transition from the Orange stage (U9) to the Green stage (U10). Nearly all analysed performance parameters drift off in the Green system before they once again come closer to the desired values when the players get older (U12). This is mainly due to the transition from a small-sided court to the full-sided court. Therefore, the Austrian Tennis Federation introduced the Lime Court in 2012 – a court of size between Orange and Green. The study at hand took up the Schmidhofer et al. (Citation2014) study and investigated the effects of this new Lime Court.
The interpretation of the results follows the structure in the Results section: it starts with the service parameters (Table ), followed by the inter contact times (Table ) and types of errors (Table ). The remaining other indicators (Table ) are discussed in the context of the aforementioned parameters.
Aces are very rare events in youth tennis in general. In contrast to adult tennis, they seem to happen by chance, not on purpose. On Green as well as on Lime, there was not a single match with more than one ace throughout the entire match.
There are no differences in Double Faults (n) and 1st Serve (%) between the three groups, but ATP performs better in 1st Serve Points Won (%). More than two-third of all ATP services lead to a win of the rallies, whereas it is only about each second on Green. This means that the first service in elite adult tennis is not safer but more effective than in youth tennis. There is no difference in this parameter between Lime and Green, but 2nd Serve Points Won (%) is higher in Lime. This results in Total Serve Points Won (%) being lower on Green than in the other two groups. Altogether this shows that the large court leads to a less forceful service on Green whereas the smaller court on Lime aligns the effectivity of the service to ATP level. The main reason for this may be the unfavourable proportion between the court length and the players’ body size on Green hampering them to produce enough pressure with their serve.
The inter contact time (timespan between two consecutive racket-ball contacts of player A and B) is a very meaningful parameter, because increasing the speed of the shots is one of the most important aspects in training at each age. U10 kids cannot hit the ball as fast as adults, but a smaller court at the age of 10 years results in lower ICTs and less time to react, which is more similar to ATP. The playing structure on the Green Court shows significantly higher ICTs in each aspect compared to the Lime Court, and Lime has higher ICTs than ATP. Although Lime is slower than ATP, it is far closer to adult tennis than Green. This is due to the (too) large court, the softer balls and the less physical strength of children. In particular, the large court leads to different tactics on Green compared to ATP but also compared to the smaller Lime Court. Children, with an average height of 78.3–81.67% of an adult, positioned close to the net are easy to be lobed and a wider court also gives more scope for passing shots (Tennant, Citation2011). Thus, typical for kids’ tennis on large courts are long and high shots, which in particular avoid net approaches. This results not only in a lower percentage of won net approaches compared to adult tennis but also in long baseline rallies, which is underlined by the higher rally duration. By contrast, the rally duration on Lime is not different to ATP and although Net approach won (%) is lower on Lime compared to ATP it is still noticeable higher than on Green. As a consequence high and long baseline players, which give the impression that youth players are regressed in their abilities (Tennant, Citation2011), are not as distinctive on Lime as on Green.
A closer look at the types of error reveals no significant differences between Lime and Green. As those parameters were not investigated in the Schmidhofer et al. (Citation2014) study, no comparisons to ATP are possible. However, Forced Error &Winner (%) is higher on Lime than on Green. Although this result is not significant, it is one more sign for the main outcome of this study: the playing structure on Lime is more similar to ATP than on Green. In all 14 variables available for all three groups, the values of the Lime Group are closer to ATP than of the Green Group. In eight of those parameters, the differences between Lime and Green are significant. This result is strengthened by the evaluation of the basal parameters (Figure ), which are merged performance indicators defined by Schmidhofer et al. (Citation2014). These parameters more or less give a compressed picture of the playing styles of the investigated groups. It clearly indicates that the playing structure on the Lime Court is far closer to ATP than on the Green Court. Furthermore, in three of those six parameters Lime is closest to ATP of all four analysed youth groups. Thus, the Lime Court closes the gap between Orange and Green, which was found and defined by Schmidhofer et al. (Citation2014). The results give a strong evidence for the Lime Court having vital advantages towards the Green Court for the development of elite kids’ tennis players. Furthermore, it strengthens the argument to use the Lime Court for training and tournaments of 9-year olds and to switch to the Green stage with about 10.5–11 years. However, so far the Lime Court is not recognised in international youth tennis and even in its inventor country Austria its usage is declining. The reasons therefore may mainly be the higher effort to prepare the Lime Court (Miley, Citation2007). Whereas for the other scaled courts partly/mostly the existing lines of the full court can be used, the Lime Court requires to manually prepare all court lines. However, for a professional development of elite kids’ tennis players this should be no serious obstacle. Maybe the results of this study raise discussions to reconsider this topic.
Disclosure statement
No potential conflict of interest was reported by the authors.
References
- Altman, D. (2011). Practical Statistics for medical research. London: Chapman and Hall.
- Anderson, K. (2007). United States Tennis Association Project 36/60. ITF Coaching and Sport Science Review, 42, 17.
- Austrian Tennis Federation. (2016). Courts/Rackets. Retrieved October 18, from http://www.oetv.at/kids-jugend/courtsbaellerackets.html
- Cabral, V. (2010). Tennis 10s and play and stay in Portugal. ITF Coaching and Sport Science Review, 51, 24–25.
- Crespo, M., McInerney, P., & Miley, D. (2007). Editorial. ITF Coaching and Sport Science Review, 42(15), 1.
- Declercq, L. (2010). 10 and under competitive framework. ITF Coaching and Sport Science Review, 51, 9–10.
- Ebert, M. (2012). “ORANGE-?-GREEN, Missing link in terms of player (Game) development?” ITF Play & Stay Seminar, London, November 27–30.
- Gonzalez, R. (2012). Tennis 10s: Adapting coaching methodology to the rule change. ITF Coaching and Sport Science Review, 57, 23–24.
- ITF (2016). Stages of Tennis 10s. Retrieved October 18, from http://www.tennisplayandstay.com/tennis10s/about-tennis10s/stages-of-tennis10s.aspx
- Larson, E. J., & Guggenheimer, J. D. (2013). The effects of scaling tennis equipment on the forehand groundstroke performance of children. Journal of Sports Science and Medicine, 12, 323–331.
- Martens, S., & De Vylder, M. (2007). The use of low compression balls in the development of high performance players. ITF Coaching and Sport Science Review, 42, 3–4.
- McEnroe, P. (2010). The importance of slower balls and smaller courts in developing high performance 10 and under players. ITF Coaching and Sport Science Review, 51, 26.
- Miley, D. (2007). Tennis … Play and stay. ITF Coaching and Sport Science Review, 42, 2–3.
- Miley, D. (2010). Serve Rally and Score…. The ITF tennis play and stay campaign and tennis 10S. ITF Coaching and Sport Science Review, 51, 3–4.
- Newman, J. (2010). Why smaller balls and smaller courts for 10 and under players? ITF Coaching and Sport Science Review, 51, 5–6.
- Reid, M., Buszard, T., Farrow, D., & Masters, R. (2013). Implicit motor learning: Designing practice for performance. ITF Coaching and Sport Science Review, 60, 3–5.
- Schmidhofer, S., Leser, R., & Ebert, M. (2014). A comparison between the structure in elite tennis and kids tennis on scaled courts (Tennis 10s). International Journal of Performance Analysis in Sport, 14, 829–840.
- Tennant, M. (2011). Orange to green: The step to the big court. ITF Coaching and Sport Science Review, 57, 23–24.
- Tennis4kids. (2016). Tennis4kids. Retrieved October 18, from https://www.tennis4kids.at/index.php?id=853
- Tennisplayandstay. (2016). Stages of Tennis10s. Retrieved December 21, from http://www.tennisplayandstay.com/tennis10s/about-tennis10s/stages-of-tennis10s.aspx