
ABSTRACT
In this study, 3,767 balls bowled by international-level fast bowlers across two One-Day International (ODI) tournaments were analysed to determine how to effectively bowl during the “death” phase of an innings (final 10 overs). The results of chi-squared analyses revealed that bowling length, bowling line, batter quality and having wickets in hand were all associated with the concession of runs during the death phase (all p < 0.001). Specifically, the yorker length is revealed to be very effective at restricting runs conceded, whereas the opposite is true for the half-volley and full-toss lengths. The batting side having five or more wickets in hand results in greater than expected runs being scored during the death phase. Furthermore, the results reveal that middle order batters score more runs than their tail-ender team-mates during this death phase, suggesting that middle-order batters have to assume the role of “finishers”. From a practical perspective, the results of this study clearly identify areas bowlers can target to constrict the scoring of runs as well as areas they should avoid. Batting strategies in the death phase should consist maintaining five or more wickets in hand and thereby not exposing tail-enders to the bowling attack.
1. Introduction
Performance analysis is a relatively new branch of sports science; however, it has been the focus of much interest in recent years, and it is now evolved to the point where it is considered to be an integral part of the coaching process (Mackenzie & Cushion, Citation2013). Performance analysis consists of the objective recording and examination of behavioural events that occur in a competitive match setting (Lago, Citation2009). One of the main aims of performance analysis is to identify strengths, which can then be further developed and weaknesses, which suggest areas for improvement (Lago, Citation2009). Another aim of performance analysis is to identify those key characteristics (commonly referred to as key performance indicators) that have to be successfully actioned in order for the athlete or team to obtain a positive outcome (M. D. Hughes & Bartlett, Citation2002; M. Hughes et al., Citation2012). To this extent, much research has been conducted in recent years as a means to identify key performance indicators that impact match outcomes in various sports including, football, cricket, tennis and rugby (Irvine & Kennedy, Citation2017; Jamil, Liu, et al., Citation2021; M. D. Hughes & Bartlett, Citation2002; M. Hughes et al., Citation2012; Mehta et al., Citation2022; O’Donoghue & Ingram, Citation2001).
The continuing evolution of research in the field of sports performance analysis has shifted more recently to focus less on match outcomes and more on specific phases of play within a sporting event. For example, set-to-set variations of technical, tactical and physical performance variables have been analysed in tennis, where it has been discovered that although physical performance deteriorates in the latter sets relative to initial sets, some aspects of technical performance improve (Cui et al., Citation2020). The physical demands of the newly conceived four-quarter match format of field hockey have also been the subject of recent research, which has discovered a progressive decline in total distances covered over the four quarters of match-play (Ihsan et al., Citation2021). Similarly, the impact of several situational variables on quarter performances in basketball has also been previously examined and it has been revealed that game location, starting score-lines and the quality of the opponent can all impact quarter performance (Sampaio et al., Citation2010). Specific phases and time periods within matches have also been examined in football (soccer), with research predominantly focusing on score-lines and match status (Almeida et al., Citation2014), injury time allocation (Butler & Butler, Citation2017), the timing of goals (Lago-Peñas et al., Citation2016) and the timing of penalty kicks (Almeida et al., Citation2016; Jamil et al., Citation2020). This research has revealed that factors such as match status, scoring first and the timing of penalty kicks can all impact performance levels and match outcomes (Almeida et al., Citation2014, Citation2016; Jamil et al., Citation2020; Lago-Peñas et al., Citation2016). Specific phases of play have also been examined in cricket with research examining the powerplay period, which has been revealed to be a phase of the game that should be targeted by batters as a means to accumulate runs (Douglas & Tam, Citation2010), particularly as the field restrictions imposed by powerplays can be advantageous to the batters (Jamil et al., Citation2022; Silva et al., Citation2015). Furthermore, performances during specific innings of cricket matches have been examined, and it has been revealed that batting performances tend to decline in the second innings of matches (Connor et al., Citation2019).
Something that has been relatively overlooked in the previous research, however, is how to perform effectively during what is commonly referred to as the “death” phase in cricket matches. The death phase of an innings is not an official phase of a cricket match and is not referenced in any version of the International Cricket Council’s (ICC) rules and regulations. Instead, death bowling is a terminology frequently mentioned by pundits, commentators and general cricket enthusiasts and refers to the end of an innings. It is perceived that bowling becomes more difficult late in an innings as batters often tend to adopt a high-risk run scoring strategy as a means to enhance the run rate (Woolmer et al., Citation2008, p.391). Therefore, being able to bowl effectively during this “death” phase of an innings and restricting the number of runs conceded requires a high level of bowling skill and application (Irvine & Kennedy, Citation2017; Jamil, Harkness, et al., Citation2021). This difficulty of bowling at the death for bowlers is further enhanced as optimal batting strategies consist of maintaining wickets in hand (O’Donoghue, Citation2016), ensuring skilled batters are at the crease during the final 10 overs. During the final 10 over phase of an innings it is advised that batting teams should aim for around at least 8–10 runs an over (Woolmer et al., Citation2008, p.394). As the death bowling phase is not an official phase of a cricket match, it has several alternative definitions. Professional coaches have previously claimed that batters should adopt a high-risk run accumulation strategy when there are as many as 15 overs left in the innings (Woolmer et al., Citation2008, p.395). Alternatively, in a recent study investigating ageing effects in 50-over cricket, the death bowling phase was defined as the final four overs of a 50-over innings (Jamil, Harkness, et al., Citation2021). Anecdotal sources suggest that the death bowling phase coincides with powerplay 3, a period referring to the final 10 overs where a greater number of fielders than at any stage previously can patrol the boundary, but still only a maximum of five (Luke, Citation2022). For the purposes of this study, the death phase will be defined as the final 10 overs of the innings.
This study will address the lack of research in the death phases of cricket matches and will attempt to determine how bowlers can effectively bowl during this phase as well as which strategies would serve the batting team best. This study will also focus exclusively on fast bowlers for the main reason that previous research has established links between successful team performance and the performance of these higher “rated” individuals (Wormgoor et al., Citation2010). Fast bowlers are considered to be integral members of any team, and they have the ultimate objective of restricting the number of runs scored by the batting team whilst also dismissing opposing batters (Feros et al., Citation2018). For fast bowlers to be successful, they develop a repertoire of skills, which consist of inducing ball swing movement, seam movement, deliberately varying their bowling speed, deliberately imparting some backspin and intentionally (or unintentionally) bowling varying lines and lengths (Edwards & Beaton, Citation1996; L. Justham et al., Citation2006, Citation2008; L. M. Justham et al., Citation2010; Mehta et al., Citation2022; Müller et al., Citation2006; Phillips et al., Citation2012; Scobie et al., Citation2020). This study will attempt to identify specifically which bowling variations aid bowlers fulfil one of their main objectives (preventing the concession of runs) during what is perceived to be the most difficult time to bowl, the “death phase”. The potential influence of additional factors such as batting skill and having wickets in hand on bowling performances during the death phase will also be examined.
2. Methods
2.1. Design and data
In total, 3,767 balls bowled during the death phase (final 10 overs of an innings), across 48 mens’ international ODI matches were analysed in this study. A total of 58 different bowlers bowled the 3767 balls, where each bowler completed at least one full over (6 legal balls). All balls were bowled by elite performers during the ICC Champions Trophy 2017 or the ICC World Cup 2019. Data were privately acquired from Opta (Stats Perform, London) and all necessary permissions were obtained. High levels of reliability for Opta data have been previously reported (Jamil, Harkness, et al., Citation2021). Only those bowlers classified as fast bowlers were included in the sample for the reasons stated above. The distributions of bowling deliveries in terms of bowling variation and bowling length are presented in nd espectively. Variables considered in this analysis consisted of bowling hand, bowling variation, bowling length, bowling line, innings (batting first or batting second), batter quality and the number of wickets in hand. Previous research has revealed that handedness can impact performances in cricket (Edwards & Beaton, Citation1996; Jamil et al., Citation2022; L. Justham et al., Citation2008; L. M. Justham et al., Citation2010) and is in fact a performance variable that is frequently ignored in research studies (Petersen, Citation2017). Bowling variations comprising off lateral movement (swing or seam), deliberate variations in pace (slower balls), deliberate imparting of spin on the ball (cutters) as well as general variations in bowling landing zones (line and length) have also been known to influence performances (L. M. Justham et al., Citation2010; Mehta et al., Citation2022; O’Donoghue, Citation2016; Scobie et al., Citation2013). The impact of innings (first or second) upon batting and bowling performances has also been previously investigated (Bhattacharjee & Lemmer, Citation2016; Connor et al., Citation2019). Similarly, much research has been conducted on batting quality and favoured batting strategies (Adie et al., Citation2022; Connor et al., Citation2018; O’Donoghue, Citation2016). For the reasons stated above, each of these performance variables (and sub-variables) was included for analysis in this study. A full definitions list provided by the data supplier of the variables analysed in this study is presented in . The number of runs conceded was coded as a binary variable, “yes” – if between 1 and 6 runs were conceded on any ball bowled and “no” – if 0 runs were conceded on any ball bowled (hereafter referred to as a dot ball). Ethical approval for this study was obtained by the ethics committee of the local institution.
Figure 1. Proportion of types of delivery bowled during the death phase.
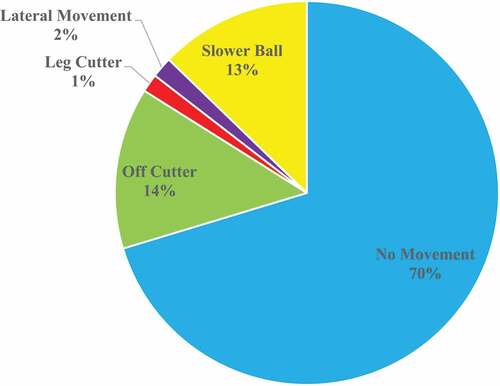
Figure 2. Proportion of lengths of delivery bowled during the death phase .
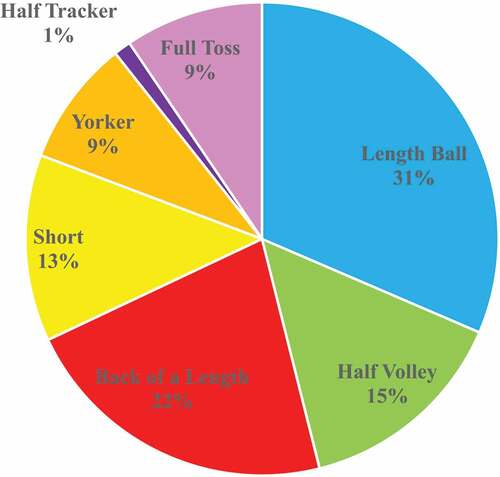
Table 1. Definitions list for all variables and sub-variables utilised in this study.
2.2. Statistical analysis
In this study, Chi-square (χ2) tests of independence were conducted in order to determine whether there was a statistically significant association between the bowling and batter team variables. The dataset consisted of nominal data variables and each ball bowled contributed to one and only one cell in each of the χ2 tests conducted in this study (McHugh, Citation2013). Each ball bowled was treated as a separate entity due to the large degree of variations (detailed above) exhibited ball-by-ball. The values of the cell expected counts were greater than 5 for at least 80% of all expected count cells, and no expected count value was less than 1 (McHugh, Citation2013). In cases where 2 × 2 contingency tables were formed, Fisher’s exact test were conducted (McHugh, Citation2013) and all results (as well as the critical values for the Bonferroni adjusted p-values) are presented in . In the event of statistically significant (alpha = 0.05) χ2 test results, standardised residuals were calculated to identify the specific cells making the greatest contribution to the chi-square test result and thus determine the source of the significant result (Sharpe, Citation2015). Bonferroni corrections were applied to account for the relatively large number of cells present in the contingency tables (Sharpe, Citation2015) and all results are presented in . Cramer’s V effect sizes were also calculated (McHugh, Citation2013) and interpreted with the widely used thresholds of 0.1 ≤ weak < 0.3, 0.3 ≤ moderate < 0.5 and strong ≥0.5 (Cohen, Citation1988). All statistical analyses were performed using IBM SPSS version 25 (IBM Corp. Released 2017. IBM SPSS Statistics for Macintosh, Version 25.0. IBM Corp, Armonk, NY).
Table 2. Chi-square test results and effect sizes.
Table 3. Observed Counts (Expected Counts) and Standardised Residual Values.
3. Results
reveals that bowling length (χ2 = 82.830; p < 0.001) and bowling line (χ2 = 32.634; p < 0.001) each have a significant association with the variable runs conceded. The quality of batters during the death phase was also significantly associated with the concession of runs by bowlers (χ2 = 110.350; p < 0.001). Similarly, having wickets in hand was also significantly associated with the concession of runs (χ2 = 57.951; p < 0.001). The variables bowling hand, bowler variation and innings were ultimately revealed to be non-significant when the Bonferroni correction was applied. The Cramer’s V measure of effect sizes revealed that bowling length (V = 0.148), batter quality (V = 0.171) and having wickets in hand (V = 0.124) each had a small effect, whereas bowling line (V = 0.093) had a trivial effect.
reveals that fewer than expected “full-toss” deliveries resulted in dot balls (SR = −4.0), whereas greater than expected full-toss deliveries resulted in runs being conceded (SR = 3.0). Similarly, the “half-volley” bowling length also resulted in fewer than expected dot balls (SR = −3.8); however, the “yorker” length resulted in greater than expected dot balls (SR = 3.5). According to the results, bowlers tried to bowl most balls on a good length (1185 balls) and this is substantiated as the second-highest number of deliveries was bowled back of a length (825 balls). The third-highest number of balls bowled (551) were half volleys, which could indicate that the bowlers tried to bowl the yorker (324 balls), but did not get their lengths correct. Likewise, the 357 full-toss balls could also indicate that bowling yorkers in the last 10 overs is part of the bowling strategy; however, when bowlers miss their mark in length, they are punished as greater than expected runs are scored from half-volleys and full-toss deliveries. With regard to bowling line, the post-hoc analysis of standardised residuals reveals that only the wide ball was associated with the concession of runs, with fewer than expected wide balls resulting in dot balls (SR = −3.9). This is perhaps not too surprising a result as according to the laws of 50-over mens’ international cricket, wide deliveries result in the batting team being awarded an extra run, whilst the bowling team are required to bowl the ball again (ICC, Citation2021). also reveals that fewer than expected dot balls were bowled when a middle-order batter was facing the bowling delivery (SR = −4.2), whereas greater than expected number of balls resulted in dot balls when a tail-ender was facing the bowling delivery (SR = −4.5). This could be indicative of batting strategies during the death phase. Around 65% of all balls bowled were faced by either top-order batters (527 balls) or middle-order batters (1,930 balls), suggesting teams do not wish to expose their tail to opposition bowlers during this phase. The results in also reveal that on occasions when the batting team had fewer than five wickets in hand, then greater than expected dot balls were bowled (SR = 4.1). On the contrary, if the batting team had five or more wickets in hand, it resulted in fewer than expected dot balls being bowled (SR = −4.5). This could be indicative of the skill levels of batters as well as the levels of risk batters are willing to take during this death phase depending upon their team’s collective batting performance leading up to it. Around 45% of all balls bowled during the death phase were faced by teams that had five or more wickets in hand (1,699 balls) and in these cases, greater than expected runs were scored, suggesting batters are either more willing or more capable of attacking bowlers when their team has wickets in hand. Conversely, around 55% of all balls bowled (2,068 balls) were faced by teams that had fewer than five wickets in hand, and on these occasions, runs were not scored as freely, implying batters either lack the skill to attack bowlers or are more risk-averse.
isplays the proportion of bowling variations adopted by bowlers during the death phase. Around only 2% of all balls bowled exhibited any kind of lateral movement (swing or seam), with the vast majority of balls (around 70%) exhibiting no movement. Deliberate changes in delivery speed (slower balls) account for around 13% of all balls bowled during the death phase. Bowlers deliberately imparting some spin on the ball (cutters) account for around 15% of all balls bowled during the death phase. isplays the proportion of varying lengths bowled by bowlers during the death phase. Around 31% of all balls bowled during this death phase were bowled on a good length, with around an additional 22% of all balls bowled just back of a good length. The short ball accounted for 13% of all balls bowled and the half-tracker accounted for only around 1% of all balls bowled during the death phase. Fuller pitched deliveries, such as the half-volley and yorker accounted for roughly 15% and 9% of all balls bowled during the death phase, respectively. The remaining balls bowled during the death phase (around 9%) did not bounce and were therefore classified as full-toss deliveries.
4. Discussion
This study aimed to investigate which factors affected player and team performances during the “death” phase of an innings in men’s international 50-over cricket. The results revealed that during the death phase, bowling length is significantly associated with the concession of runs. Specifically, the half volley and full-toss lengths resulted in fewer than expected dot balls, whereas the opposite was discovered to be true for the yorker length. Bowling line was also revealed to impact effective death bowling, with wide balls specifically resulting in fewer than expected dot balls, which is to be expected given the rules of 50-over cricket as wide bowling is penalised with the concession of 1 run. Batter quality was also associated with the concession of runs during the death phase, with fewer than expected dot balls bowled to middle-order batters, whereas greater than expected dot balls were bowled to tail-enders. The batting team having wickets in hand also affected the concession of runs during the death bowling phase as having five or more wickets in hand resulted in significantly fewer than expected dot balls, whereas the opposite was discovered to be true in cases when teams had less than 5 wickets in hand. The hand the bowler bowled with, the bowling variations the bowler bowled and whether the bowlers were bowling in the first or second innings were not significantly associated with bowling performances during the death phase.
Previous studies have discovered that bowling length is crucial with regard to bowling performances (Moore et al., Citation2012; Najdan et al., Citation2014). Specifically, the yorker length has been known to be associated with winning matches (Najdan et al., Citation2014) and is generally regarded as being the hardest length for batters to strike (Moore et al., Citation2012). The results of this study support previous findings as the yorker length was revealed to result in greater than expected dot balls. On the contrary, half-volley and full-toss lengths resulted in fewer than expected dot balls. This could be partly explained by the half-volley length being particularly susceptible to power-hitting strokes (Taliep et al., Citation2010). Furthermore, both half-volley and full-toss lengths are considered to be vulnerable to the “drive” stroke from opposing batters (Connor et al., Citation2020). On the basis of the results discovered in this study, bowlers should focus more on honing their skills on bowling the yorker length during the death phase of the innings as this is particularly effective at restricting the number of runs the batting team score. The results also suggest that the margins for error when attempted to bowl a yorker are very small, as failed attempts that likely result in the full-toss or half-volley lengths, are frequently punished by opposing batters.
The quality of the batting order and the batting team having wickets in hand were both revealed to result in fewer than expected dot balls during the death bowling phase. As stated by Woolmer et al. (Citation2008, p.396), an optimal batting strategy consists of a batting team having several wickets in hand when in the last 15 overs of an innings. Having wickets in hand towards the end of an innings therefore makes an attacking batting strategy more tolerable, enabling batters greater freedom to perform high-risk strokes in their pursuit of additional runs (O’Donoghue, Citation2016). Similarly, previous research has revealed that traditionally during an innings, the batting team will send their best and most skilled batters out early, meaning that as the wicket count for the bowling team increases, the batters tend to be less skilled (Adie et al., Citation2022). According to the results discovered in this study, batting strategies when entering the death phase of an innings should consist of maintaining wickets in hand. Ultimately, the top-order and top-middle-order batters should look to face the majority of all balls bowled in the first 40 overs of the innings. This would then allow the same batters (and subsequent batters) the freedom to perform a greater number of high-risk strokes in their pursuit of additional runs in the final 10 overs.
A somewhat surprising result obtained in this study is that bowling variations were not revealed to be significantly associated with the concession of runs. Lateral movements, such as swing bowling and seam bowling, have been previously revealed as effective skills for a bowler to possess in order to fulfil their broad objectives of taking wickets and preventing the concession of runs (Mehta et al., Citation2022; Müller & Abernethy, Citation2006; Phillips et al., Citation2012; Scobie et al., Citation2013, Citation2020). Furthermore, other bowling variations that are frequently bowled by skilled bowlers such as the “slower ball” or “cutter” deliveries are also known to aid general bowling performance (Feros et al., Citation2019; L. Justham et al., Citation2006, Citation2008). This study revealed that these bowling variations are not significantly associated with the concession of runs during the death phase of an innings. It should be noted, however, that the dependent variable was of binary nature (yes/no) and it could well be the case that certain bowling variations, such as balls that exhibit lateral movement, the slower ball and cutter deliveries lead to the concession of fewer or a greater number of runs (1–6). Establishing the existence of this relationship was beyond the scope of this study and requires further research. Furthermore, it may be the case that these variations are associated with other bowling objectives, such as taking wickets, further emphasising the need for additional research on how to bowl effectively during the death phase of an innings.
This study was not without its limitations. There was no information available within the dataset regarding whether the ball was delivered by the bowler from over the wicket or around the wicket and it is possible that this alteration of bowling angles affected bowling performances (L. M. Justham et al., Citation2010). In addition, data on the movement of the batters at the crease could also have potentially impacted the present results. Finally, only the One-Day International format was investigated in this study. It could well be the case that different bowling factors are revealed to be of significance during the death phases of matches in the shorter T20 (20-over) format or the newly conceived “The Hundred” format. Future studies should expand on this research and further analyse how to bowl effectively at the death, whilst incorporating the additional variables detailed above across numerous formats.
5. Conclusion
This study suggests that bowling lengths are associated with the concession of runs during the death phase of an innings. Specifically, the yorker length results in greater than expected dot balls, whereas the full-toss and half-volley lengths are susceptible to run scoring strokes. From a practical perspective, coaches should work with bowlers and further develop and refine their ability to bowl the yorker length during the death phase of an innings as this is particularly effective at restricting the number of runs the batting team score. This study has also discovered that the margins for error when attempting a yorker are very small and the punishment for failing to execute it correctly are severe, further emphasising the need for additional coaching. The batting team having wickets in hand is also revealed to be somewhat perilous for the bowling team as fewer than expected dot balls are bowled if the batting team have five or more wickets in hand. Similarly, greater batter quality is associated with greater run scoring during the death phase. From a practical perspective, batters should look to maximise run scoring opportunities when facing half-volley length or full-toss deliveries and batting teams’ strategies should consist of keeping five or more wickets in hand going into the final 10 overs of the innings. On the other hand, bowling teams’ strategies should consist of taking as many wickets as possible prior to the start of the 41st over in order to ensure tail-enders are batting during this death phase.
Disclosure statement
No potential conflict of interest was reported by the authors.
References
- Adie, J. M., Renshaw, I., Polman, R., & Mann, D. L. (2022). No expectation bias in elite-level cricket umpires’ leg-before-wicket (LBW) decisions according to batting order position. Psychology of Sport and Exercise, 60(June 2021), 102145. https://doi.org/10.1016/j.psychsport.2022.102145
- Almeida, C. H., Ferreira, A. P., & Volossovitch, A. (2014). Effects of match location, match status and quality of opposition on regaining possession in UEFA champions league. Journal of Human Kinetics, 41(1), 203–214. https://doi.org/10.2478/hukin-2014-0048
- Almeida, C. H., Volossovitch, A., & Duarte, R. (2016). Penalty kick outcomes in UEFA club competitions (2010-2015): The roles of situational, individual and performance factors. International Journal of Performance Analysis in Sport, 16(2), 508–522. https://doi.org/10.1080/24748668.2016.11868905
- Bhattacharjee, D., & Lemmer, H. H. (2016). Quantifying the pressure on the teams batting or bowling in the second innings of limited overs cricket matches. International Journal of Sports Science & Coaching, 11(5), 683–692. https://doi.org/10.1177/1747954116667106
- Butler, R., & Butler, D. (2017). Fergie time and the allocation of additional time: Evidence from the English premier league 2009 to 2013. International Journal of Sport Finance, 12(3), 185–203.
- Cohen, J. (1988). Statistical power analysis for the behavioral sciences (2nd ed.). L. Erlbaum Associates.
- Connor, J. D., Farrow, D., Renshaw, I., Raynor, A., & Connor, J. D. (2018). Emergence of skilled behaviors in professional, amateur and junior cricket batsmen during a representative training scenario. Frontiers in Psychology, 9(October), 1–14. https://doi.org/10.3389/fpsyg.2018.02012
- Connor, J. D., Renshaw, I., & Farrow, D. (2020). Defining cricket batting expertise from the perspective of elite coaches. PLoS One, 15(6), e0234802. https://doi.org/10.1371/journal.pone.0234802
- Connor, J. D., Sinclair, W. H., Leicht, A. S., & Doma, K. (2019). Analysis of Cricket Ball Type and Innings on State Level Cricket Batter’s Performance. Frontiers in Psychology, 10, 2347. https://doi.org/10.3389/fpsyg.2019.02347
- Cui, Y., Liu, H., Gómez, M. Á., Liu, H., & Gonçalves, B. (2020). Set-to-set performance variation in tennis grand slams: Play with consistency and risks. Journal of Human Kinetics, 73(1), 153–163. https://doi.org/10.2478/hukin-2019-0140
- Douglas, M. J., & Tam, N. (2010). Analysis of team performances at the ICC World Twenty20 Cup 2009. International Journal of Performance Analysis in Sport, 10(1), 47–53. https://doi.org/10.1080/24748668.2010.11868500
- Edwards, S., & Beaton, A. (1996). Howzat?! Why is there an over-representation of left-handed bowlers in professional cricket in the UK? Laterality, 1(1), 45–50. https://doi.org/10.1080/713754208
- Feros, S. A., Young, W. B., & O’brien, B. J. (2018). Quantifying cricket fast-bowling skill. International Journal of Sports Physiology and Performance, 13(7), 830–838. https://doi.org/10.1123/ijspp.2017-0169
- Feros, S. A., Young, W. B., & O’brien, B. J. (2019). Relationship between selected physical qualities, bowling kinematics, and pace bowling skill in club-standard cricketers. Journal of Strength and Conditioning Research, 33(10), 2812–2825. https://doi.org/10.1519/JSC.0000000000002587
- Hughes, M. D., & Bartlett, R. M. (2002). The use of performance indicators in performance analysis. Journal of Sports Sciences, 20(10), 739–754. https://doi.org/10.1080/026404102320675602
- Hughes, M., Caudrelier, T., James, N., Redwood-Brown, A., Donnelly, I., Kirkbride, A., & Duschesne, C. (2012). Moneyball and soccer - an analysis of the key performance indicators of elite male soccer players by position. Journal of Human Sport & Exercise, 7(SPECIALISSUE.2), 402–412. https://doi.org/10.4100/jhse.2012.72.06
- ICC. (2021). ICC men’s one-day international playing conditions. International Cricket Council. https://resources.pulse.icc-cricket.com/ICC/document/2021/06/08/0bf2b097-a4f9-45b2-987d-ffdb8acf517c/ICC-Men-s-Standard-ODI-Playing-Conditions-May-2021.pdf
- Ihsan, M., Yeo, V., Tan, F., Joseph, R., Lee, M., & Aziz, A. R. (2021). Running demands and activity profile of the new four-quarter match format in men’s field hockey. Journal of Strength and Conditioning Research, 35(2), 512–518. https://doi.org/10.1519/JSC.0000000000002699
- Irvine, S., & Kennedy, R. (2017). Analysis of performance indicators that most significantly affect International Twenty20 cricket. International Journal of Performance Analysis in Sport, 17(3), 350–359. https://doi.org/10.1080/24748668.2017.1343989
- Jamil, M., Harkness, A., Mehta, S., Phatak, A., Memmert, D., & Beato, M. (2021). Investigating the impact age has on within-over and death bowling performances in international level 50-over cricket. Research in Sports Medicine, 00(00), 1–10. https://doi.org/10.1080/15438627.2021.1954515
- Jamil, M., Kerruish, S., Beato, M., & McErlain-Naylor, S. A. (2022). The effects of bowling lines and lengths on the spatial distribution of successful power-hitting strokes in international men’s one-day and T20 cricket. Journal of Sports Sciences, 00(00), 1–9. https://doi.org/10.1080/02640414.2022.2148074
- Jamil, M., Littman, P., & Beato, M. (2020). Investigating inter-league and inter-nation variations of key determinants for penalty success across European football. International Journal of Performance Analysis in Sport, 20(5), 892–907. https://doi.org/10.1080/24748668.2020.1794720
- Jamil, M., Liu, H., Phatak, A., & Memmert, D. (2021). An investigation identifying which key performance indicators influence the chances of promotion to the elite leagues in professional European football. International Journal of Performance Analysis in Sport, 21(4), 641–650. https://doi.org/10.1080/24748668.2021.1933845
- Justham, L. M., Cork, A. E. J., & West, A. A. (2010). Comparative study of the performances during match play of an elite-level spin bowler and an elite-level pace bowler in cricket. Proceedings of the Institution of Mechanical Engineers, Part P: Journal of Sports Engineering and Technology, 224(4), 237–247. https://doi.org/10.1243/17543371JSET77
- Justham, L., West, A., & Cork, A. (2008). Quantification and characterization of cricket bowling technique for the development of the parameters required for a novel training system for cricket. Proceedings of the Institution of Mechanical Engineers, Part P: Journal of Sports Engineering and Technology, 222(2), 61–76. https://doi.org/10.1243/17543371JSET25
- Justham, L., West, A., Harland, A., & Cork, A. (2006). Quantification of the cricket bowling delivery; a study of elite players to gauge variability and controllability. In The engineering of sport 6 (pp. 205–210). Springer New York. https://doi.org/10.1007/978-0-387-46050-5_37
- Lago, C. (2009). The influence of match location, quality of opposition, and match status on possession strategies in professional association football. Journal of Sports Sciences, 27(13), 1463–1469. https://doi.org/10.1080/02640410903131681/
- Lago-Peñas, C., Gómez-Ruano, M., Megías-Navarro, D., & Pollard, R. (2016). Home advantage in football: Examining the effect of scoring first on match outcome in the five major European leagues. International Journal of Performance Analysis in Sport, 16(2), 411–421. https://doi.org/10.1080/24748668.2016.11868897
- Luke. (2022). What are the Death Overs in Cricket? Cricketershub.Com. https://cricketershub.com/what-are-the-death-overs-in-cricket/?utm_content=cmp-true
- Mackenzie, R., & Cushion, C. (2013). Performance analysis in football: A critical review and implications for future research. Journal of Sports Sciences, 31(6), 639–676. https://doi.org/10.1080/02640414.2012.746720
- McHugh, M. L. (2013). The Chi-square test of independence. Biochemia Medica, 23(2), 143–149. https://doi.org/10.11613/BM.2013.018
- Mehta, S., Phatak, A., Memmert, D., Kerruish, S., & Jamil, M. (2022). Seam or swing? Identifying the most effective type of bowling variation for fast bowlers in men’s international 50-over cricket. Journal of Sports Sciences, 40(14), 1587–1591. https://doi.org/10.1080/02640414.2022.2094140
- Moore, A., Turner, D. J., & Johnstone, J. A. (2012). A preliminary analysis of team performance in English first-class twenty-twenty (t20) cricket. International Journal of Performance Analysis in Sport, 12(1), 188–207. https://doi.org/10.1080/24748668.2012.11868593
- Müller, S., & Abernethy, B. (2006). Batting with occluded vision: An in situ examination of the information pick-up and interceptive skills of high- and low-skilled cricket batsmen. Journal of Science and Medicine in Sport, 9(6), 446–458. https://doi.org/10.1016/j.jsams.2006.03.029
- Müller, S., Abernethy, B., & Farrow, D. (2006). How do world-class cricket batsmen anticipate a bowler’s intention? The Quarterly Journal of Experimental Psychology, 59(12), 2162–2186. https://doi.org/10.1080/02643290600576595
- Najdan, M. J., Robins, M. T., & Glazier, P. S. (2014). Determinants of success in English domestic Twenty20 cricket. International Journal of Performance Analysis in Sport, 14(1), 276–295. https://doi.org/10.1080/24748668.2014.11868721
- O’Donoghue, P. (2016). Wicket loss and risk taking during the 2011 and 2015 cricket world cups. International Journal of Performance Analysis in Sport, 16(1), 80–95. https://doi.org/10.1080/24748668.2016.11868872
- O’Donoghue, P., & Ingram, B. (2001). A notational analysis of elite tennis strategy. Journal of Sports Sciences, 19(2), 107–115. https://doi.org/10.1080/026404101300036299
- Petersen, C. J. (2017). Comparison of performance at the 2007 and 2015 Cricket World Cups. International Journal of Sports Science & Coaching, 12(3), 404–410. https://doi.org/10.1177/1747954117711338
- Phillips, E., Portus, M., Davids, K., & Renshaw, I. (2012). Performance accuracy and functional variability in elite and developing fast bowlers. Journal of Science and Medicine in Sport, 15(2), 182–188. https://doi.org/10.1016/j.jsams.2011.07.006
- Sampaio, J., Lago, C., Casais, L., & Leite, N. (2010). Effects of starting score-line, game location, and quality of opposition in basketball quarter score. European Journal of Sport Science, 10(6), 391–396. https://doi.org/10.1080/17461391003699104
- Scobie, J. A., Pickering, S. G., Almond, D. P., & Lock, G. D. (2013). Fluid dynamics of cricket ball swing. Proceedings of the Institution of Mechanical Engineers, Part P: Journal of Sports Engineering and Technology, 227(3), 196–208. https://doi.org/10.1177/1754337112462320
- Scobie, J. A., Shelley, W. P., Jackson, R. W., Hughes, S. P., & Lock, G. D. (2020). Practical perspective of cricket ball swing. Proceedings of the Institution of Mechanical Engineers, Part P: Journal of Sports Engineering and Technology, 234(1), 59–71. https://doi.org/10.1177/1754337119872874
- Sharpe, D. (2015). Your chi-square test is statistically significant: Now what? Practical Assessment, Research, and Evaluation, 20(8), 1–10. https://doi.org/10.7275/tbfa-x148
- Silva, R. M., Manage, A. B. W., & Swartz, T. B. (2015). A study of the powerplay in one-day cricket. European Journal of Operational Research, 244(3), 931–938. https://doi.org/10.1016/j.ejor.2015.02.004
- Taliep, M. S., Prim, S. K., & Gray, J. (2010). Upper body muscle strength and batting performance in cricket batsmen. Journal of Strength and Conditioning Research, 24(12), 3484–3487. https://doi.org/10.1519/JSC.0b013e3181e7261b
- Woolmer, B., Noakes, T., & Moffett, H. (2008). Bob Woolmer’s Art and Science of Cricket. New Holland Publishers (UK) Ltd.
- Wormgoor, S., Harden, L., & Mckinon, W. (2010). Anthropometric, biomechanical, and isokinetic strength predictors of ball release speed in high-performance cricket fast bowlers. Journal of Sports Sciences, 28(9), 957–965. https://doi.org/10.1080/02640411003774537