
 ?Mathematical formulae have been encoded as MathML and are displayed in this HTML version using MathJax in order to improve their display. Uncheck the box to turn MathJax off. This feature requires Javascript. Click on a formula to zoom.
ABSTRACT
Within team sports, match outcomes and events depend on the interaction between thousands of individual actions governed by each team’s overriding style of play. Within Australian football, identifying playing styles allows coaches to improve match preparation due to an improved knowledge base that influences decisions involving training sessions, match tactics, and team selection. This study presents the clustering of teams in the Australian Football League (AFL) into playing styles based on match performance indicators extracted from games played between 2013 and 2019. Using k-means clustering, three offensive, two transitional and two scoring styles were identified, combining to create 12 playing styles. The offensive play was grouped into contested, uncontested, and non-distinct styles. The transitional play was clustered into forward half-pressure and defensive half-intercept styles. The scoring play was clustered into stoppage scoring and possession gain scoring styles. The linear model predicting the winning match margin from the explanatory variables of team playing styles and performance indicators had a lower RMSE by 64% compared to models with only playing style explanatory variables and 1.83% to models with only performance indicator explanatory variables. Identifying team playing styles allows coaches to make better-informed decisions regarding match analysis, opposition analysis, and training planning.
1. Introduction
Professional sporting organisations use quantitative analysis to assist the decision-making processes of coaches, performance analysts and other team personnel (Wright et al., Citation2013). Analyses can explore and identify performance at the individual and team levels, strengths and weaknesses of skill execution and the prediction of match outcomes (Robertson, Gupta, et al., Citation2016). These insights can complement coaches’ subjective opinions and inform in-game coaching decisions, team selection and training composition (Robertson, Back, et al., Citation2016).
Match outcomes in team sports depend on thousands of individual actions by players in the match; however, the success of each team ultimately depends on an overriding principle of play that governs a team’s style of play (Gréhaigne et al., Citation2005). Principles of play can include the strategies and team tactics, player athletic profiles and performance capability relative to opposition teams and are common to all invasion sports (Gréhaigne & Godbout, Citation1995). Playing style is regularly used to describe how a team has performed or implemented a perceived playing pattern (Greenham et al., Citation2017). Although this term is used widely among coaching groups, media, and sporting enthusiasts, the colloquial use of the term playing style has yet to be supported by scientific research and measurement because of its lack of a strict definition (Greenham et al., Citation2017). Playing style in team invasion games can be described as a combination of the offensive playing style, described as the way a team moves the ball on the field, and the defensive or transitional playing style, defined as the way a team defends against the way the opposing team’s ball movement (Diquigiovanni & Scarpa, Citation2019). In addition to a team offensive and transitional style of play, teams implement strategies that influence the source of scoring plays. Adding a team scoring style could explain the variation of a team’s structural set-up that explains the tactics of scoring and the sources of scoring (Taylor et al., Citation2020).
Professional Australian football (AF) has developed into a physically and technically demanding multidimensional game requiring players to be highly skilled and possess a finely tuned decision-making ability (Gray & Jenkins, Citation2010; Woods et al., Citation2017). Analysis of AF data has identified factors that explain performance, match and quarter outcomes (Josman et al., Citation2020; Robertson, Back, et al., Citation2016; Sheehan et al., Citation2023; Young, Luo, Gastin, Tran, et al., Citation2019). Limited investigation has been completed in other areas, including intrateam behaviour and network analysis (Fransen et al., Citation2022; W. B. Sheehan, R. Tribolet, M. L. Watsford, A. R. Novak, M. J. Rennie, et al., Citation2020; Taylor et al., Citation2020; Young, Luo, Gastin, Lai, et al., Citation2019), spatiotemporal analysis (Sheehan et al., Citation2022), the identification of team playing styles (Greenham et al., Citation2017; Jackson, Citation2016; Lane et al., Citation2020) and the objective assessment of player performance (Jackson, Citation2016; McIntosh et al., Citation2018; Woods et al., Citation2015).
The research identifying playing styles within the AF literature has built upon previous work in other invasion-based sports. Lago-Peñas et al. (Citation2017) identified four prominent association football playing styles: possession style, set-piece attack, counter-attacking play, and transitional play. C. Wedding, C. Woods, W. H. Sinclair, et al. (Citation2021) identified nine consistent playing styles in rugby league. Both studies revealed that these playing styles were unaffected by match type, team quality or match location. Lago-Peñas et al. (Citation2017) and C. Wedding, Woods, Sinclair, et al. (Citation2021) highlighted that the identification of playing styles without further analysis and interpretation holds little value. Through investigation and evaluation of the opposition team’s strengths, weaknesses and predominant style of play, the adaption of the team playing style can lead to a greater chance of team success in addition to the recruitment of players who are capable of playing the style of the team (Lago-Peñas et al., Citation2017).
In AF, limited investigation has been conducted into the clustering of team profiles using performance indicators (PIs). W. B. Sheehan, Tribolet, Watsford, Novak, Rennie, et al. (Citation2020) used principal component analysis to reduce 29 performance indicators into four principal components about different aspects of performance across players. However complex interplay within the players in a team, leading to playing styles was not presented here. Spencer et al. (Citation2016) and Lane et al. (Citation2020) identified offensive and defensive playing styles, while Woods et al. (Citation2017) investigated the evolution of the Australian Football League (AFL) competition playing style over 15 years; however, needed more specificity in defining distinct styles and identifying the numerical change of PIs. Specifically, Woods et al. (Citation2017) identified a significant growth in the use of handballs in the 2005–2010 seasons compared to the years before 2004. The authors also noted a significant change in team PIs from the 2005 to 2009 seasons compared to the 2010 to 2015 (Woods et al., Citation2017). The period from 2010 onwards indicates the introduction of modernised coaching styles oriented around possession and repossession football, where teams look to control the game’s tempo and implement a zone defence when required (Woods et al., Citation2017). Spencer et al. (Citation2016) focused on previous literature investigating the importance of relative PIs and used unsupervised clustering methods such as k-means clustering to develop team profiles. Spencer et al. (Citation2016) identified 20 different playing styles; however, a limitation of the study was the need for more strict boundaries for each playing style and a description of the characteristics of each clustered group. Lane et al. (Citation2020) defined the differences between the PIs of offensive and defensive styles of six AFL teams; however, this pilot study needs to be expanded to all AFL teams to have an informed impact on decision-making. Therefore, this study is aimed to bridge the gap in the analysis of team playing styles in AF. This study will use machine learning techniques to identify and clearly define distinct playing styles and investigate the relationship between playing styles and match outcomes within AFL matches.
2. Methods
The complete workflow, from the data collection, cleaning and wrangling to the final modelling, is outlined in . Furthermore, each step is described in detail below.
Figure 1. A workflow for the methodology to allow for cluster analysis and linear modelling to occur.
2.1. Extraction of ChampionData® data
The data used in this research was transactional match data, collected by ChampionData® (Southbank, Victoria, Australia), and supplied under a user agreement with an AFL team. The transactional data captures information relating to all on-ball match events that occur within an AFL match, such as event type, players involved, time and location (x, y location) of the event. Each season has 198 home and away matches and nine finals matches ( = 207). A total of 1449 matches played between the 2013 and 2019 seasons were analysed in this study.
2.2. Individual and team performance indicators
The data that quantified an individual player’s PIs can be represented with the following notation:
where performance indicator ; match id
; team name
; player id
.
Here , and all performance indicators are listed in .
Table 1. Breakdown of performance indicators relating to each aspect of playing style (offensive, transitional, and scoring).
Team summary statistics () were used for the analysis and classification of the team playing styles and computed as follows:
where number of players
representing team
and match
.
The (Equation 2) data set was standardised by rescaling each variable to have a mean of zero and standard deviation equal to one. Based on previous association football (Diquigiovanni & Scarpa, Citation2019) and Australian football literature (Taylor et al., Citation2020), the data was then separated into three data sets reflecting each aspect of playing style: (1) offensive variables; (2) transitional variables and (3) scoring variables. The technical PIs (see Jackson (Citation2016) and Robertson, Gupta, et al. (Citation2016) for PI definitions) used in the analysis were chosen in consultation with AFL coaches and performance staff. PIs that directly represented scoring (e.g. goals, behinds, and score assists) were omitted from the analyses as these are considered a result of performance (Robertson, Back, et al., Citation2016). The offensive-related PI variables were labelled for
. Transitional PI variables were labelled by
. Scoring PI variables were labelled by
().
2.3. Software for analysis
All data analysis was done using R (R Core Team, Citation2020). The exploration and data wrangling was completed using tidyverse (Wickham et al., Citation2019) and dplyr (Wickham et al., Citation2021) packages. factoextra (Kassambara & Mundt, Citation2020) was used to implement the three k-assessment measures, and the stats (R Core Team, Citation2020) package was used to implement the k-means algorithm. Tidymodels (Kuhn & Wickham, Citation2020) was used in conjunction with kknn (Schliep & Hechenbichler, Citation2016), ranger (Wright & Ziegler, Citation2017) and xgboost (Chen et al., Citation2021) to implement the supervised learning algorithms on the data with olsrr (Hebbali, Citation2020) used for linear modelling.
2.4. Cluster analysis
The elbow method (Bholowalia & Kumar, Citation2014; Hastie et al., Citation2017; Kodinariya & Makwana, Citation2013) was used to identify the optimal number of clusters for each data set and was agreed upon by coaching and performance staff (subject matter experts).
were then specified as a parameter in the k-means models (
) to produce k-distinct styles (
) for each aspect of playing style.
where .
The components of playing style (,
and
) were combined to create a global playing style for each team
).
Using (EquationEquation 3
(3)
(3) ), the standardised cluster means were used to describe the characteristics of each cluster. A cluster PI was defined as outside the competition average if it was greater or lesser than one standard deviation of the dataset means. Therefore, when the PI cluster means is above a standardised score of 0.5, the cluster performs above the competition average and below the competition when the cluster mean is below a standardised score of −0.5.
The team summary statistics were appended with the labels corresponding to the playing styles identified for each phase of play:
Finally, models were created using Random Forest . The data was split into training and validation sets using a ratio of 80:20. The F1-score was used as a metric to assess the accuracy of the models. Using
, variables that significantly impact distinguishing between each playing style were identified.
2.5. Linear modelling
A linear model was created using the playing style clusters identified to explain the winning match margin in AFL matches. The playing style of the winning team, the playing style of the losing team, and the difference between match PIs were calculated between the winning and losing teams for each match. Calculating the differences between the winning and losing teams best describes the contextual nature of AF and is an example of a “descriptive conversion” (Robertson, Back, et al., Citation2016).
The linear model was created using stepwise regression with criteria (p-value <0.1 added to the model, p-value >0.3 removed from the model) to select the best model.
where is winning match margin (scoring of winning team - score of losing team);
are PIs realting to match statisitics () and
is the playing style implemented by the winning and losing teams ().
Table 2. Combination of offensive, transitional, and scoring playing styles resulting in 12 overall playing styles.
The model was rerun, excluding the and
one at a time to investigate the performance of the simpler models. R-squared (R2) and adjusted R2 were calculated using the training dataset, and the Root Mean Square Error (RMSE) was calculated using the validation dataset to compare models and identify which optimal model best explained the winning margin while minimising error.
3. Results
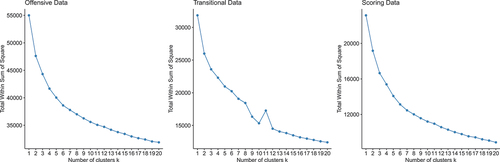
was selected using the k-assessment elbow method displayed in for the offensive, transitional, and scoring data. The selected
were then validated by coaching and performance staff (subject matter experts), resulting in
,
and
. After refitting
, the predefined k-value
, the data were clustered into offensive styles (
), transitional styles (
), scoring styles (
).
Figure 2. Graphical output from the elbow method data to identify an optimal k-number of clusters for each data set .
3.1. Offensive playing styles
Contested offensive (): This cluster had above-average clanger kicks, contested possessions, effective ground kicks, ineffective kicks, kick-to-handball ratio, long kicks, and throw-in clearances. This cluster also had a below-average number of effective handballs, marks inside 50 m, short kicks, uncontested marks, and uncontested possessions ().
Figure 3. Standardised means of the performance indicators representing playing styles clusters, with bars showing one standard deviation of the mean. Standardised means above 0.5 are green, between 0.5 and − 0.5 are black and below − 0.5 are red.
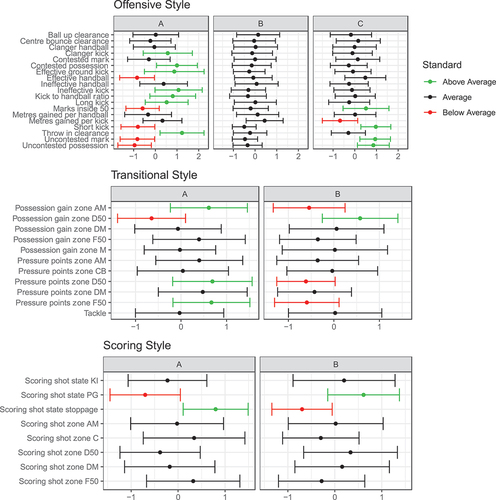
Non-distinct offensive ( This cluster has mean scores of all PIs within one standard deviation of the sample means ().
Uncontested offensive (This cluster had an above-average number of short kicks, uncontested possessions, uncontested marks, and marks inside 50 m ().
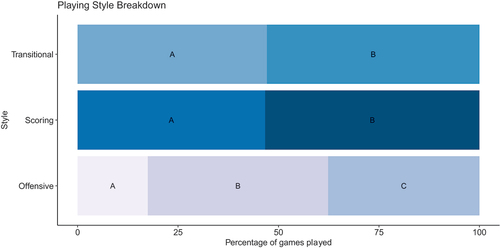
The three offensive playing styles included short kicks, uncontested marks, and uncontested possessions as the three most important variables for offensive styles (). Across the seven seasons, offensively, teams were characterised by the non-distinct offensive style (
uncontested style of play (
) during 37.67% of games and the contested style (
during 17.47% of games ().
Figure 4. Variable importance plots produced by the random forest models for each aspect of overall playing style, identifying the top 15 variables used to separate each style cluster.
Figure 5. Percentage breakdown of the styles played within each phase of play.
3.2. Transitional playing styles
Forward-half pressure (): This cluster had an above-average percentage of possession gains in the attacking midfield, percentage of pressure points obtained in the defensive 50 and percentage of pressure points obtained in the forward 50. These teams also had a below-average percentage of possession gains in the defensive 50 ().
Defensive-half intercept (This cluster had an above average percentage of possession gains obtained in the defensive 50. These teams also had a below-average percentage of possession gains obtained in the attacking midfield, percentage of pressure points obtained in the defensive 50 and percentage of pressure points in the forward 50. ().
Pressure points obtained in the defensive 50, pressure points obtained in the forward 50 and possession gains in the defensive 50 were the three most important variables that described this playing style (). Both the transitional styles occurred more evenly, with the defensive-half intercept style () implemented during 52.88% of games and the forward-half pressure style (
performed during 47.11% of games ().
Scoring playing styles
Stoppage scoring (): This cluster had an above-average percentage of scoring shots initiating from stoppages and a below-average scoring shot percentage initiating from a possession gain ().
Possession gain scoring (): This cluster had an above-average percentage of scoring shots initiated from possession gains and a below-average scoring shot percentage initiated from a stoppage ().
When distinguishing between scoring styles, the three most important variables were scoring shots initiated from possession gains, scoring shots initiated in the defensive 50 and shots initiated from throw-ins (). The possession gain scoring style () was played during 53.33% of games and the stoppage scoring style (
) 46.67% of the games ().
and illustrate each playing style’s occurrence and win percentage and show the distribution of match margins. The most common team playing style (14.86%) was the non-distinct offensive playing style combined with the defensive-half transitional style and possession gain scoring style. The second most played style (12.64%) was a combination of the uncontested offensive playing style, forward-half pressure defence and possession gain scoring style. This style, along with the uncontested offensive playing style, forward-half pressure defence and stoppage-dominant scoring style, had the highest average match margin () and the largest win percentage when implemented by teams with a win rate of over 80% ().
Figure 6. Boxplots representing the spread of match margins for team playing style [offensive, transitional, scoring].
![Figure 6. Boxplots representing the spread of match margins for team playing style [offensive, transitional, scoring].](/cms/asset/49b204c7-c4ea-4e22-abab-efcddbe5c0d5/rpan_a_2325269_f0006_b.gif)
Table 3. Model table for linear model1. Beta is the beta coefficient, and CI is the 95% confidence interval of the beta parameters.
3.3. Linear modelling
The linear model that best fitted the data included performance indicators and matchup of team playing styles (RMSE = 14.68, r-squared = 0.72, adjusted r-squared = 0.68). The poorest performing model contained only the playing style variables of each team producing an RMSE of 23.68, an R2 value of 0.19 and an adjusted R2 of 0.18. The model containing only performance indicators explained the data better than the playing style model (RMSE = 14.95, r-squared = 0.68, adjusted r-squared = 0.67).
4. Discussion
This study identified and characterised playing styles in the AFL and the effect of these styles on predicting the final score margin for each match. The playing styles identified built upon previous AF literature by defining the characteristics of “styles of play”. The output of this study can provide a framework for coaches and performance staff to assist with team and opposition analysis.
Uncontested offensive style teams () implement an offensive style of play that uses short kicks to teammates who were free to mark the ball. Uncontested offensive style teams moved the ball to the attacking 50-metre zone using deliberate tactics to maintain possession. An uncontested offensive style in AF resembles a possession style in association football (Lago-Peñas et al., Citation2017). In both types of football, the possession style can be characterised by slower and more deliberate play that minimises the risk of losing possession. Contested offensive style teams (
) are looking to win possession and then “surge” the ball forward to maximise field position as a priority. The contested offensive style of play can be compared to the direct style identified by Fernandez-Navarro et al. (Citation2016) in association football. These styles aim to win the ball and gain territory as a priority. The increased contested possession count could reflect team strategies by allocating extra players around stoppages, increasing the likelihood of gaining contested ball possession to generate a clearance (Alexander et al., Citation2021). The importance of territory gain is reflected by the above-average kick-to-handball ratio and fewer short kicks, taking more risks, given their inflated number of long, clanger, ineffective and ground kicks. This could also be influenced by the strategy explained by Alexander et al. (Citation2021) to outnumber the opposition at the stoppage, which results in having a numerical disadvantage in their attacking half, making it more difficult to maintain possession as they gain territory. Teams classified as
style had no marked preference for contested or uncontested styles in offensive play. The non-distinct offensive style may result from teams playing both contested and uncontested styles intermittently throughout a match or a poor performance resulting in the inability to implement their distinct style. Further investigation into how teams can successfully implement team playing styles may identify why teams cannot have a distinct style of play.
The transitional styles reflect how a team organises themselves spatially when defending (Diquigiovanni & Scarpa, Citation2019). Teams typically arrange their defence to apply pressure to their opponent in particular areas of the ground to force turnovers and regain possession. Defensive-half intercept teams ( are characterised by a high number of possession gains in the defensive 50 with low defensive 50 and forward 50 pressure points. Defensive-half intercept teams reflect association football counterattack teams which resemble a structured defensive set-up for intercept possession situations rather than applying high tackling pressure in the back and forward-half (Lago-Peñas et al., Citation2017). Woods et al. (Citation2017) explained that the application of defensive tactics, specifically a zone defence, forces teams to kick towards areas of the field dictated by the defensive team. The dictation of ball movement allows for the defensive team with an extra number to intercept the ball and regain possession (Alexander et al., Citation2019). Forward-half pressure teams (
) have a majority of possession gains in the attacking midfield, have low possession gains in the defensive 50 and obtain high-pressure points in both the forward and defensive 50. Forward-half pressure teams are related to the re-possession style identified by Woods et al. (Citation2017) and free ball and turnover styles identified by Lago-Peñas et al. (Citation2017) in association football. Outnumbering the opposition defence and rapid defensive re-organisation is key to regaining possession, keeping the ball in their forward-half for as long as possible and increasing their chance of scoring.
The identification of scoring, the third component of game style, builds upon AF literature, which identified two styles of play: offensive and defensive (Greenham et al., Citation2017; Lane et al., Citation2020; Spencer et al., Citation2016). The scoring styles represent the areas of the ground and starting state of possession chains that led to shots at goal. Possession gain scoring () shots at goal predominantly originate from possession gains, where stoppage scoring teams (
) shots at goal predominantly originate from stoppages. Stoppage scoring teams may dominate period of play around stoppages leading to a significant percentage of scoring chains stemming from these sources. In contrast, the scoring chain for possession gain scoring teams stem from turnovers in general play. Possession gain scoring teams may force opposition turnovers in attacking positions allowing for an increased opportunity for a shot at goal to occur or can maintain possession effectively by moving the ball into attacking areas. Identifying scoring styles increases the objective knowledge available to coaches during team analysis.
While the linear models themselves have moderate goodness of fit measures, the model including the playing styles of both teams within a match combined with PIs showed an improved performance compared to the simpler models containing only PIs and playing style variables. The linear modelling () builds upon the research conducted by Spencer et al. (Citation2016) and Sheehan et al. (Citation2023), highlighting that not all PIs hold the same level of importance when predicting match margin when including the match-up of playing styles. This study adds to the current literature identifying that the varying importance of match PIs reflects the implementation of team strategies and tactics to optimise players’ performance within a team. The inclusion of other aspects of performance, such as physical performance captured through global navigation satellite system data and other tactical aspects captured through network and spatiotemporal data explored in Sheehan et al. (Citation2023) could further improve model performance. Coaches can then use this information to inform training and match day decisions based on team or opposition performances, focusing on the successful performance of critical PIs relevant to the playing style. This alludes to the idea of effective player actions and how they influence the team playing style and, ultimately, the result of the match.
Table 4. Percentage breakdown of the number of games played and the win percentage associated with each overall team playing style [offensive, transitional, scoring].
To assist with training design, team analysis and opposition analysis, coaching and performance staff may use the processes presented to identify the optimal combination of playing styles for their specific team. They may use objective analysis to identify strengths and weaknesses in each phase of opposition gameplay. Classifying playing styles enables coaches and players to identify and implement relevant changes regarding each game phase, leading to a greater chance of a successful match outcome (Lago-Peñas et al., Citation2017). Real-time classification of team playing styles can be used in a game to assess whether team strategies are being implemented as planned and whether adaptations need to be made based on real-time events. Other aspects of performance, including spatiotemporal data and passing networks, could be used in conjunction with transactional match PIs to inform playing styles by utilising the collective behaviour of teams. Performance could also be broken into smaller periods of play within matches, providing an understanding of how teams interact throughout a match, providing more context than transactional data.
5. Conclusion
The improvement in the prediction of winning match margin with the addition of a matchup of playing styles compared to the generic match statistic model highlights that team playing styles play an important role in the outcome of matches. Three offensive styles, two transitional and two scoring styles were identified and defined to create 12 overall playing styles that AFL teams implement. Coaches can use this information for team and opposition analysis of team playing style. The breakdown of play allows for the specific identification of strengths and weaknesses of each aspect of a match. Teams can adopt tactics and strategies in each aspect of their game to maximise their performance, as these changes can be broken down to be clear and relevant regarding each game phase. These playing styles built off performance indicators from events performed within matches provide a useful tool of analysis; however, other aspects of performance, such as passing networks and spatiotemporal metrics, all contribute to the outcome of performance. Including all of these elements will assist in providing a more holistic analysis of performance.
Acknowledgements
The authors thank Harry Garland, Fremantle Football Club for sharing his expert football knowledge and guidance throughout this study. We would also like to thank Professor Sam Robertson, Victoria University, for the useful discussion on the framework and methodology presented in this study and Dr Suman Rakshit for his comments that greatly improved the manuscript.
Disclosure statement
No potential conflict of interest was reported by the author(s).
References
- Alexander, J. P., Bedin, T., Jackson, K. B., Robertson, S., & Daniels, B. C. (2021). Team numerical advantage in Australian rules football: A missing piece of the scoring puzzle? Public Library of Science ONE, 16(7), e0254591. https://doi.org/10.1371/journal.pone.0254591
- Alexander, J. P., Spencer, B., Sweeting, A. J., Mara, J. K., & Robertson, S. (2019). The influence of match phase and field position on collective team behaviour in Australian rules football. Journal of Sports Sciences, 37(15), 1699–1707. https://doi.org/10.1080/02640414.2019.1586077
- Bholowalia, P., & Kumar, A. (2014). EBK-means: A clustering technique based on elbow method and k-means in WSN. International Journal of Computer Applications, 105(9), 17–24.
- Chen, T., He, T., Benesty, M., Khotilovich, V., Tang, Y., & Cho, H. (2021). Xgboost: Extreme Gradient Boosting. In https://CRAN.R-project.org/package=xgboost
- Diquigiovanni, J., & Scarpa, B. (2019). Analysis of association football playing styles: An innovative method to cluster networks. Statistical Modelling, 19(1), 28–54. https://doi.org/10.1177/1471082X18808628
- Fernandez-Navarro, J., Fradua, L., Zubillaga, A., Ford, P. R., & McRobert, A. P. (2016). Attacking and defensive styles of play in soccer: Analysis of Spanish and English elite teams. Journal of Sports Sciences, 34(24), 2195–2204. https://doi.org/10.1080/02640414.2016.1169309
- Fransen, J., Tribolet, R., Sheehan, W. B., McBride, I., Novak, A. R., & Watsford, M. L. (2022). Cooperative passing network features are associated with successful match outcomes in the Australian football league. International Journal of Sports Science & Coaching, 17(5), 1101–1108. https://doi.org/10.1177/17479541211052760
- Gray, A. J., & Jenkins, D. G. (2010). Match analysis and the physiological demands of Australian football. Sports Medicine, 40(4), 347–360. https://doi.org/10.2165/11531400-000000000-00000
- Greenham, G., Hewitt, A., & Norton, K. (2017). A pilot study to measure game style within Australian football. International Journal of Performance Analysis in Sport, 17(4), 576–585. https://doi.org/10.1080/24748668.2017.1372163
- Gréhaigne, J.-F., & Godbout, P. (1995). Tactical knowledge in team sports from a constructivist and cognitivist perspective. Quest, 47(4), 490–505. https://doi.org/10.1080/00336297.1995.10484171
- Gréhaigne, J.-F., Griffin, L. L., & Richard, J.-F. (2005). Teaching and learning team sports and games. Psychology Press.
- Hastie, T., Tibshirani, R., & Friedman, J. (2017). The elements of statistical learning (Second Edition ed.). Springer.
- Hebbali, A. (2020). Olsrr: Tools for Building OLS Regression Models. In https://CRAN.R-project.org/package=olsrr
- Jackson, K. (2016). Assessing Player Performance in Australian Football Using Spatial Data [ Thesis (PhD)]. Swinburne University of Technology.
- Josman, C., Gupta, R., & Robertson, S. (2020). Markov chain models for the near real-time forecasting of Australian Football League match outcomes. In A. K. Nagar, K. Deep, J. C. Bansal, & K. N. Das (Eds.), Soft computing for problem solving 2019 (Vol. 1139, pp. 111–125). Springer Singapore. h ttp://link.springer.com/10.1007/978-981-15-3287-0_9
- Kassambara, A., & Mundt, F. (2020). Factoextra: Extract and Visualize the Results of Multivariate Data Analyses. In https://CRAN.R-project.org/package=factoextra
- Kodinariya, T. M., & Makwana, P. R. (2013). Review on determining number of cluster in K-Means clustering. International Journal, 1(6), 90–95.
- Kuhn, M., & Wickham, H. (2020). Tidymodels: A Collection of Packages for Modeling and Machine Learning Using Tidyverse Principles. In https://www.tidymodels.org
- Lago-Peñas, C., Gómez-Ruano, M., & Yang, G. (2017). Styles of play in professional soccer: An approach of the Chinese soccer super league. International Journal of Performance Analysis in Sport, 17(6), 1073–1084. https://doi.org/10.1080/24748668.2018.1431857
- Lane, J. C., van der Ploeg, G., Greenham, G., & Norton, K. (2020). Characterisation of offensive and defensive game play trends in the Australian football league (1999–2019). International Journal of Performance Analysis in Sport, 20(4), 557–568. https://doi.org/10.1080/24748668.2020.1758438
- McIntosh, S., Kovalchik, S., & Robertson, S. (2018). Examination of player role in the Australian football league using match performance data. International Journal of Performance Analysis in Sport, 18(3), 451–462. https://doi.org/10.1080/24748668.2018.1486116
- R Core Team. (2020). R: A Language and Environment for Statistical Computing. In https://www.R-project.org/
- Robertson, S., Back, N., & Bartlett, J. D. (2016). Explaining match outcome in elite Australian Rules football using team performance indicators. Journal of Sports Sciences, 34(7), 637–644. https://doi.org/10.1080/02640414.2015.1066026
- Robertson, S., Gupta, R., & McIntosh, S. (2016). A method to assess the influence of individual player performance distribution on match outcome in team sports. Journal of Sports Sciences, 34(19), 1893–1900. https://doi.org/10.1080/02640414.2016.1142106
- Schliep, K., & Hechenbichler, K. (2016). Kknn: Weighted K-Nearest Neighbors. In https://CRAN.R-project.org/package=kknn
- Sheehan, W. B., Tribolet, R., Novak, A. R., Fransen, J., & Watsford, M. L. (2023). A holistic analysis of collective behaviour and team performance in Australian football via structural equation modelling. Science and Medicine in Football, 7(1), 64–73. https://doi.org/10.1080/24733938.2022.2046286
- Sheehan, W. B., Tribolet, R., Watsford, M. L., Novak, A. R., Rennie, M., & Fransen, J. (2020). Improving the interpretation of skill indicators in professional Australian football. Journal of Science and Medicine in Sport, 23(9), 872–878. https://doi.org/10.1016/j.jsams.2020.01.016
- Sheehan, W. B., Tribolet, R., Watsford, M. L., Novak, A. R., Rennie, M., & Fransen, J. (2022). Tactical analysis of individual and team behaviour in professional Australian football: Original investigation. Science and Medicine in Football, 6(2), 172–180. https://doi.org/10.1080/24733938.2021.1923792
- Sheehan, W. B., Tribolet, R., Watsford, M. L., Novak, A. R., Rennie, M. J., & Fransen, J. (2020). Using cooperative networks to analyse behaviour in professional Australian football. Journal of Science and Medicine in Sport, 23(3), 291–296. https://doi.org/10.1016/j.jsams.2019.09.012
- Spencer, B., Morgan, S., Zeleznikow, J., & Robertson, S. (2016). Clustering team profiles in the Australian football league using performance indicators, The 13th Australasian Conference on Mathematics and Computers in Sport, Melbourne, Australia, 11 July 2016-13 July 2016. https://www.researchgate.net/publication/303786094.
- Taylor, N., Gastin, P. B., Mills, O., & Tran, J. (2020). Network analysis of kick-in possession chains in elite Australian football. Journal of Sports Sciences, 38(9), 1053–1061. https://doi.org/10.1080/02640414.2020.1740490
- Wedding, C., Woods, C., Sinclair, W. H., Gomez, M. A., & Leicht, A. S. (2021). Analysis of styles of play according to season and end of season rank in the National Rugby League. Journal of Science and Medicine in Sport, 24(2), 206–210. https://doi.org/10.1016/j.jsams.2020.09.006
- Wedding, C., Woods, C., Sinclair, W., Gomez, M., & Leicht, A. (2021). Exploring the effect of various match factors on team playing styles in the National rugby league. International Journal of Sports Science & Coaching, 16(4), 976–984. https://doi.org/10.1177/1747954121997238
- Wickham, H., Averick, M., Bryan, J., Chang, W., McGowan, L., François, R., Grolemund, G., Hayes, A., Henry, L., Hester, J., Kuhn, M., Pedersen, T., Miller, E., Bache, S., Müller, K., Ooms, J., Robinson, D., Seidel, D. … Woo, K. (2019). Welcome to the tidyverse. Journal of Open Source Software, 4(43), 1686. In (Version 4. https://doi.org/10.21105/joss.01686
- Wickham, H., François, R., Henry, L., & Müller, K. (2021). Dplyr: A Grammar of Data Manipulation. In https://CRAN.R-project.org/package=dplyr
- Woods, C., Raynor, A. J., Bruce, L., McDonald, Z., & Collier, N. (2015). Predicting playing status in junior Australian football using physical and anthropometric parameters. Journal of Science and Medicine in Sport, 18(2), 225–229. https://doi.org/10.1016/j.jsams.2014.02.006
- Woods, C., Robertson, S., & Collier, N. F. (2017). Evolution of game-play in the Australian football league from 2001 to 2015. Journal of Sports Sciences, 35(19), 1879–1887. https://doi.org/10.1080/02640414.2016.1240879
- Wright, C., Atkins, S., Jones, B, & Todd, J. (2013). The role of performance analysts within the coaching process: Performance Analysts Survey ‘The role of performance analysts in elite football club settings’. International Journal of Performance Analysis in Sport, 13(1), 240–261. https://doi.org/10.1080/24748668.2013.11868645
- Wright, M. N., & Ziegler, A. (2017). Ranger: A fast implementation of random forests for high dimensional data in C++ and R. Journal of Statistical Software, 77(1). https://doi.org/10.18637/jss.v077.i01
- Young, C. M., Luo, W., Gastin, P., Lai, J., & Dwyer, D. B. (2019). Understanding effective tactics in Australian football using network analysis. International Journal of Performance Analysis in Sport, 19(3), 331–341. https://doi.org/10.1080/24748668.2019.1605562
- Young, C. M., Luo, W., Gastin, P., Tran, J., & Dwyer, D. B. (2019). The relationship between match performance indicators and outcome in Australian football. Journal of Science and Medicine in Sport, 22(4), 467–471. https://doi.org/10.1016/j.jsams.2018.09.235