
ABSTRACT
An understanding of the effect contextual data may have on key match-play technical performance indicators in the Australian Football League Women’s (AFLW) competition is warranted due to its rapid evolution. To address this, predictive models were fit to determine which technical match-play data, including new contextual information, more accurately predict AFLW match outcomes (win/loss, margin), and what are the most important contexts and technical predictors of team performance? Thirteen random forest models were fit, each with greater data contextual interaction including relative to opposition and harder-to-attain match-play variables, field location, and individual player contributions. Models were assessed by prediction performance on match outcome in a holdout sample and variable importance through Mean Decrease in Gini Index. Effective kicks and entries into attacking locations were important in models. Territory gained, contexts of relative performance to the opposition, and locational information around actions improved prediction. This methodology represents the most in-depth analysis of women’s Australian football technical match-play performance to date. Commentary presented surrounded issues of using aggregated datasets, prediction with match-play success as a dependent variable, and that detailed, process-oriented approaches are needed in future to avoid large assumptions.
1. Introduction
The women’s Australian football (AF) elite competition, the Australian Football League Women’s (AFLW), was established in 2017. Performance analysis techniques play a key role in establishing industry practices to support the competition. Specifically, performance analysis involving technical and tactical variables capturing player and team skill actions during match-play and training can inform coaching, player recruitment and development, and gameday tactics (Lord et al., Citation2020) as it has in prior men’s AF (Young, Luo, Gastin, Tran, et al., Citation2019) and soccer research (Moreira Praça et al., Citation2023).
Previous studies have analysed technical and tactical performance in women’s AF (Black et al., Citation2019; Cust et al., Citation2019; Dwyer et al., Citation2022). Key variables in match-play success included Kicks, Uncontested Possessions, and Disposal Efficiency (Black et al., Citation2019), Relative Inside 50s between teams, and by key players (Cust et al., Citation2019), and Inside 50s, Disposals, Marks Inside 50, and Contested Possessions (Dwyer et al., Citation2022). These datasets included 13 variables (Black et al., Citation2019) and 23 variables (Dwyer et al., Citation2022) while Cust et al. (Citation2019) had 12 base variables with feature distributions applied providing a representation of individual player contribution to each variable. Additionally, field location of technical match-play performance actions in the AFLW has been shown to impact key performance indicators characteristic of positional roles (van der Vegt et al., Citation2023a).
Previous studies (Black et al., Citation2019; Cust et al., Citation2019; Dwyer et al., Citation2022) utilised data from the first three seasons of the AFLW. As it has been demonstrated that the AFLW is a fast-developing competition (van der Vegt et al., Citation2023b), this may indicate that reassessment with more recent seasons has the potential to produce results more representative of the current competition. Analysis incorporating additional data that has become available since these studies have been published, both in number of variables and contextual information, may build on the results of the current AFLW literature.
Precedent of detailed analysis of wider technical indicators (91 variables after variable reduction) has been conducted in the men’s elite competition, the Australian Football League (AFL), across the 2001–2016 seasons, separated into eras for each model fit (Young, Luo, Gastin, Tran, et al., Citation2019). Key performance indicators produced provided insight into the value of specific data and its effect on prediction accuracy of team match-play success. Contextual information including team technical variables relative to the opposition demonstrated greater prediction accuracy to match outcome than the standard version, with key variables of interest including relative kicks and metres gained, and inside 50-metre entries (Young, Luo, Gastin, Tran, et al., Citation2019).
These AFL results indicate that the inclusion of additional variables with greater detail and contextual information surrounding each variable (e.g. relative between teams, metres gained on the field through actions by a team, etc.) has the potential to provide greater information of the scenarios in which key indicators influence AFLW match-play success (van der Vegt et al., Citation2023b). This is further evidenced by the influence of individual player contributions in the AFLW (Cust et al., Citation2019), meaning the integration of this context may improve prediction accuracy and insights. As a result, investigating how a range of contextual aspects that may be influential (e.g. locational information of actions (van der Vegt et al., Citation2023a) or metres gained (Young, Luo, Gastin, Tran, et al., Citation2019)) may have the potential to show the value of current performance data captured.
Pertinent issues affecting the ability for performance analysis to be conducted and interpreted, have been identified in previous literature regarding both women’s sport (Emmonds et al., Citation2019) and specifically women’s AF (van der Vegt et al., Citation2023b). The comparatively scarce resources in women’s competitions relative to their men’s equivalent, in terms of facilities, funding, less staff taking on more duties, and comparative contact hours for players under a semi-professional environment, may constrain conducting performance analysis. As such, understanding the value of data currently captured in the AFLW competition, better utilising available data, inclusive of a wider range of technical match-play performance variables and their contextual information, is warranted (van der Vegt et al., Citation2023b). Potential findings regarding prediction accuracy on match outcomes utilising various levels of detailed data may assist sport practitioners and club personnel regarding decision-making concerning priority of data usage given available resources, training practices, and strategy implementation.
Therefore, a gap exists regarding usage of existing wider range of variables and contexts to inform technical performance, which can in turn also produce a current representative analysis of match-play actions that contribute most to match outcomes within women’s AF, allowing for comparison to and potential reinforcement of previous literature. Utilising more seasons of data with additional detail also enables the use of more intensive predictive machine learning models that have the potential to capture further relationships between technical and tactical variables, which may inform key performance indicators that can be used to assist coaching and match analysis (van der Vegt et al., Citation2023b).
Considering the motivations of building on the current understanding of key AFLW match-play technical variables with the additional contexts available and potential shifts in more recent seasons in a fast-developing league, while accounting for the needs of women’s AF of quick, interpretable, and reproducible results, the following study design has been created. This study aims to utilise existing technical match-play datasets while introducing new contextual information to understand how well they predict AFLW match outcomes (win/loss and margin), and to identify which variables and contexts are most important to prediction with consideration of reproducibility and interpretability.
2. Methods
2.1. Data
Data used in this analysis were derived from Champion Data across all AFLW matches from 2017 to the first of two seasons of 2022 (referred to as 2022.1). The data has been validated within men’s AF research (Robertson et al., Citation2016), with similar collection processes in the AFLW, although no validation has been conducted. Quarterly data was chosen to be consistent with past analyses (Black et al., Citation2019; Cust et al., Citation2019), for easier comparison and greater sample size at the expense of increasingly sparse data. The study was approved by the Bond University Human Research Ethics Committee (BV00011).
explains the detail of each data type used and whether a precedent exists for its use in current women’s AF literature. presents the different levels of data used in the analysis. Each model utilises incrementally more detailed data or interactions with different detail levels. Models are produced in model sets (e.g. Model 1.1, 1.2 is a set) with different iterations representing different detail combinations.
Table 1. Description of data detail available and use in previous women’s Australian football literature.
Table 2. Combinations of data used to fit models to predict Australian Football League Women’s (AFLW) match outcomes.
Previous literature removed the less predictive variable of any pair with correlation above 0.95 to avoid multicollinearity issues (Young, Luo, Gastin, Tran, et al., Citation2019). However, we take a different approach for two reasons. First, the random forest process applied is largely immune to multicollinearity issues in addition to it being performed with greater rigour surrounding sampling, number of iterations, and cross-validation usage (Hastie et al., Citation2009). Secondly, the technique considers complex non-linear interactive relationships, so exclusion based on linear correlation could remove important variables, reducing model performance (Hastie et al., Citation2009).
A standard 80:20 split stratified by each season (2017–2022.1–6 seasons) for train:test data was used for modelling and final verification of model performance (Chollet, Citation2017). This stratification ensured an equal representation of all seasons’ data were included in the training and test sets. Splitting by year rather than stratifying can lead to lower accuracy on the test set as it becomes a future prediction of match result problem based on past data rather than in line with the aim of this analysis to understand important variables through quality models varying in data detail (Chollet, Citation2017). This stratification choice is further substantiated as due to previous temporal differences in variables noted in the AFLW (Dwyer et al., Citation2022), a break in the dataset was tested temporally through bootstrapped decision trees (Aminikhanghahi & Cook, Citation2017) where no large enough differences were found to justify an era split.
Quarters that ended in a draw were removed from the dataset due to the small sample size for a classification problem and specificity needed for a regression prediction. Variables that are functions of scoring or match result were removed in all datasets, due to the bias introduced by utilising these variables in prediction (Cust et al., Citation2019).
2.2. Model fit and selection
Each dataset had a random forest model applied for testing following the precedent of Young, Luo, Gastin, Tran, et al. (Citation2019) in men’s AF literature utilising R computing software (R Core Team, Citation2018). A random forest method was selected for several reasons. An initial decision of employing random forests over advanced regression models and decision trees was made due to the ability to tune parameters, particularly through iterating the sampling size of the model, perform feature selection, and capture highly non-linear relationships for a more representative model enabling conditional two or more variable relationships (Chollet, Citation2017; James et al., Citation2013). More interpretable and ease of producing results were a key influence to the selection of the random forest rather than more intensive machine learning models like neural networks (Chollet, Citation2017). Using random forests are less computational and decision intensive relative to designing neural network architecture. Neural network variable interpretation is difficult considering the need for additional methods such as DeepSHAP (Lundberg & Lee, Citation2017), which requires interpretation of variable importance per each sample under the assumption of variable independence. In addition, given the specificity of relationships that would arise on a dataset such as ours that is not as large as optimal for neural networks, a greater danger of overfitting models would be present when fitting neural networks of multiple layers (Chollet, Citation2017). Random forests maintain a degree of the interacting variable structure to still allow for more conditional relationships to arise. Random forests ordinal and nonparametric structure, means that outliers do not skew results and conformity to a specific distribution is not required (Chollet, Citation2017).
Given the large number of variables relative to the number of data points in most cases, five-fold cross-validation was performed when fitting models, stratified by season within the training set (Hastie et al., Citation2009). Each model was also fit multiple times sampling different variable amounts, with the results analysed to select the ideal sample size to avoid overfit and ensure dimensionality problems within the datasets were addressed (Chollet, Citation2017). The best sampling size iteration was utilised to fit the final model used for prediction on all available training data.
2.3. Model evaluation and variable importance
Comparison of modelling performance between each dataset was measured using one of two metrics: Mean Absolute Error (MAE) (Black et al., Citation2019; Cust et al., Citation2019) for numeric margin prediction and percentage accuracy for win-loss classification. Both are necessary as scenarios can arise where prediction may be close by MAE but wrong in classification, such as an incorrect prediction of a 1-point win for team A, when team B won by 1-point. The scale of the MAE is important as it can be interpreted as an exact error by the number of points scored, with the context of six points for a goal, and one point for a behind (missed shot that still scores) showing the scale of error relative to the number of scoring actions.
Variable importance was determined via the Mean Decrease in Gini Index (MDGI) for every final model; this is common when applying random forests while Mean Decrease in Accuracy assessment provided similar results (Breiman, Citation2001). Assessment of variable importance from random forests models has the benefit of being able to handle correlated variables without suffering from multicollinearity issues (Chollet, Citation2017).
As a result, themes can be extracted on key variable groups with similar traits that are important to models, which can then be utilised as key performance indicators by practitioners and coaches. MDGI does not indicate relationship direction, meaning that correlation directions to the dependent variable (quarter margin) were analysed to determine the direction of the relationship of important variables in each model’s dataset. This comes with the caveat that caution should be taken in directional interpretation as the non-linear relationship is likely not simplistic given the interacting nature of variable importance in random forests (Chollet, Citation2017).
3. Results
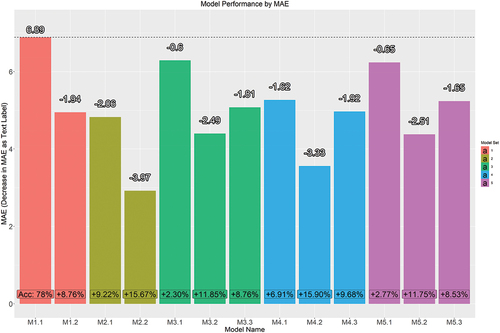
A total of 2280 data points (285 matches × 2 teams × 4 quarters per match) were available for use with 52 (26 × 2) drawn quarters removed from the dataset. This resulted in a final dataset of 2228 data points. presents the MAE and accuracy results of each model from above. Further detail in table form can be found in supplementary material .
Figure 1. Model performance to determine which technical match-play data best predicts Australian Football League Women’s competition match outcomes in terms of difference in mean absolute error and prediction accuracy relative to the baseline Model 1.1.
and display the 20 most important variables by MDGI for each model along with whether they are positively or negatively correlated with the dependent variable (quarter margin).
Table 3. Twenty most important variables for each model fit to predict quarter margins in the Australian Football League Women’s competition and accompanying variable importance score.
Table 4. Twenty most important variables for each model fit to predict quarter margins in the Australian Football League Women’s competition and accompanying variable importance score.
In Model 1.1 (M1.1), Inside 50 (I50) was the most important variable by MDGI. Effective and Total Kicks, and Clearances were also strongly positively associated with success, while Turnovers (TO) and Rebound 50s (R50s) were negatively associated. Model 1.2 (M1.2) revealed similar important variables except in relative form, producing better prediction than M1.1 by MAE and accuracy.
Model 2.1 (M2.1) indicated the Chain Metres variable was responsible for a large portion of predictive power, while Repeat I50s also was a strong indicator. The relative form of similar statistics were again stronger indicators in Model 2.2 (M2.2), with Chain Metres and Metres Gained (MG) constituting most of the predictive power. M2.1 and M2.2 both improve on M1.1 and M1.2 predictions with the relative version performing particularly well.
Model 3.1 (M3.1) was dominated by efficiency inside the F50 statistics and I50s, indicating the importance of field position with the strongest negative association coming through Free Kicks conceded in defence. Model 3.2 (M3.2) shows many of the same statistics as M3.1 in relative form, although with a large amount of predictive power attributable to Effective Kicks inside F50. When removing F50 variables, I50s and less R50s once again dominated prediction. All of Model set 3 improved on Model set 1 although the removal of F50 location in Model 3.3 (M3.3) reduced accuracy.
The re-addition of MG statistics in Model 4.1 (M4.1), as seen in , found many of these variables included, with MG Retained and Effective Kicks in the F50 the two most important variables. Model 4.2 (M4.2) shows much the same results in relative form. Removal of F50 statistics shows MG in Attacking Midfield, both in total and when possession is retained by a team to be key. All models improve on their Model set 3 baseline equivalent, attributable to these MG statistics, with prediction approaching levels seen with many more variables in M2.1 and M2.2.
Model 5.1 (M5.1) introduces feature distributions of player contributions, with Effective Kicks in total and attributable to the top 50% and 25% of players key. Model 5.2 (M5.2) shows similar results in relative form. Model 5.3 (M5.3) shows the importance of I50 in total and by the top 50% of a team, while the negative association of R50s is again present at 50% and whole team levels. Model set 5 iterations all produce results very similar to the Model set 3 equivalents, with little additional predictive power attributable to this additional data.
Residual plots of each model are available in Supplement 3, which suggest that better predictions are made when quarter margins are smaller, where a greater proportion of results are. Prediction improved largely uniformly regardless of margin albeit with slightly better prediction of larger margins (~20+ points) in the best performing models.
4. Discussion
This study sought to determine which incrementally more detailed technical and tactical match-play data better predicts AFLW match outcomes (win/loss and margin), and to identify the most important predictors of team performance. By using the most comprehensively detailed and longitudinal datasets within the AFLW to date, it enabled comparisons of the value associated with each level of detail, as well as when in combination with each other. Key variables for predictive team success have been identified in addition to general commentary on the usage of data going forward to assist with the previously outlined issue of the better utilisation and future allocation of scarce resources with a summary available in the conclusion in . Each model presented has practical value, meaning that interpreting each is beneficial, albeit some with greater predictive power and accuracy relative to others, although some of these improvements were obtained at the cost of a substantially greater number of variables utilised.
Table 5. Summary table of key practical insights surrounding usage of data details and key variables for coaches and sport practitioners.
4.1. Value of detail levels in data
The addition of relative statistics between teams improves prediction substantially in all MAE and accuracy results. Important variable lists also primarily feature these relative statistics with high MDGI when applied, giving further weight to its importance. This is consistent with past observations in the AFL (Young, Luo, Gastin, Tran, et al., Citation2019) and AFLW (Cust et al., Citation2019). As a result, relative data should be considered an essential detail level for all team analyses of technical match-play performance.
The best prediction came through the application of all available variables including opposition statistics. While valuable, it is difficult to both access and manage all this data effectively when available. Notably, a lot of the value in the All Statistics dataset appeared to be derived from the MG variables also utilised in M4.1-M4.3. Evidence of this comes in both observation of the key variables of M2.1 and 2.2, as well as the MAE of Model set 4, which is the closest in performance to the All Statistics data. In the interests of data dimensionality, the usage of MG variables in addition to baseline variables is likely the best number of initial variables to start with, as it gives a fair representation of all available data in a more manageable way.
Zone of field data has previously been found to be influential in positional classification (Barake et al., Citation2021), with this study being the first time it has been applied in a match-play prediction context in women’s AF. Zone of Field data was found to substantially increase prediction in all cases, as it is interacted with other variables. This shows the importance of the contextual information behind variables, with the location of Kicks, especially Effective Kicks, being a superior predictive variable relative to the non-locational version important in Model set 1. Further analysis of key variables in models using locational information finds that actions in F50, are the most predictive, which does suggest that the number of actions in that zone may be more important than the specific action undertaken in the zone. At the same time, the presence of Effective Kicks in F50, which represents effective ball usage in this area, is the most important aspect of match-play.
Removal of F50 data in the third iteration of Model sets 3–5 (M3.3, M4.3, M5.3) supports the view that getting the ball into this zone is of high importance, with a reduction in predictive power in all cases of removal, although quality predictions are still found. The presence and relative importance of I50 variables in these iterations may still suggest that getting the ball into F50 is the biggest indicator of success (as it is more difficult to score a goal from outside the F50). This provides insight to utilise in terms of tactical practical application; however, it is also a factor to account for in future modelling interpretation due to it representing a variable that is a prerequisite to scoring. Overall, the capture and employment of this locational data should be prioritised, although care must be taken in its usage and interpretation of results derived from it.
While Model set 5 included feature distributions and locational components, the addition of these features did not improve prediction by MAE in the current study. This differs to findings reported by Cust et al. (Citation2019), which suggested the importance of individual player contributions, particularly in the top 25% of the team (although locational components were not utilised in the model). This pulls into question the past assertion that individual key player performances contribute more to match-play success than team performance in the AFLW. To truly test this, alternative methodology should be sought, with the use of all individual player data through a method that can handle this dimensionality. One such method is neural networks (e.g. Convolution Neural Networks with multiple channels), albeit with issues surrounding large sample requirements and variable interpretation associated with its usage (Chollet, Citation2017). For now, this dataset requires additional feature generation that requires care in its use, which is likely not worth the comparatively marginal benefits that may be derived compared to results presented in this study.
4.2. Important variable interpretation
Model set 1 can be compared to previous literature with the caveat of a different timeframe and holdout test set limiting a truly fair comparison. In terms of MAE, Cust et al. (Citation2019) reported a best result of 7.63 points on a holdout test set prediction of quarter margin using decision trees, while producing a best MAE of 5.12 points using Generalised Estimating Equations, although this was using training data. Models produced in this study improve on previous literature with the application of random forests, even on the comparable datasets of Model set 1. This may be in part due to the greater data availability, but our analysis outperformed previous literature on a test set, even when compared to performance on the training data in Cust et al. (Citation2019), suggesting a greater robustness of our results.
Variables that were important in M1.1 and 1.2 shared some similarity with previous results (Black et al., Citation2019; Cust et al., Citation2019; Dwyer et al., Citation2022). Kicks, Disposal Efficiency, and Relative I50s were identified as important variables in previous models and remain so in our analyses. Other previously identified key variables, such as Uncontested Possessions (Black et al., Citation2019) and Contested Possessions (Dwyer et al., Citation2022), were not present in variable lists of either comparable model. Alternatively, Turnovers, R50s and Clearances were not previously deemed important in past analyses. This suggests that with a greater sample size of additional seasons, Turnovers, R50s and Clearances have become more prominent in influencing match outcome. Interestingly, Black et al. (Citation2019) previously suggested that I50s were not associated with match-play success in the AFLW, a result directly contradictory to what is seen in not just M1.1, but the majority of our models. Such differences between the results of our study and that of previous literature may reflect the ongoing evolution of the game and how gaining possession of the football from the opposition is becoming increasingly important regarding score margin and match outcome.
Dwyer et al. (Citation2022) performed correlation significance tests, which do not allow for non-linear relationships like the random forests used in this research methodology. This is reflected in many important variables discovered in our analysis not being the highest in correlation to the dependent variable in initial exploratory data analysis or similar to what Dwyer et al. (Citation2022) presented, showing the value of the non-linear analysis.
4.3. Usage of predictive modelling on aggregate match-play data
While this research presents results of key performance variables in available data, issues arise that largely stem from the application of aggregated data and predictive models. Many variables in these datasets are relatively obvious, high likelihood precursors to actions that result in increased win probability (e.g. an I50 is required to score a goal which naturally improves win probability). While a key variable, the contextual information of the process or chain-of-play that precedes an I50 may hold more value than these aggregate measures.
Approaching match-play performance from a technical and tactical perspective in this process-oriented manner is congruent with literature expressing match-play performance as dynamic systems in wider team invasion sport performance analysis (Travassos et al., Citation2013; Vilar et al., Citation2012). This may be achieved with the usage of analyses focused on the chain-of-play or states of play, for example through Markov modelling (Barkell et al., Citation2017; Meyer et al., Citation2006) or network analysis as has been done in the men’s AFL (Young, Luo, Gastin, Lai, et al., Citation2019).
Despite these challenges associated with interpretation of results, there is still usefulness that comes from applying predictive models on aggregate team statistics. In this instance, variables like that of I50s, kicks and effective kicks in F50, and MG in F50 or MG Retained can be used as a state or objective to aim for which leads to positive results in match-play when employing process-oriented example methods like network analysis or Markov models. This is in addition to the presented aggregate metrics which can still be used by teams and practitioners as key performance indicators to assist in match analysis and pre-match preparation. It is evident though that great care should be taken in interpreting the insights aggregate measures produce, with value existing in results, but elaboration needed in following studies to verify or improve upon initial insights created.
Further contexts and combinations with other data sources like that of GPS performance and locational data, represent a way forward to produce more holistic representations, leading to more targeted, actionable insights for practitioners. Examples of this approach may include mapping of team structure, positioning, and its decision-making impacts, as is starting to be explored in the AFL (Alexander, Spencer, Mara, et al., Citation2019; Alexander, Spencer, Sweeting, et al., Citation2019; Spencer et al., Citation2019). With that in mind, challenges surrounding the utilisation of GPS data in the AFLW have been previously documented due to the requirement of team collaboration in a directly competitive league, otherwise results will be heavily biased to the available team’s data (van der Vegt et al., Citation2023b). The next step to unlocking the ability to perform these analyses is greater care and depth of data collection within the AFLW; a difficult task in a league with limited resources compared to the AFL.
Despite the identified limitations and assumptions of this application, it produces the most robust representation of technical match-play to date while also presenting commentary on the detail captured in available data, assisting in future research and industry practices. Results should also be taken with the caveat for future use that this is a snapshot in time, meaning that relationships may need to be reassessed with similar methodology in the future as the game evolves. Individual team game styles may also influence the relevance of results; a factor to consider in future analyses.
5. Conclusion
This study provides the most in-depth analysis of women’s AF technical and tactical performance to predict match outcome to date, in terms of detail and timeframe of data used. Findings bring clarity to the value of current data available, while suggesting areas to pursue for future research. Thirteen models were analysed, each representing different levels of detail available in the dataset. From each model, key technical variables contributing to match-play success were determined with commentary surrounding the value of individual levels of detail. This is summarised in .
Future research should expand upon these findings to explore more granular, chain-of-play data and consider methodologies like Markov models or network analysis. Important technical performance indicators presented can be applied by practitioners as a method of determining subsequent dependent variables that represent an advantageous state of play in future process-oriented models.
Disclosure statement
No potential conflict of interest was reported by the author(s).
Data availability statement
Data not available due to commercial restrictions. Due to the nature of the research, commercial supporting data is not available.
Additional information
Funding
References
- Alexander, J. P., Spencer, B., Mara, J. K., & Robertson, S. (2019). Collective team behaviour of Australian rules football during phases of match play [article]. Journal of Sports Sciences, 37(3), 237–243. https://doi.org/10.1080/02640414.2018.1491113
- Alexander, J. P., Spencer, B., Sweeting, A. J., Mara, J. K., & Robertson, S. (2019). The influence of match phase and field position on collective team behaviour in Australian rules football [article]. Journal of Sports Sciences, 37(15), 1699–1707. https://doi.org/10.1080/02640414.2019.1586077
- Aminikhanghahi, S., & Cook, D. J. (2017). A survey of methods for time series change point detection [article]. Knowledge and Information Systems, 51(2), 339–367. https://doi.org/10.1007/s10115-016-0987-z
- Barake, A. J., Mitchell, H., Stavros, C., Stewart, M. F., & Srivastava, P. (2021). Classifying player positions in second-tier Australian football competitions using technical skill indicators [article]. International Journal of Sports Science & Coaching, 17(1), 73–82. https://doi.org/10.1177/17479541211010281
- Barkell, J. F., Pope, A., O’Connor, D., & Cotton, W. G. (2017). Predictive game patterns in world rugby sevens series games using Markov chain analysis [article]. International Journal of Performance Analysis in Sport, 17(4), 630–641. https://doi.org/10.1080/24748668.2017.1381459
- Black, G. M., Gabbett, T. J., Johnston, R. D., Cole, M. H., Naughton, G., & Dawson, B. (2019). A skill profile of the national women’s Australian football league (AFLW) [article]. Science and Medicine in Football, 3(2), 138–142. https://doi.org/10.1080/24733938.2018.1489140
- Breiman, L. (2001). Random forests [article]. Machine Learning, 45(1), 5–32. https://doi.org/10.1023/A:1010933404324
- Chollet, F. (2017). Deep learning with Python. Manning.
- Cust, E. E., Sweeting, A. J., Ball, K., Anderson, H., & Robertson, S. (2019). The relationship of team and individual athlete performances on match quarter outcome in elite women’s Australian rules football [article]. Journal of Science & Medicine in Sport, 22(10), 1157–1162. https://doi.org/10.1016/j.jsams.2019.05.004
- Dwyer, D. B., DiDomenico, I., & Young, C. M. (2022). Technical performance in elite women’s Australian football–comparisons with men’s football, identifying important performance characteristics and apparent trends [article]. International Journal of Performance Analysis in Sport, 22(1), 29–37. https://doi.org/10.1080/24748668.2021.1993029
- Emmonds, S., Heyward, O., & Jones, B. (2019). The challenge of applying and undertaking research in female sport [article]. Sports Medicine - Open, 5(1), 51. https://doi.org/10.1186/s40798-019-0224-x
- Hastie, T., Tibshirani, R., & Friedman, J. (2009). The elements of statistical learning. Springer. https://doi.org/10.1007/978-0-387-84858-7
- James, G., Witten, D., Hastie, T., & Tibshirani, R. (2013). An introduction to statistical learning (1 ed.). Springer. https://doi.org/10.1007/978-1-4614-7138-7
- Lord, F., Pyne, D. B., Welvaert, M., & Mara, J. K. (2020). Methods of performance analysis in team invasion sports: A systematic review [article]. Journal of Sports Sciences, 38(20), 2338–2349. https://doi.org/10.1080/02640414.2020.1785185
- Lundberg, S., & Lee, S. (2017). DeepSHAP. Advances in neural information processing systems, 30. https://proceedings.neurips.cc/paper/2017/file/8a20a8621978632d76c43dfd28b67767-Paper.pdf
- Meyer, D., Forbes, D., & Clarke, S. R. (2006). Statistical analysis of notational AFL data using continuous time Markov chains. Journal of Sports Science & Medicine, 5(4), 525–532.
- Moreira Praça, G., Braga Jacinto, A. L., de Sousa Pinheiro, G., de Oliveira Abreu, C., & Teoldo da Costa, V. (2023). What are the key performance indicators related to winning matches in the German Bundesliga? International Journal of Performance Analysis in Sport, 23(4), 284–295. https://doi.org/10.1080/24748668.2023.2227923
- R Core Team. (2018). R: A language and environment for statistical computing. R Foundation for Statistical Computing. https://www.R-project.org/
- Robertson, S., Gupta, R., & McIntosh, S. (2016). A method to assess the influence of individual player performance distribution on match outcome in team sports [article]. Journal of Sports Sciences, 34(19), 1893–1900. https://doi.org/10.1080/02640414.2016.1142106
- Spencer, B., Jackson, K., Bedin, T., & Robertson, S. (2019). Modelling the quality of player passing decisions in Australian rules football relative to risk, reward and commitment [article]. Frontiers in Psychology, 10(JULY), 1777. https://doi.org/10.3389/fpsyg.2019.01777
- Travassos, B., Davids, K., Araújo, D., & Esteves, P. T. (2013). Performance analysis in team sports: Advances from an ecological dynamics approach [article]. International Journal of Performance Analysis in Sport, 13(1), 83–95. https://doi.org/10.1080/24748668.2013.11868633
- van der Vegt, B., Gepp, A., Keogh, J., & Farley, J. B. (2023a). An investigation of data-driven player positional roles within the Australian football league women’s competition using technical skill match-play data [article]. International Journal of Sports Science & Coaching, 19(3), 1130–1142. https://doi.org/10.1177/17479541231203895
- van der Vegt, B., Gepp, A., Keogh, J., & Farley, J. B. (2023b). Methods of performance analysis in women’s Australian football: A scoping review. PeerJ, 11, e14946. https://doi.org/10.7717/peerj.14946
- Vilar, L., Araújo, D., Davids, K., & Button, C. (2012). The role of ecological dynamics in analysing performance in team sports [article]. Sports Medicine, 42(1), 1–10. https://doi.org/10.2165/11596520-000000000-00000
- Young, C. M., Luo, W., Gastin, P., Lai, J., & Dwyer, D. B. (2019). Understanding effective tactics in Australian football using network analysis [article]. International Journal of Performance Analysis in Sport, 19(3), 331–341. https://doi.org/10.1080/24748668.2019.1605562
- Young, C. M., Luo, W., Gastin, P., Tran, J., & Dwyer, D. (2019). Modelling match outcome in Australian football: Improved accuracy with large databases [article]. International Journal of Computer Science in Sport, 18(1), 80–92. https://doi.org/10.2478/ijcss-2019-0005